| Param | Original file | Final file |
|---|---|---|
| Filename | modeM0/AS1G05_238T02_9000000420_03023cztM0_level2.evt | modeM0/AS1G05_238T02_9000000420_03023cztM0_level2_quad_clean.evt |
| Size (bytes) | 392,932,800 | 48,988,800 |
| Size | 374.7 MB | 46.7 MB |
| Events in quadrant A | 3,057,585 | 284,495 |
| Events in quadrant B | 2,807,930 | 285,033 |
| Events in quadrant C | 2,922,300 | 273,960 |
| Events in quadrant D | 2,752,201 | 268,598 |
| Mode M0 | |||
|---|---|---|---|
| Quadrant | BADHDUFLAG | Total packets | Discarded packets |
| A | 0 | 12600 | 3 |
| B | 0 | 11581 | 2 |
| C | 0 | 12313 | 2 |
| D | 0 | 11820 | 2 |
| Mode SS | |||
|---|---|---|---|
| Quadrant | BADHDUFLAG | Total packets | Discarded packets |
| A | 0 | 108 | 0 |
| B | 0 | 108 | 0 |
| C | 0 | 108 | 0 |
| D | 0 | 108 | 0 |
| Mode M9 | |||
|---|---|---|---|
| Quadrant | BADHDUFLAG | Total packets | Discarded packets |
| A | 0 | 44 | 0 |
| B | 0 | 44 | 0 |
| C | 0 | 44 | 0 |
| D | 0 | 44 | 0 |
| Quadrant | Total seconds | Saturated seconds | Saturation percentage |
|---|---|---|---|
| A | 5301 | 20 | 0.377287% |
| B | 5301 | 33 | 0.622524% |
| C | 5301 | 106 | 1.999623% |
| D | 5301 | 72 | 1.358234% |
Noise dominated data is calculated using 1-second bins in cleaned event files. If a bin has >2000 counts, and if more than 50% of those come from <1% of pixels, then it is considered to be noise-dominated and hence unusable.
| Quadrant | # 1 sec bins | Bins with >0 counts | Bins with >2000 counts | High rate bins dominated by noise | Noise dominated (total time) | Noise dominated (detector-on time) | Marked lightcurve |
|---|---|---|---|---|---|---|---|
| A | 9612 | 5303 | 7 | 7 | 0.07% | 0.13% | 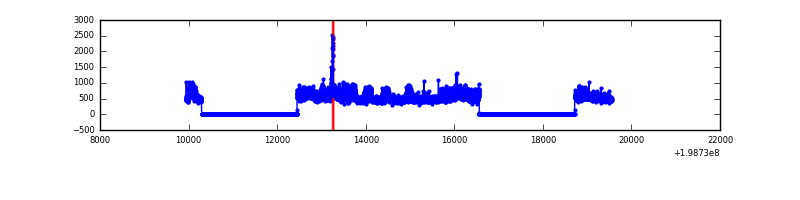 |
| B | 9612 | 5303 | 27 | 27 | 0.28% | 0.51% | 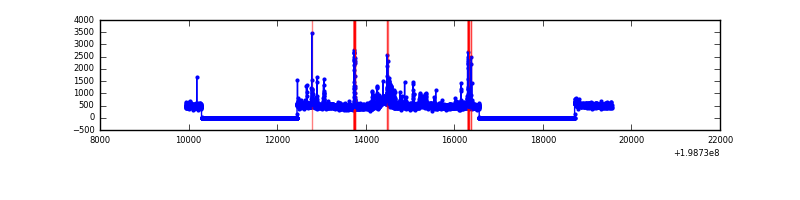 |
| C | 9612 | 5303 | 105 | 105 | 1.09% | 1.98% | 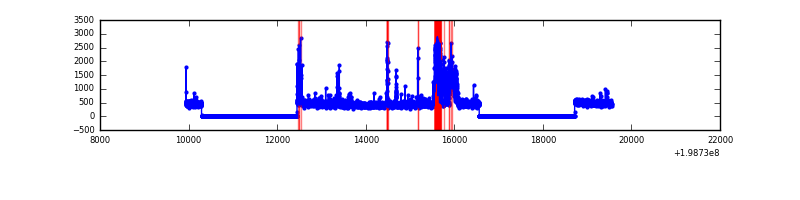 |
| D | 9612 | 5303 | 55 | 55 | 0.57% | 1.04% | 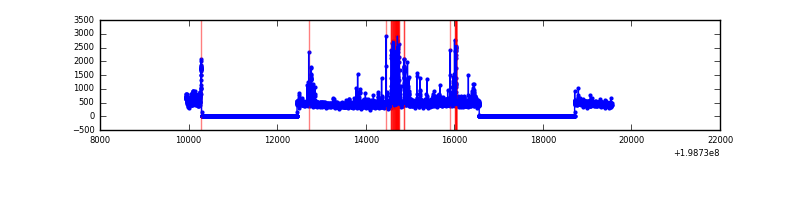 |
Top three noisy pixels from each quadrant. If the there are fewer than three noisy pixels in the level2.evt file, extra rows are filled as -1
| Pixel properties | Quadrant properties | ||||||
|---|---|---|---|---|---|---|---|
| Quadrant | DetID | PixID | Counts | Sigma | Mean | Median | Sigma |
| A | 8 | 15 | 562698 | 4524.66 | 615 | 605 | 124.2 |
| A | 0 | 50 | 93320 | 746.33 | 615 | 605 | 124.2 |
| A | 13 | 14 | 11058 | 84.14 | 615 | 605 | 124.2 |
| B | 0 | 230 | 112732 | 955.54 | 622 | 609 | 117.3 |
| B | 2 | 249 | 91313 | 773.0 | 622 | 609 | 117.3 |
| B | 15 | 204 | 86807 | 734.6 | 622 | 609 | 117.3 |
| C | 1 | 192 | 493196 | 3612.63 | 588 | 591 | 136.4 |
| C | 6 | 80 | 96436 | 702.9 | 588 | 591 | 136.4 |
| C | 15 | 208 | 13192 | 92.41 | 588 | 591 | 136.4 |
| D | 7 | 80 | 237809 | 1697.78 | 586 | 572 | 139.7 |
| D | 13 | 114 | 136736 | 974.46 | 586 | 572 | 139.7 |
| D | 15 | 35 | 47975 | 339.24 | 586 | 572 | 139.7 |
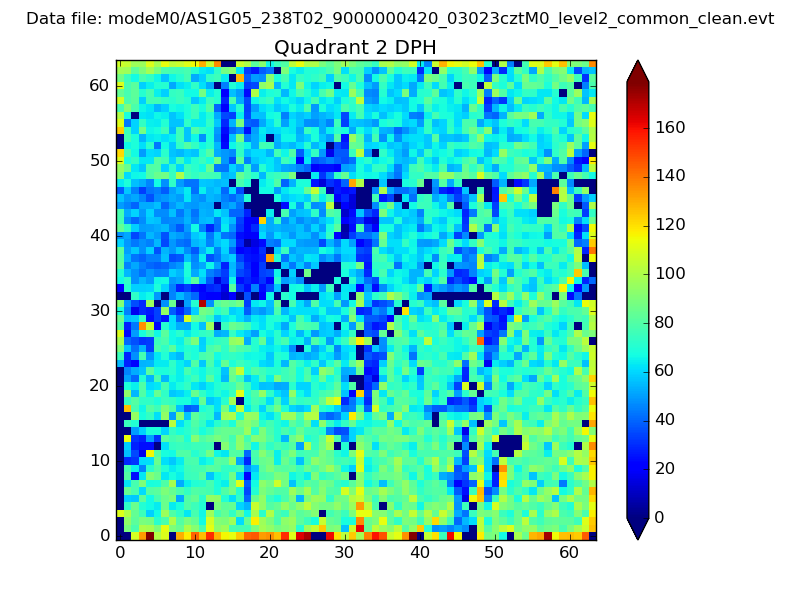
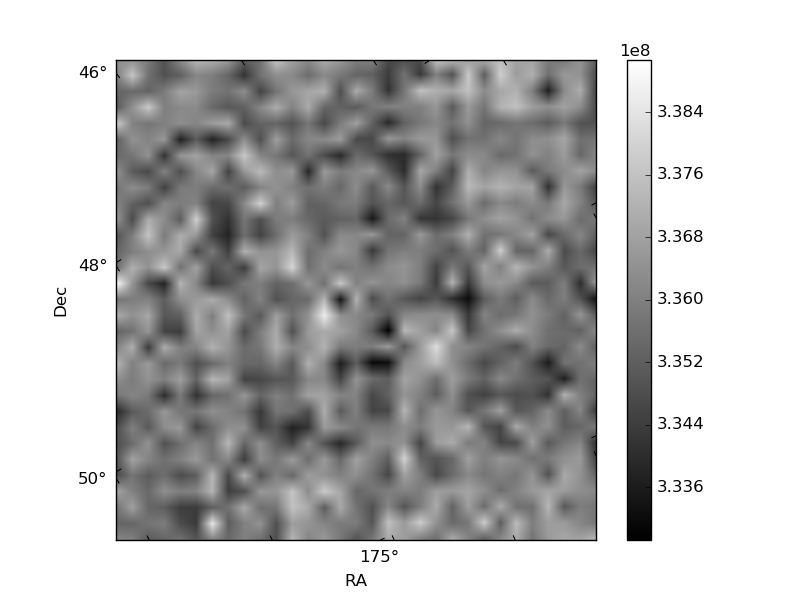
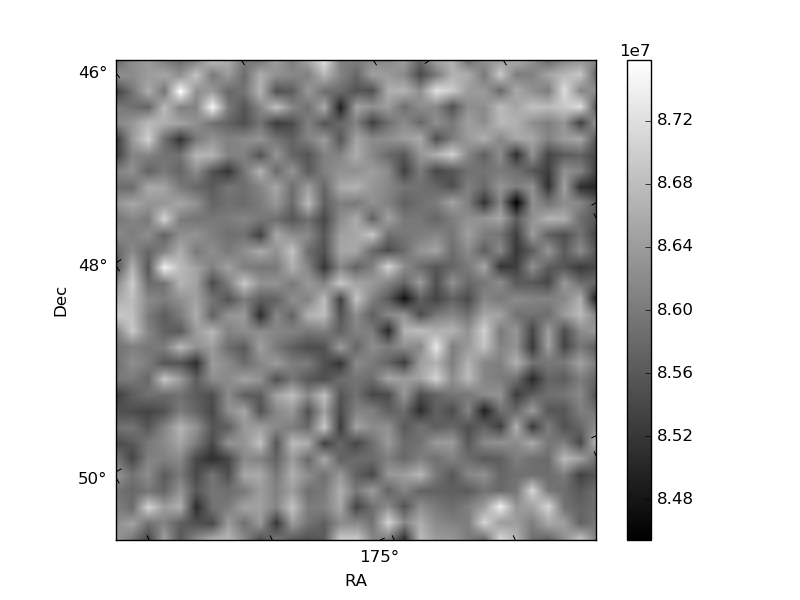
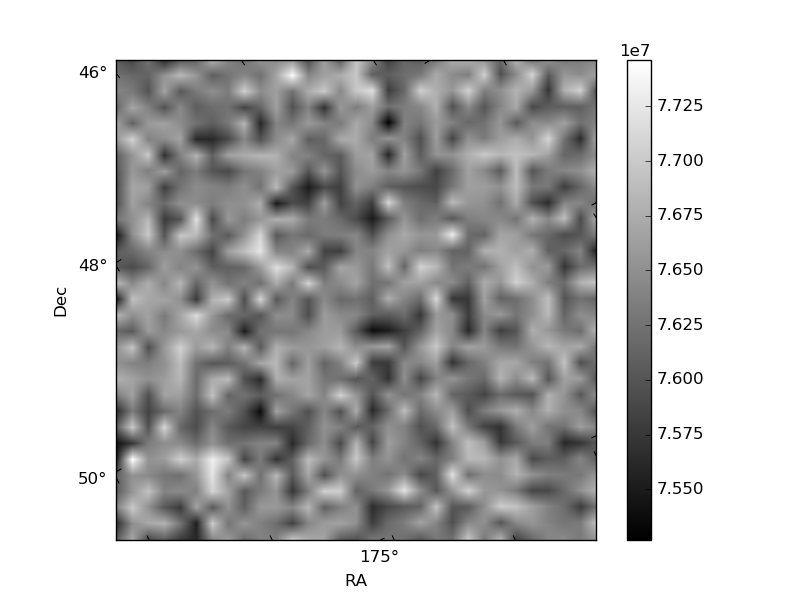
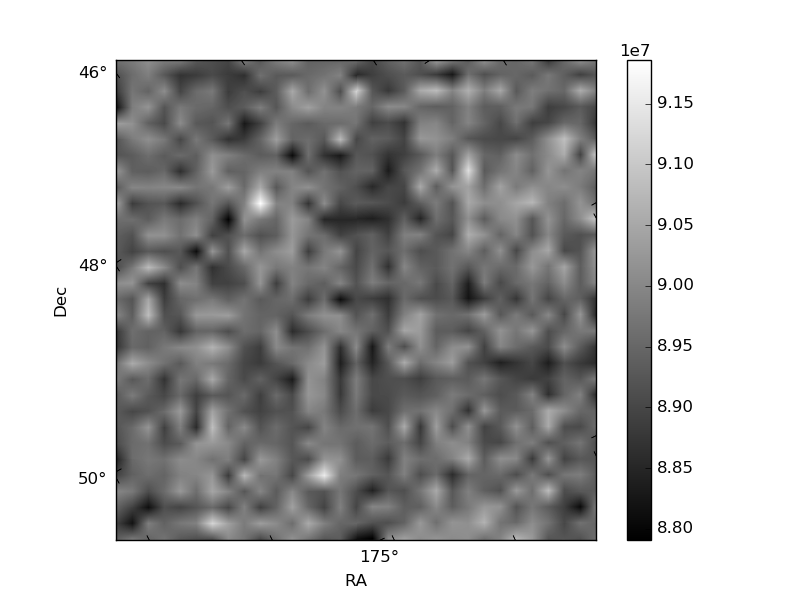
Histogram calculated using DETX and DETY for each event in the final _common_clean file
| Quadrant A | 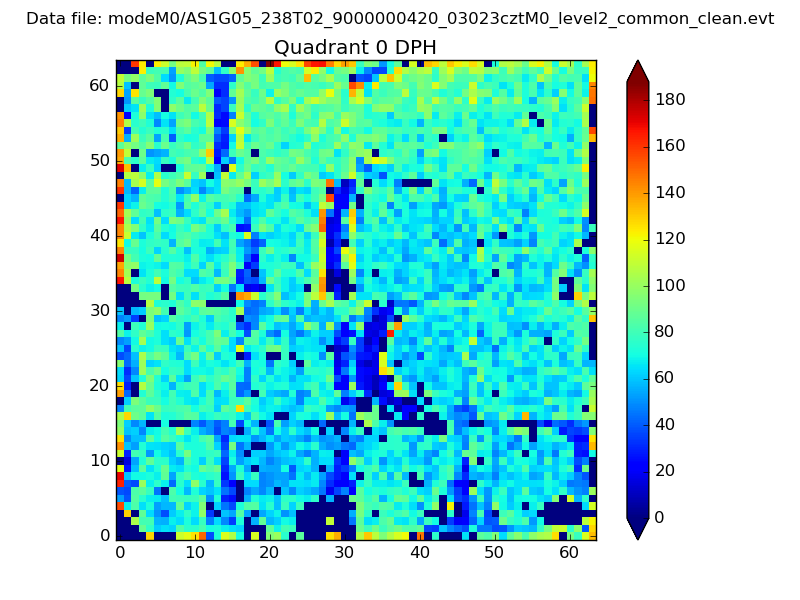 |
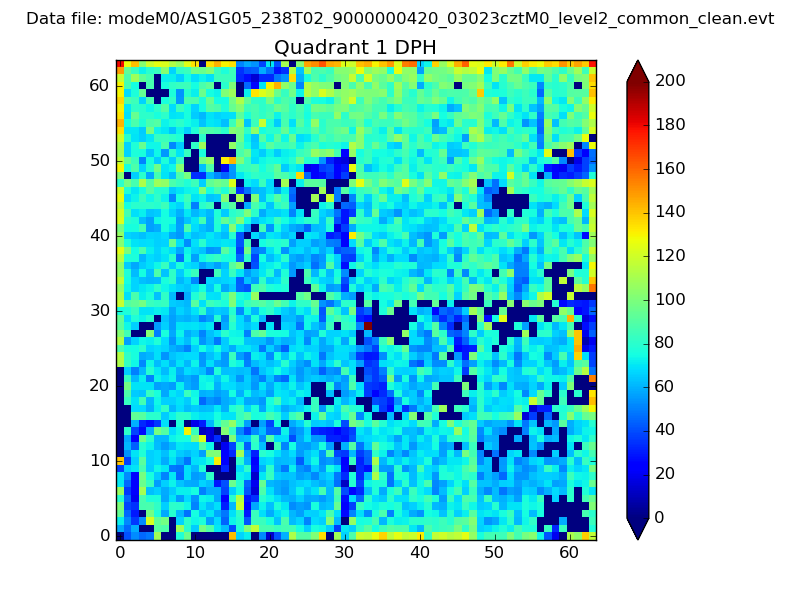 |
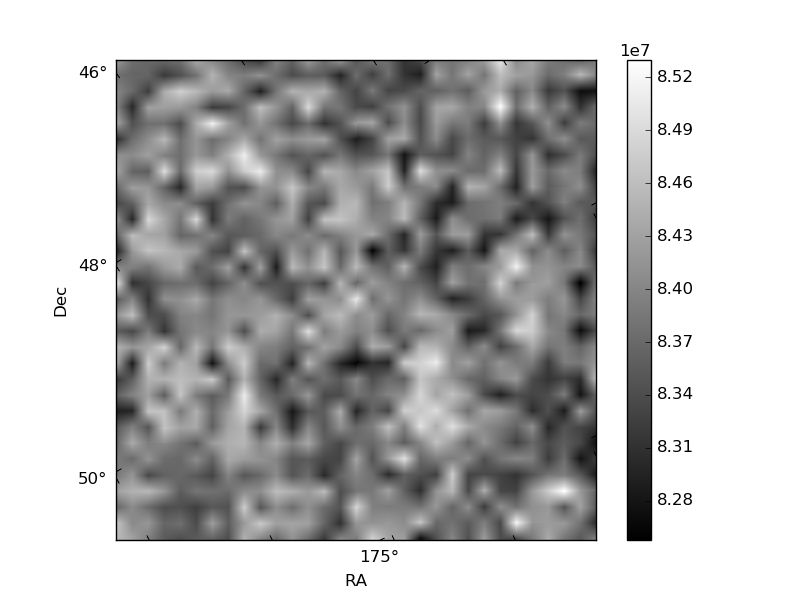
Quadrant B |
|---|---|---|---|
| Quadrant D | 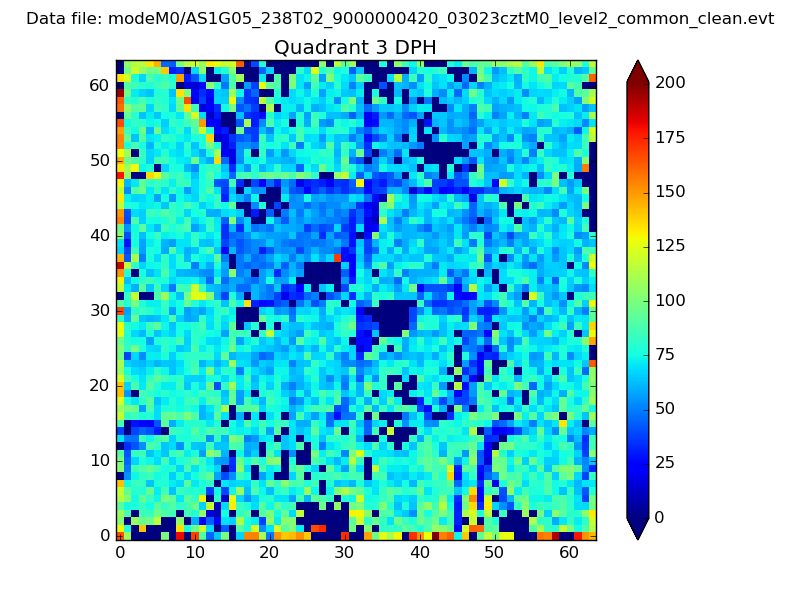 |
 |
Quadrant C |
| Plot type | Count rate plots | Images |
|---|---|---|
| Comparison with Poisson distribution Blue bars denote a histogram of data divided into 1 sec bins. Red curve is a Poisson curve with rate = median count rate of data. |
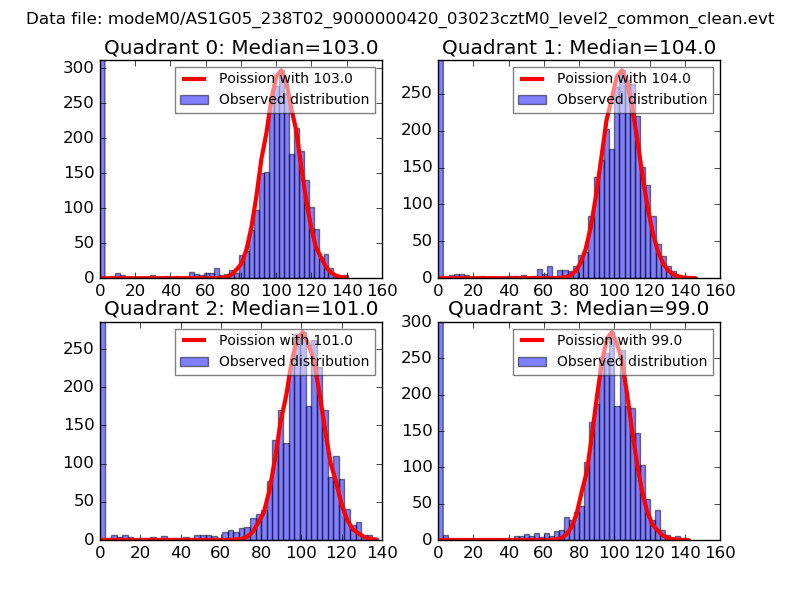 |
 |
| Quadrant-wise count rates Data is divided into 100 sec bins |
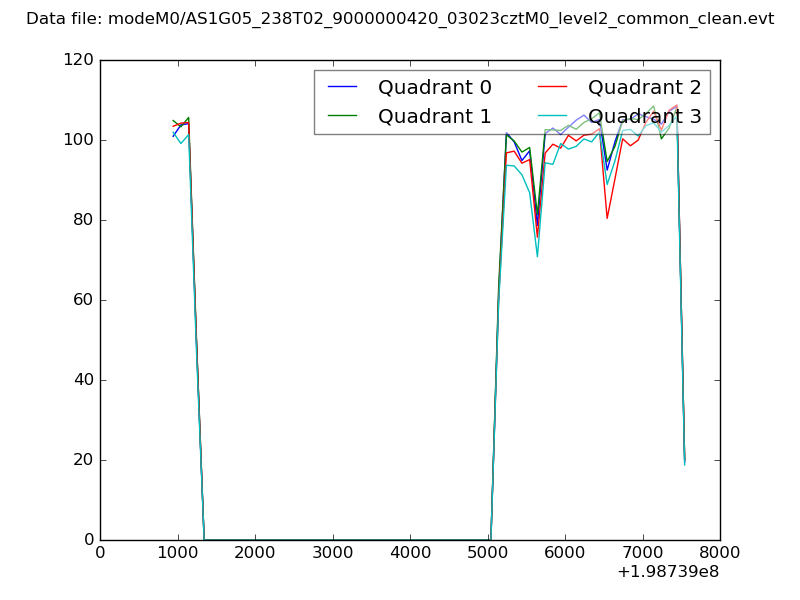 |
|
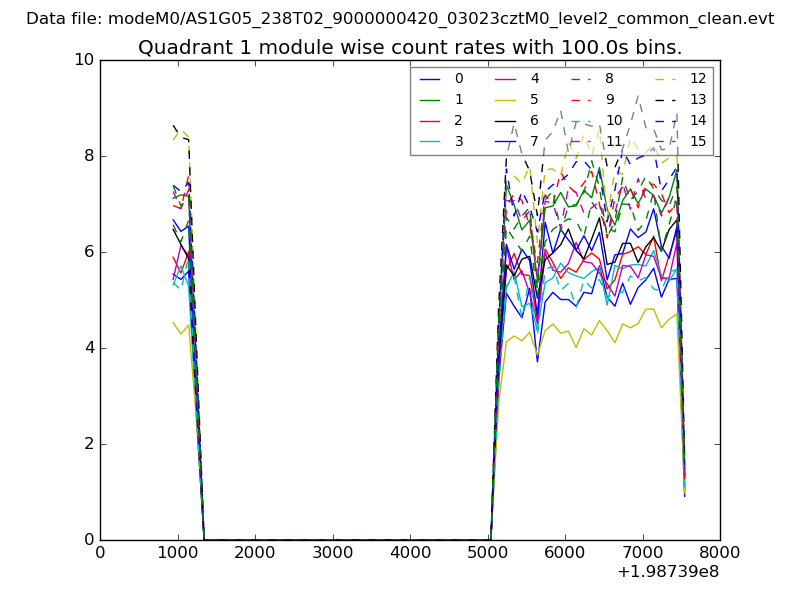
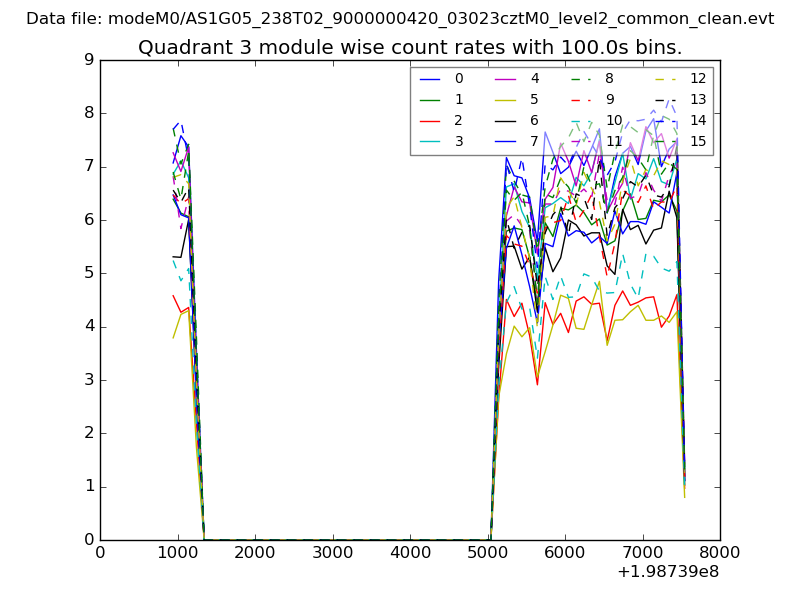
| Module-wise count rates for Quadrant A Data is divided into 100 sec bins |
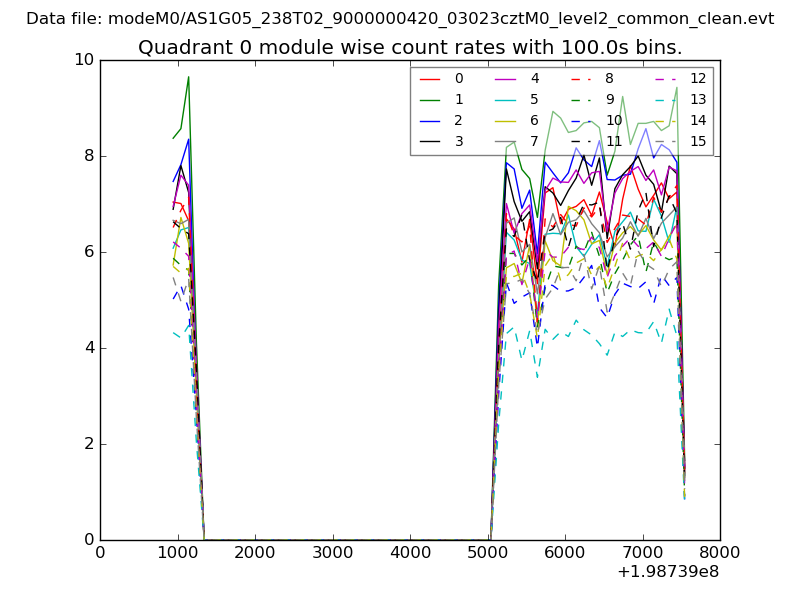 |
 |
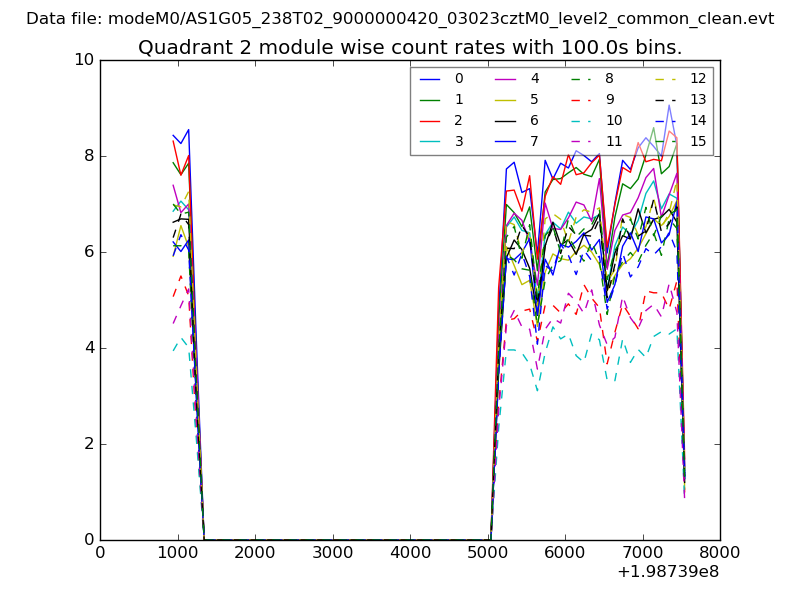
| Module-wise count rates for Quadrant B Data is divided into 100 sec bins |
 |
 |
| Module-wise count rates for Quadrant C Data is divided into 100 sec bins |
 |
 |
| Module-wise count rates for Quadrant D Data is divided into 100 sec bins |
 |
 |
| Parameter | Plot |
|---|---|
| CZT HV Monitor | 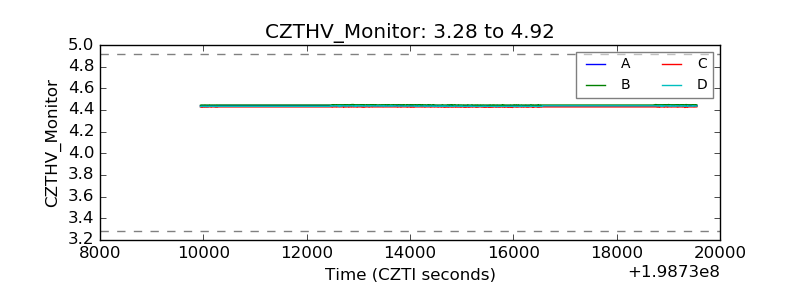 |
| D_VDD | 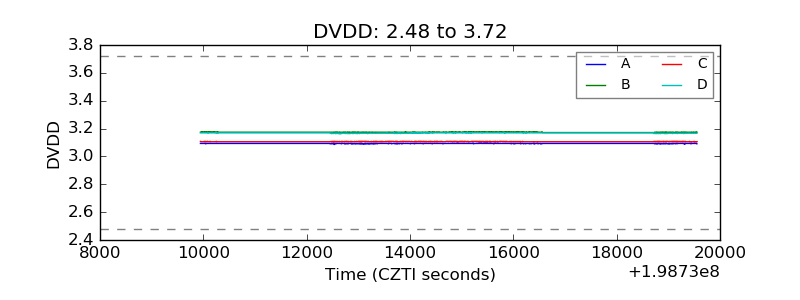 |
| Temperature 1 | 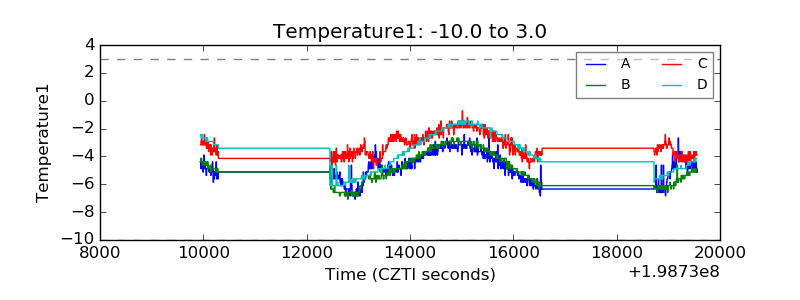 |
| Veto HV Monitor | 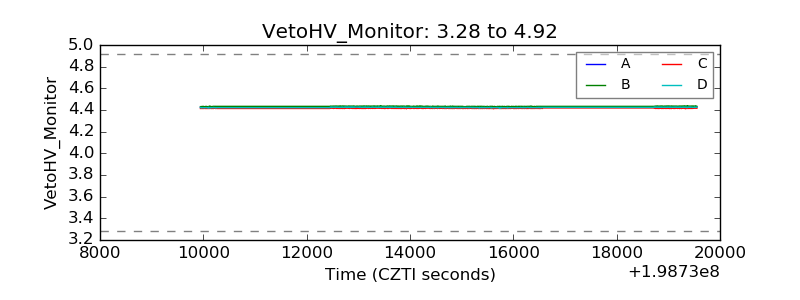 |
| Veto LLD | 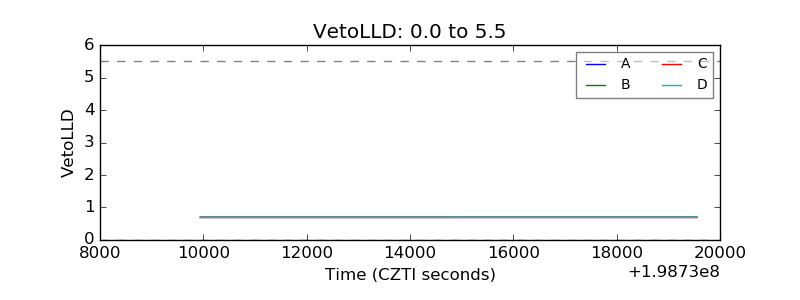 |
| Alpha Counter | 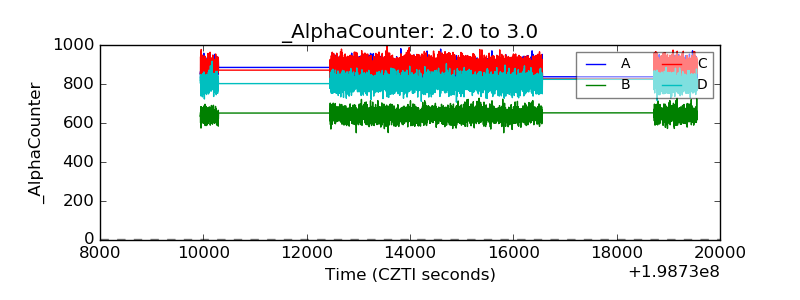 |
| _CPM_Rate | 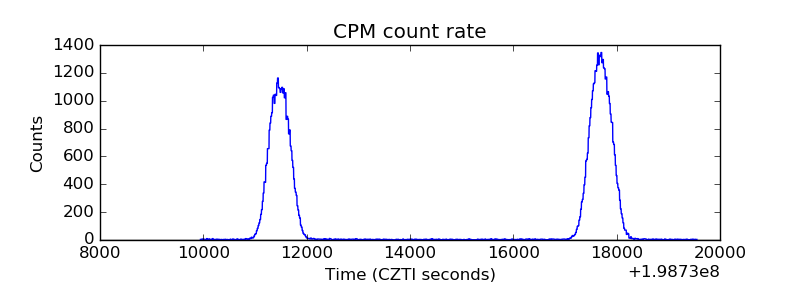 |
| CZT Counter | 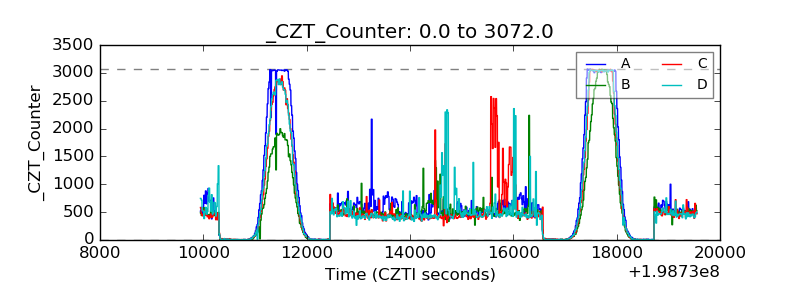 |
| +2.5 Volts monitor |  |
| +5 Volts monitor |  |
| Veto Counter | 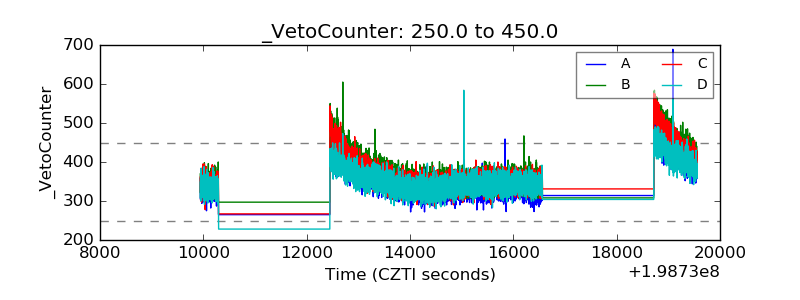 |