| Param | Original file | Final file |
|---|---|---|
| Filename | modeM0/AS1G05_238T02_9000000420_03025cztM0_level2.evt | modeM0/AS1G05_238T02_9000000420_03025cztM0_level2_quad_clean.evt |
| Size (bytes) | 369,783,360 | 67,674,240 |
| Size | 352.7 MB | 64.5 MB |
| Events in quadrant A | 2,542,450 | 430,923 |
| Events in quadrant B | 2,880,598 | 428,990 |
| Events in quadrant C | 2,457,215 | 417,535 |
| Events in quadrant D | 2,963,641 | 406,242 |
| Mode M0 | |||
|---|---|---|---|
| Quadrant | BADHDUFLAG | Total packets | Discarded packets |
| A | 0 | 10634 | 3 |
| B | 0 | 11728 | 2 |
| C | 0 | 10805 | 2 |
| D | 0 | 12234 | 2 |
| Mode SS | |||
|---|---|---|---|
| Quadrant | BADHDUFLAG | Total packets | Discarded packets |
| A | 0 | 106 | 0 |
| B | 0 | 106 | 0 |
| C | 0 | 106 | 0 |
| D | 0 | 106 | 0 |
| Mode M9 | |||
|---|---|---|---|
| Quadrant | BADHDUFLAG | Total packets | Discarded packets |
| A | 0 | 31 | 0 |
| B | 0 | 31 | 0 |
| C | 0 | 31 | 0 |
| D | 0 | 32 | 0 |
| Quadrant | Total seconds | Saturated seconds | Saturation percentage |
|---|---|---|---|
| A | 5218 | 4 | 0.076658% |
| B | 5218 | 28 | 0.536604% |
| C | 5218 | 16 | 0.306631% |
| D | 5218 | 28 | 0.536604% |
Noise dominated data is calculated using 1-second bins in cleaned event files. If a bin has >2000 counts, and if more than 50% of those come from <1% of pixels, then it is considered to be noise-dominated and hence unusable.
| Quadrant | # 1 sec bins | Bins with >0 counts | Bins with >2000 counts | High rate bins dominated by noise | Noise dominated (total time) | Noise dominated (detector-on time) | Marked lightcurve |
|---|---|---|---|---|---|---|---|
| A | 7374 | 5219 | 0 | 0 | 0.00% | 0.00% | 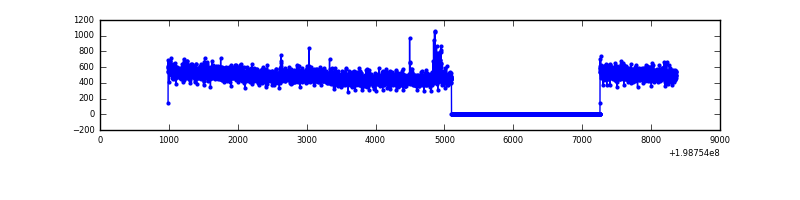 |
| B | 7374 | 5219 | 27 | 27 | 0.37% | 0.52% | 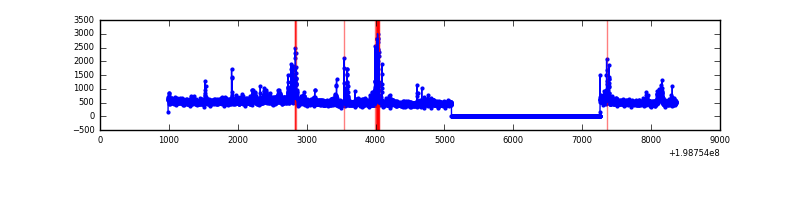 |
| C | 7374 | 5219 | 11 | 11 | 0.15% | 0.21% | 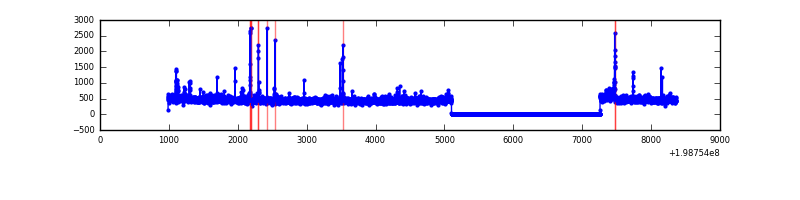 |
| D | 7374 | 5219 | 26 | 26 | 0.35% | 0.50% | 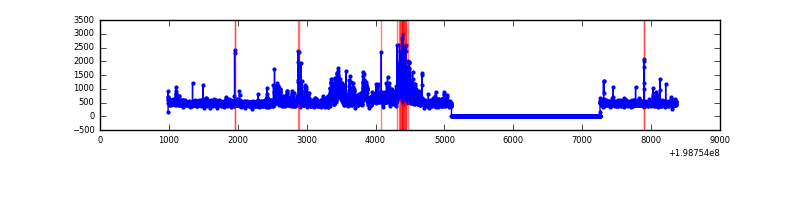 |
Top three noisy pixels from each quadrant. If the there are fewer than three noisy pixels in the level2.evt file, extra rows are filled as -1
| Pixel properties | Quadrant properties | ||||||
|---|---|---|---|---|---|---|---|
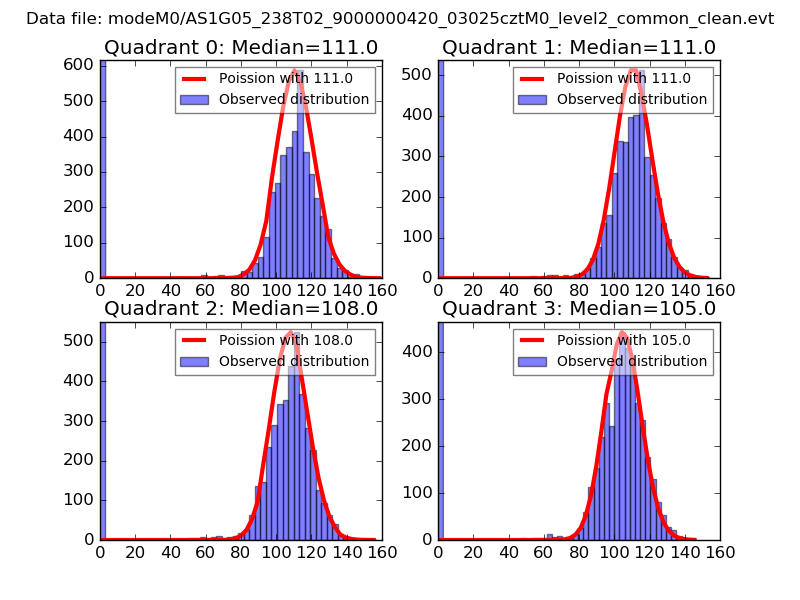
| Quadrant | DetID | PixID | Counts | Sigma | Mean | Median | Sigma |
| A | 8 | 15 | 119541 | 950.93 | 619 | 608 | 125.1 |
| A | 13 | 14 | 13160 | 100.36 | 619 | 608 | 125.1 |
| A | 0 | 50 | 11092 | 83.82 | 619 | 608 | 125.1 |
| B | 15 | 204 | 157406 | 1332.16 | 621 | 610 | 117.7 |
| B | 14 | 167 | 105029 | 887.16 | 621 | 610 | 117.7 |
| B | 0 | 219 | 92582 | 781.4 | 621 | 610 | 117.7 |
| C | 6 | 80 | 66923 | 482.3 | 591 | 595 | 137.5 |
| C | 1 | 192 | 34436 | 246.07 | 591 | 595 | 137.5 |
| C | 0 | 219 | 15806 | 110.6 | 591 | 595 | 137.5 |
| D | 13 | 114 | 507571 | 3634.69 | 592 | 580 | 139.5 |
| D | 7 | 80 | 58958 | 418.52 | 592 | 580 | 139.5 |
| D | 14 | 113 | 36600 | 258.23 | 592 | 580 | 139.5 |
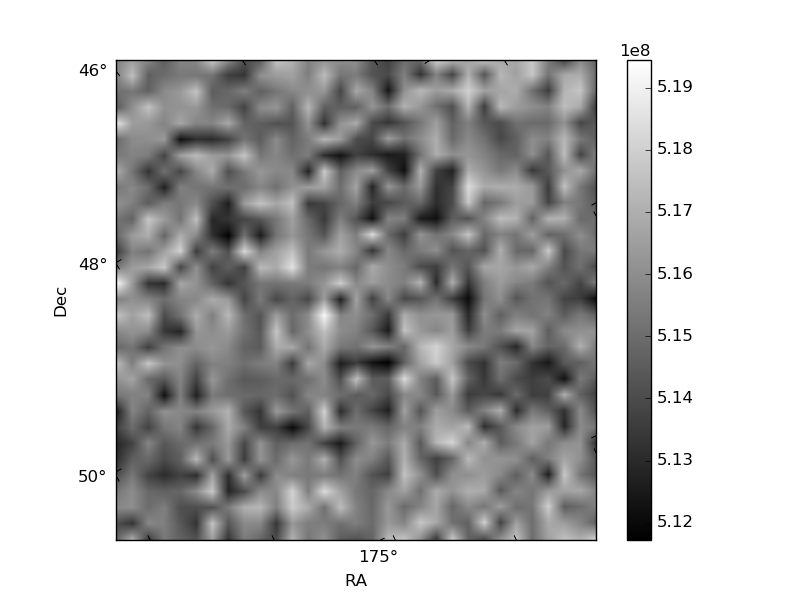
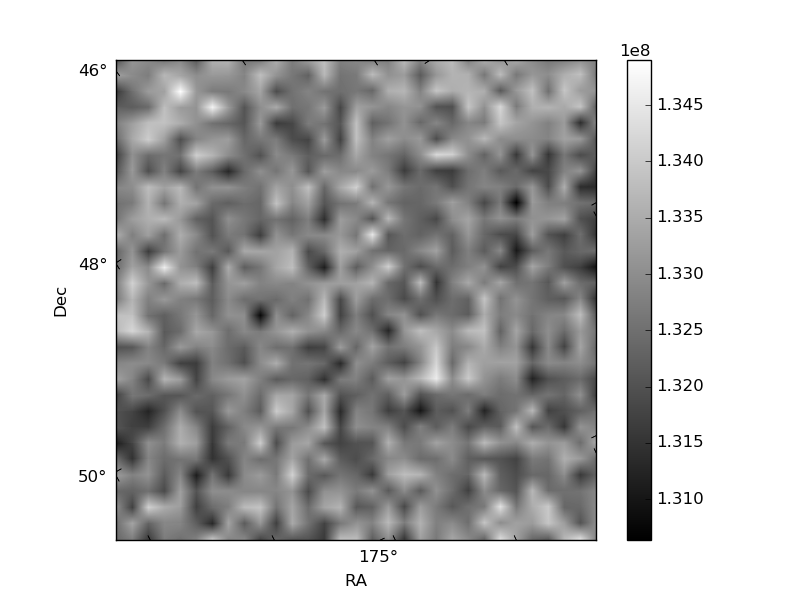
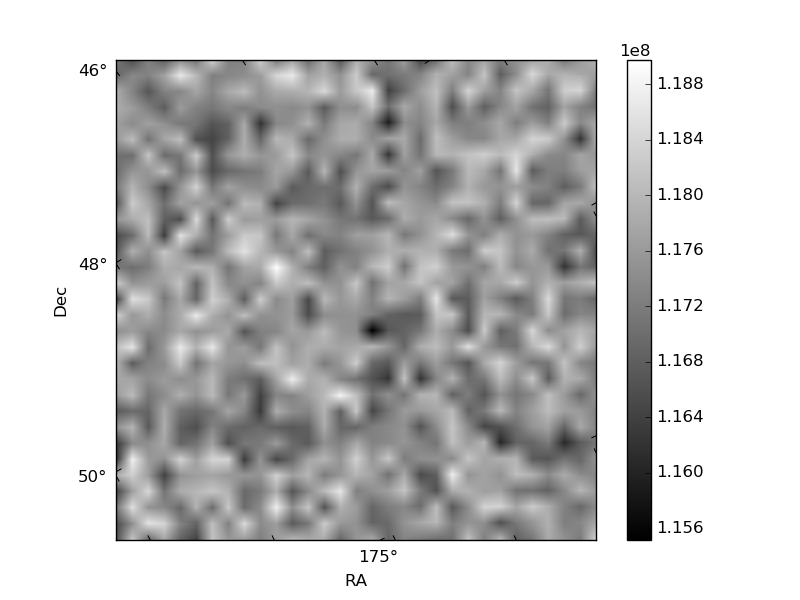
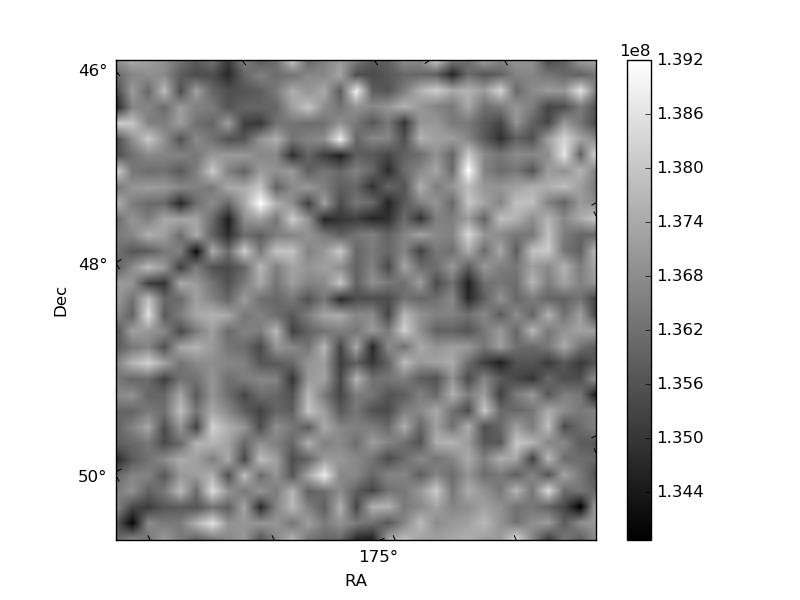
Histogram calculated using DETX and DETY for each event in the final _common_clean file
| Quadrant A | 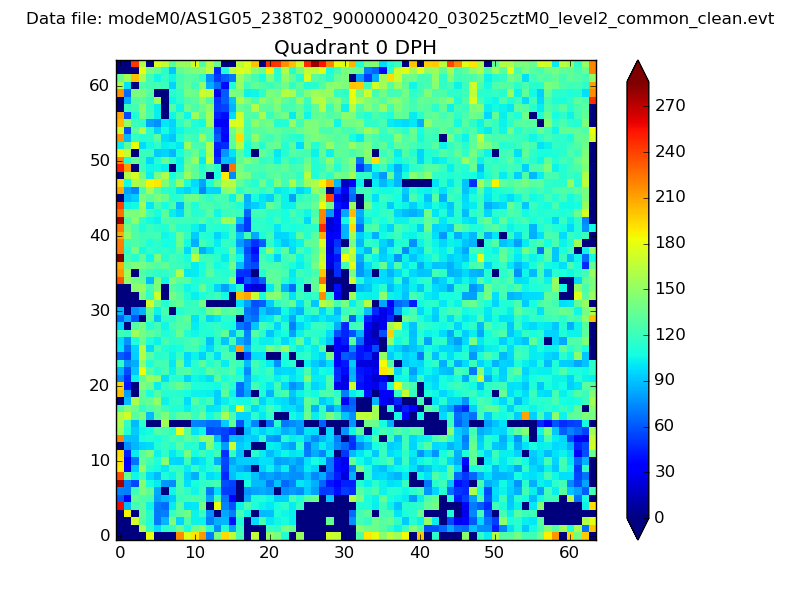 |
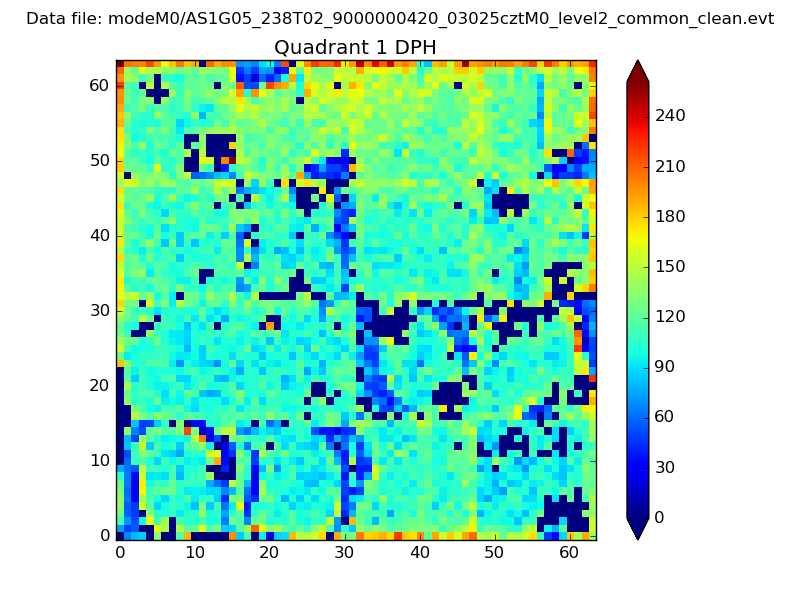 |
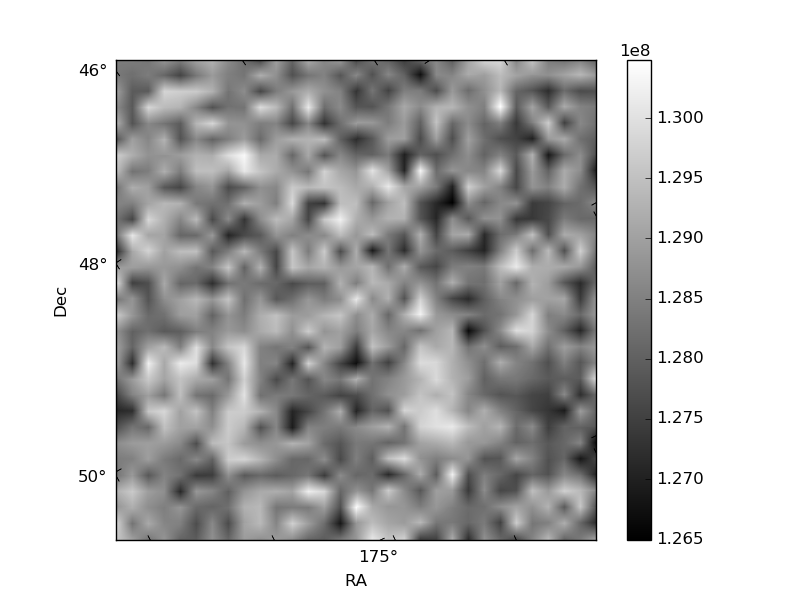
Quadrant B |
|---|---|---|---|
| Quadrant D | 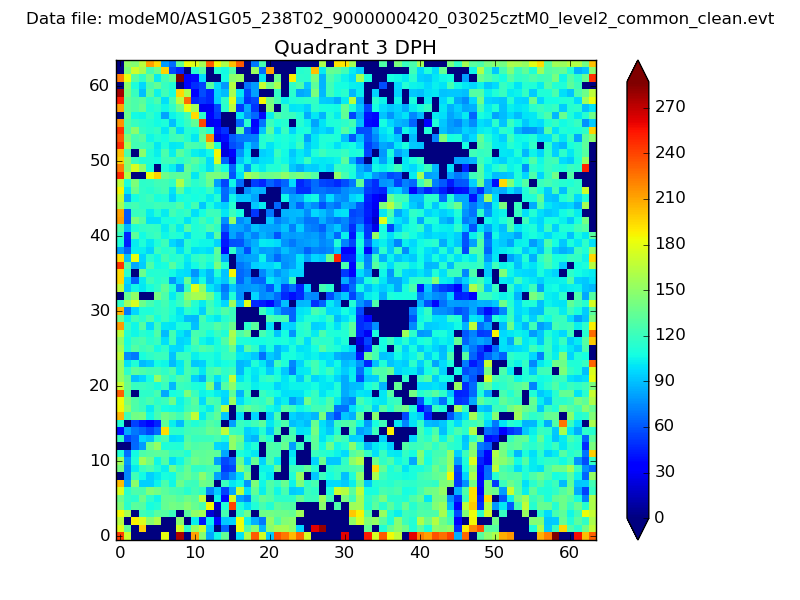 |
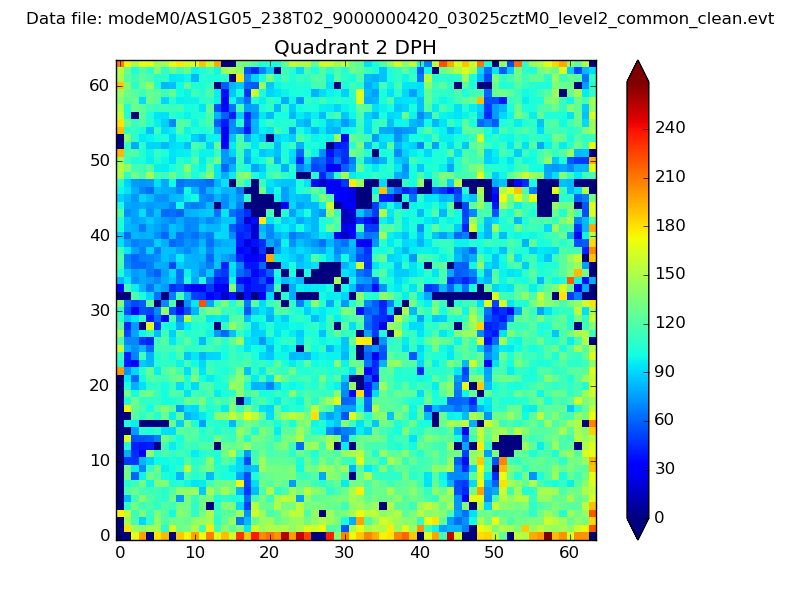 |
Quadrant C |
| Plot type | Count rate plots | Images |
|---|---|---|
| Comparison with Poisson distribution Blue bars denote a histogram of data divided into 1 sec bins. Red curve is a Poisson curve with rate = median count rate of data. |
 |
 |
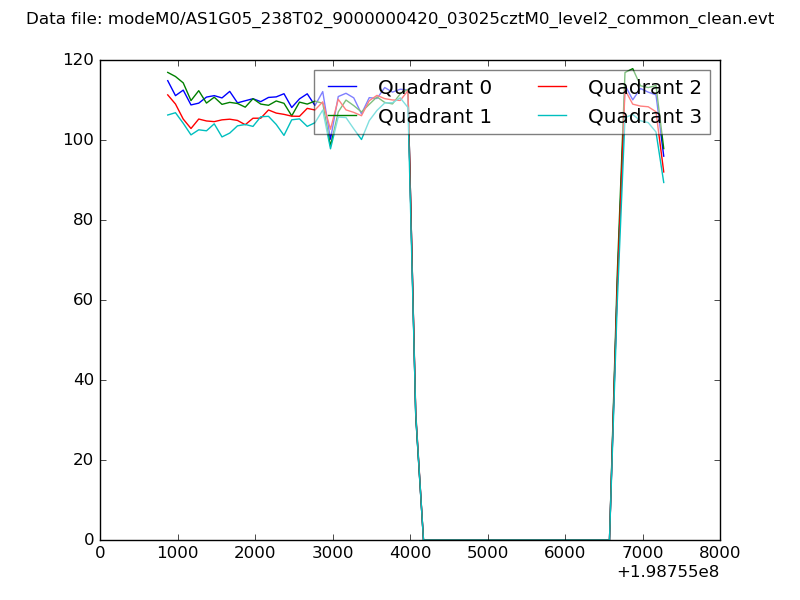
| Quadrant-wise count rates Data is divided into 100 sec bins |
 |
|
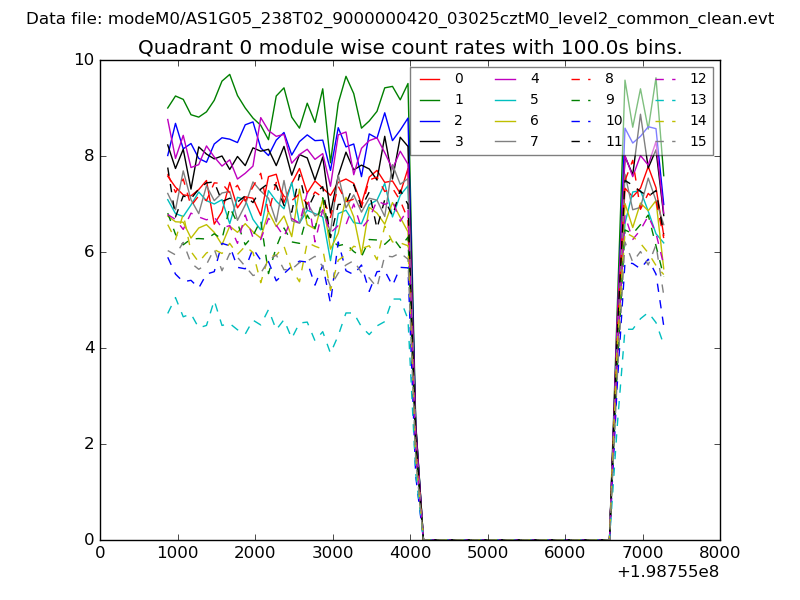
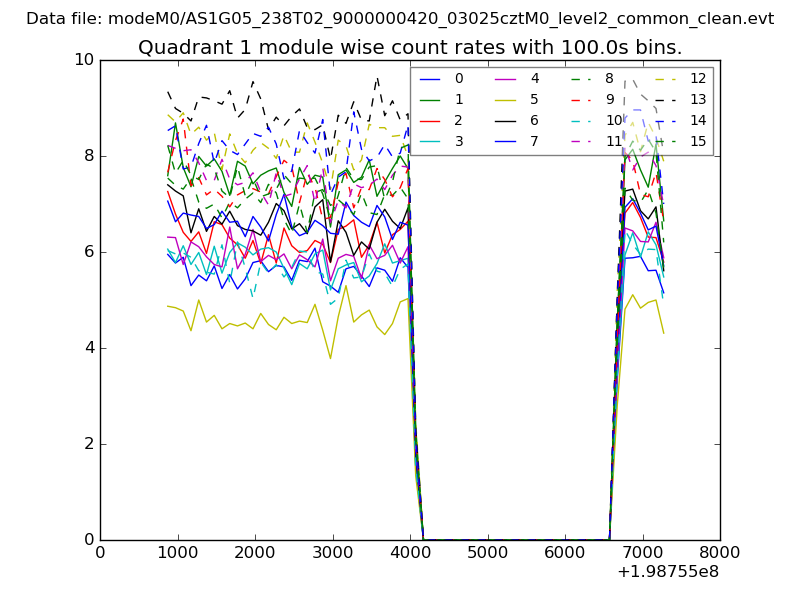
| Module-wise count rates for Quadrant A Data is divided into 100 sec bins |
 |
 |
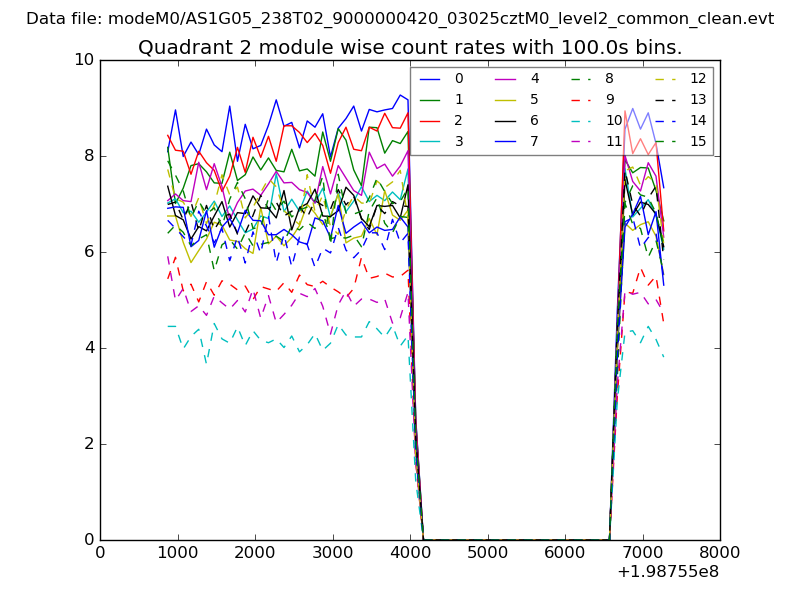
| Module-wise count rates for Quadrant B Data is divided into 100 sec bins |
 |
 |
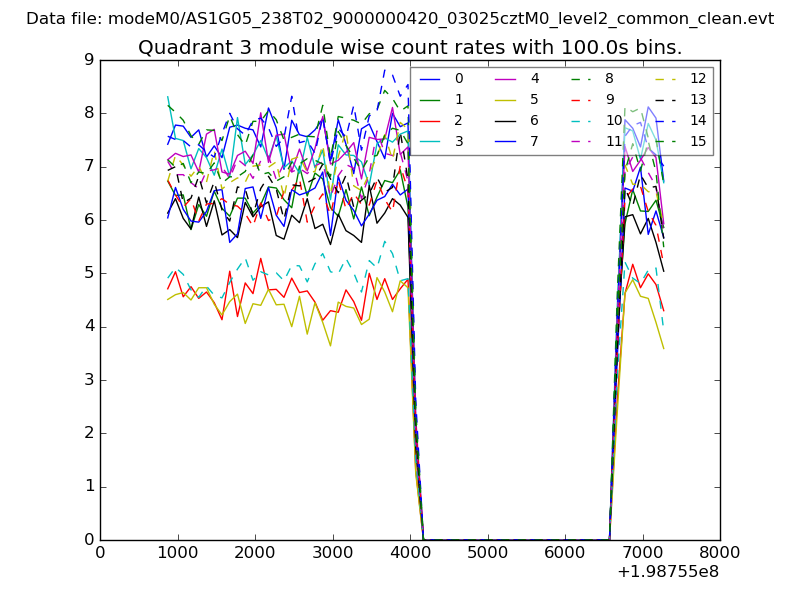
| Module-wise count rates for Quadrant C Data is divided into 100 sec bins |
 |
 |
| Module-wise count rates for Quadrant D Data is divided into 100 sec bins |
 |
 |
| Parameter | Plot |
|---|---|
| CZT HV Monitor | 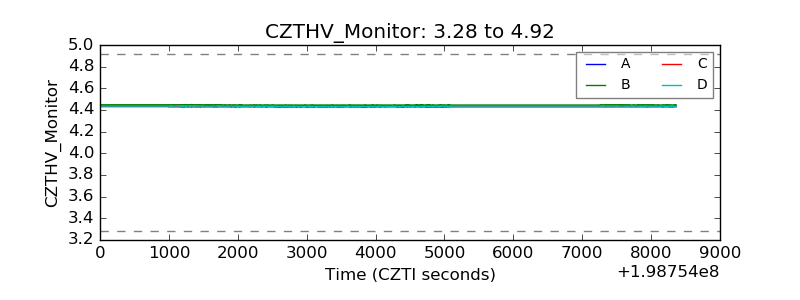 |
| D_VDD | 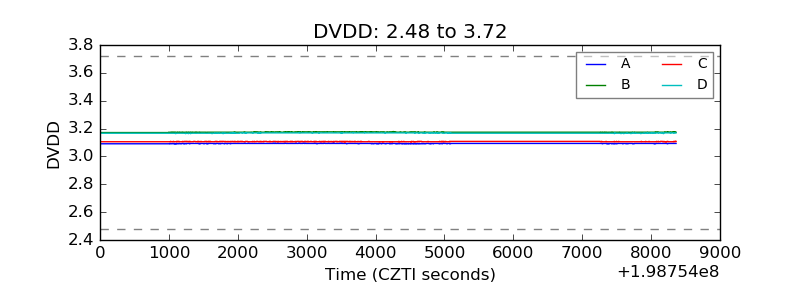 |
| Temperature 1 | 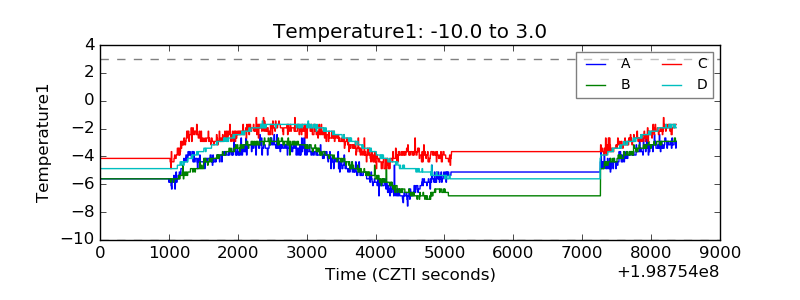 |
| Veto HV Monitor | 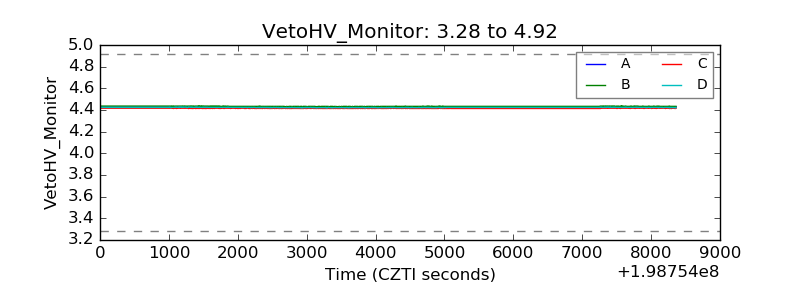 |
| Veto LLD | 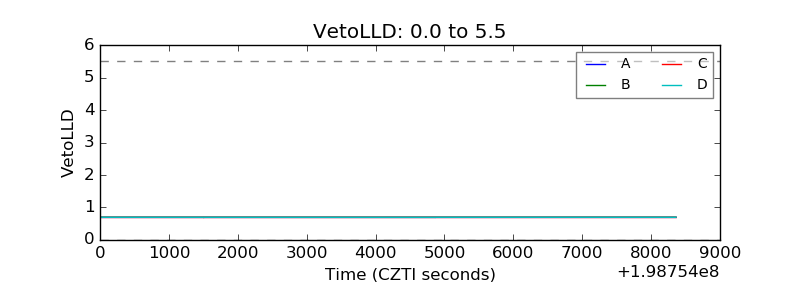 |
| Alpha Counter | 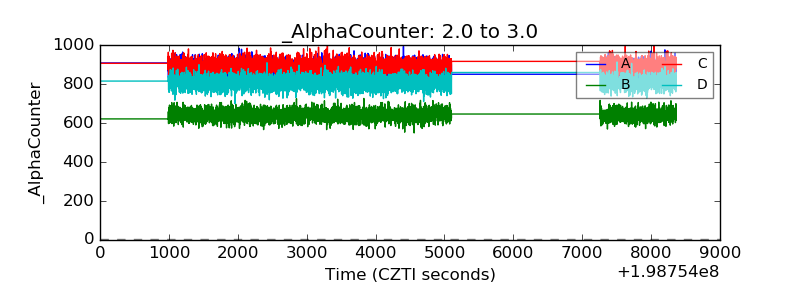 |
| _CPM_Rate | 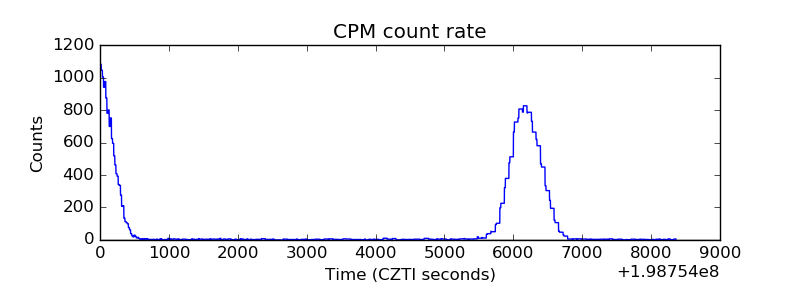 |
| CZT Counter | 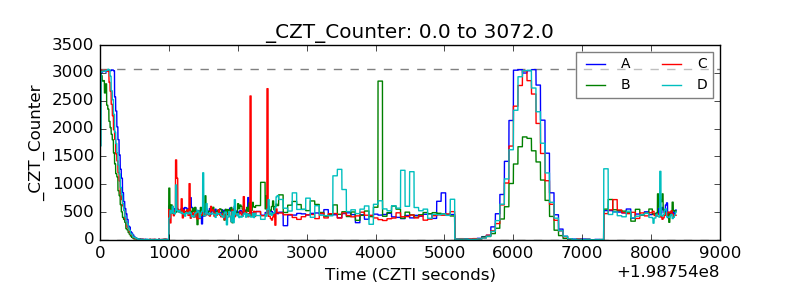 |
| +2.5 Volts monitor |  |
| +5 Volts monitor |  |
| Veto Counter | 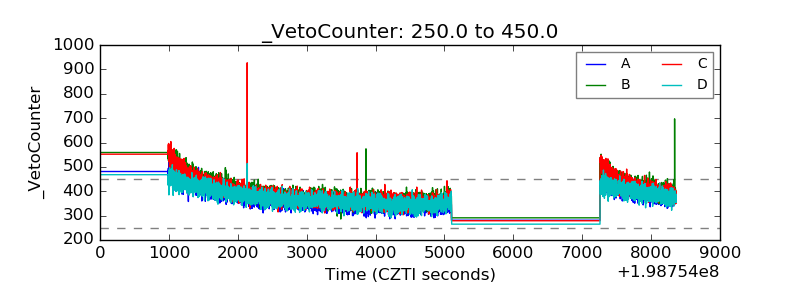 |