| Param | Original file | Final file |
|---|---|---|
| Filename | modeM0/AS1G05_238T02_9000000420_03026cztM0_level2.evt | modeM0/AS1G05_238T02_9000000420_03026cztM0_level2_quad_clean.evt |
| Size (bytes) | 335,710,080 | 74,257,920 |
| Size | 320.2 MB | 70.8 MB |
| Events in quadrant A | 2,345,194 | 482,692 |
| Events in quadrant B | 2,438,141 | 485,246 |
| Events in quadrant C | 2,364,471 | 473,375 |
| Events in quadrant D | 2,682,350 | 460,689 |
| Mode M0 | |||
|---|---|---|---|
| Quadrant | BADHDUFLAG | Total packets | Discarded packets |
| A | 0 | 10044 | 3 |
| B | 0 | 10417 | 2 |
| C | 0 | 10404 | 2 |
| D | 0 | 11355 | 2 |
| Mode SS | |||
|---|---|---|---|
| Quadrant | BADHDUFLAG | Total packets | Discarded packets |
| A | 0 | 100 | 0 |
| B | 0 | 100 | 0 |
| C | 0 | 100 | 0 |
| D | 0 | 100 | 0 |
| Mode M9 | |||
|---|---|---|---|
| Quadrant | BADHDUFLAG | Total packets | Discarded packets |
| A | 0 | 22 | 0 |
| B | 0 | 22 | 0 |
| C | 0 | 22 | 0 |
| D | 0 | 23 | 0 |
| Quadrant | Total seconds | Saturated seconds | Saturation percentage |
|---|---|---|---|
| A | 4944 | 9 | 0.182039% |
| B | 4944 | 9 | 0.182039% |
| C | 4944 | 12 | 0.242718% |
| D | 4944 | 58 | 1.173139% |
Noise dominated data is calculated using 1-second bins in cleaned event files. If a bin has >2000 counts, and if more than 50% of those come from <1% of pixels, then it is considered to be noise-dominated and hence unusable.
| Quadrant | # 1 sec bins | Bins with >0 counts | Bins with >2000 counts | High rate bins dominated by noise | Noise dominated (total time) | Noise dominated (detector-on time) | Marked lightcurve |
|---|---|---|---|---|---|---|---|
| A | 7099 | 4945 | 2 | 2 | 0.03% | 0.04% | 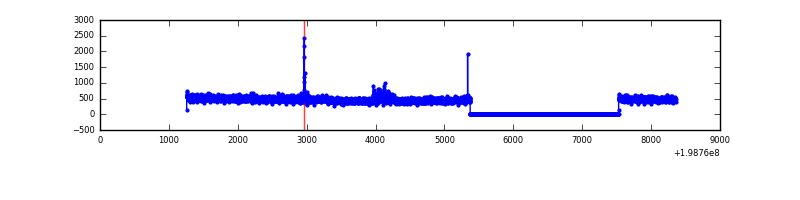 |
| B | 7099 | 4945 | 8 | 8 | 0.11% | 0.16% | 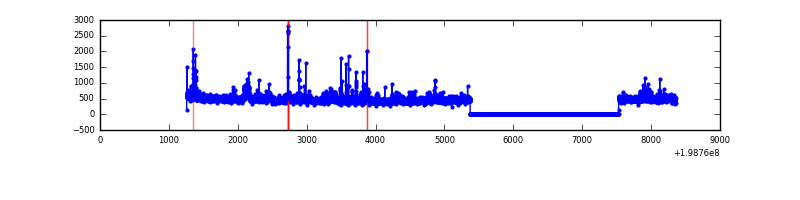 |
| C | 7099 | 4945 | 11 | 11 | 0.15% | 0.22% | 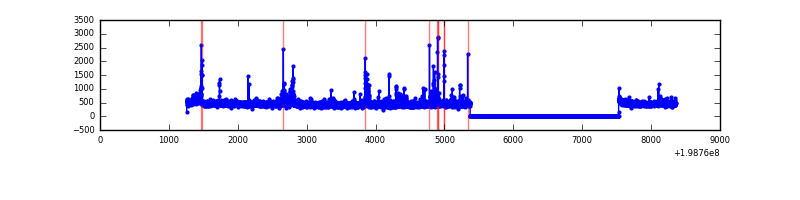 |
| D | 7099 | 4945 | 70 | 70 | 0.99% | 1.42% | 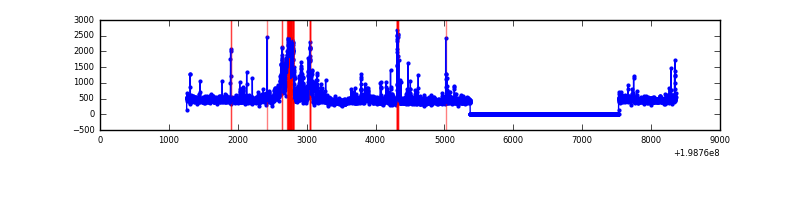 |
Top three noisy pixels from each quadrant. If the there are fewer than three noisy pixels in the level2.evt file, extra rows are filled as -1
| Pixel properties | Quadrant properties | ||||||
|---|---|---|---|---|---|---|---|
| Quadrant | DetID | PixID | Counts | Sigma | Mean | Median | Sigma |
| A | 8 | 15 | 83603 | 723.77 | 567 | 555 | 114.7 |
| A | 0 | 50 | 38444 | 330.21 | 567 | 555 | 114.7 |
| A | 13 | 14 | 17713 | 149.53 | 567 | 555 | 114.7 |
| B | 14 | 167 | 79056 | 720.18 | 571 | 559 | 109.0 |
| B | 0 | 219 | 72752 | 662.35 | 571 | 559 | 109.0 |
| B | 15 | 204 | 26477 | 237.79 | 571 | 559 | 109.0 |
| C | 6 | 80 | 69213 | 535.83 | 549 | 552 | 128.1 |
| C | 1 | 192 | 33947 | 260.61 | 549 | 552 | 128.1 |
| C | 12 | 206 | 30881 | 236.69 | 549 | 552 | 128.1 |
| D | 13 | 114 | 461911 | 3584.2 | 545 | 534 | 128.7 |
| D | 2 | 152 | 74263 | 572.76 | 545 | 534 | 128.7 |
| D | 2 | 136 | 21000 | 158.99 | 545 | 534 | 128.7 |
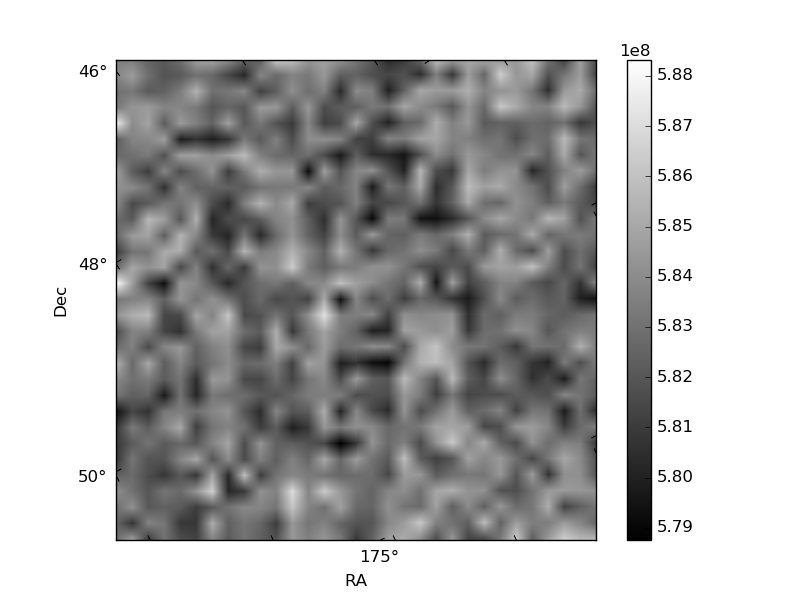
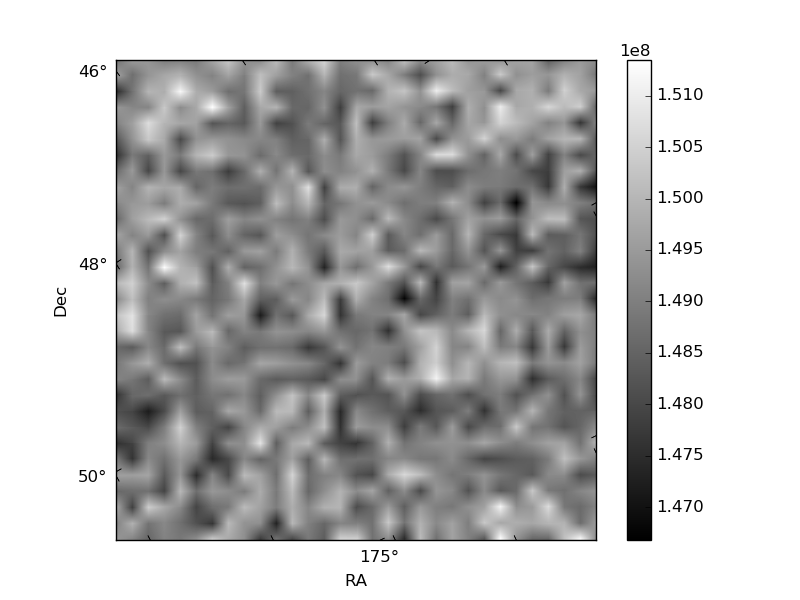
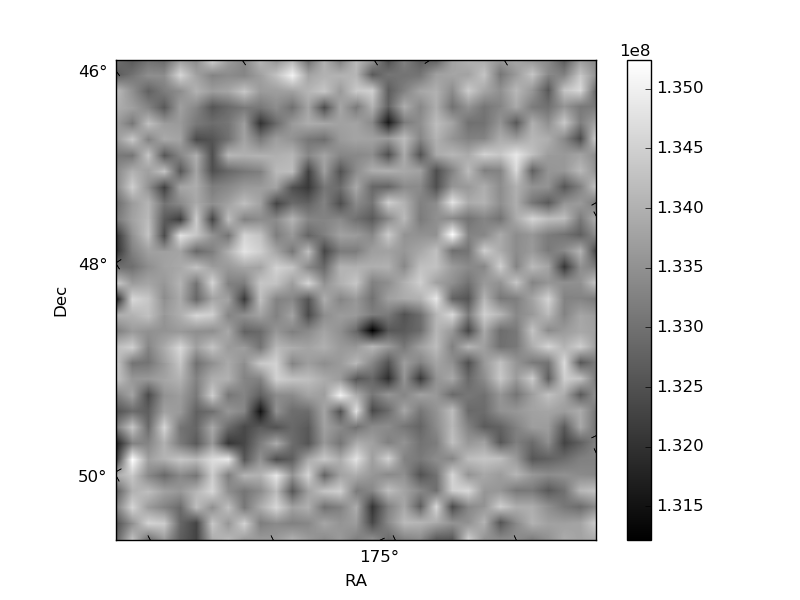
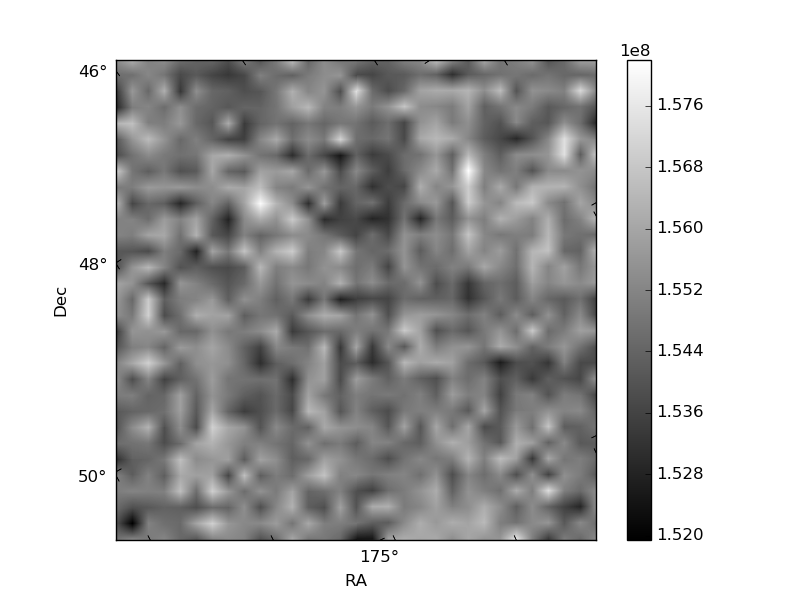
Histogram calculated using DETX and DETY for each event in the final _common_clean file
| Quadrant A | 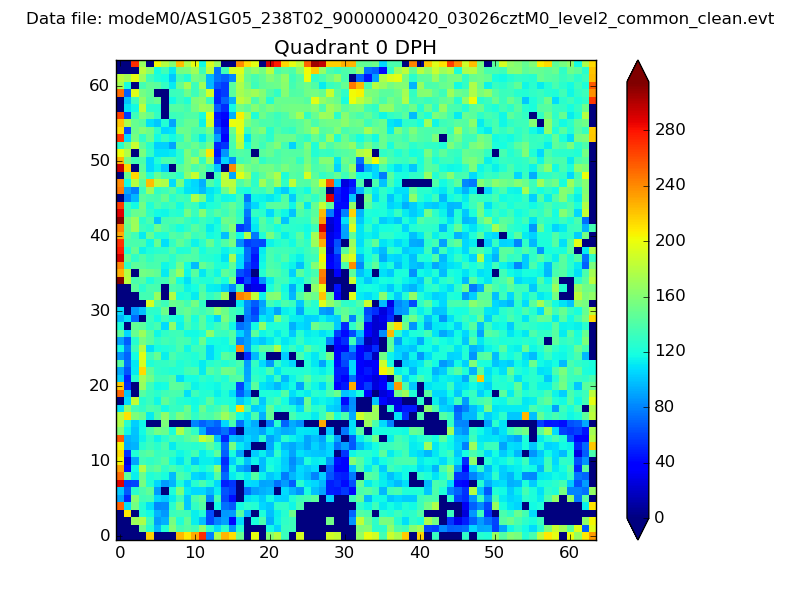 |
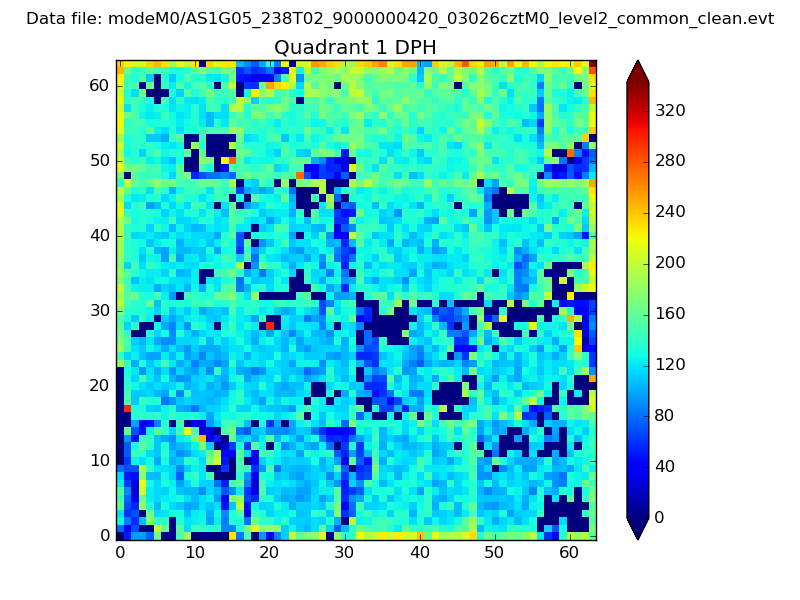 |
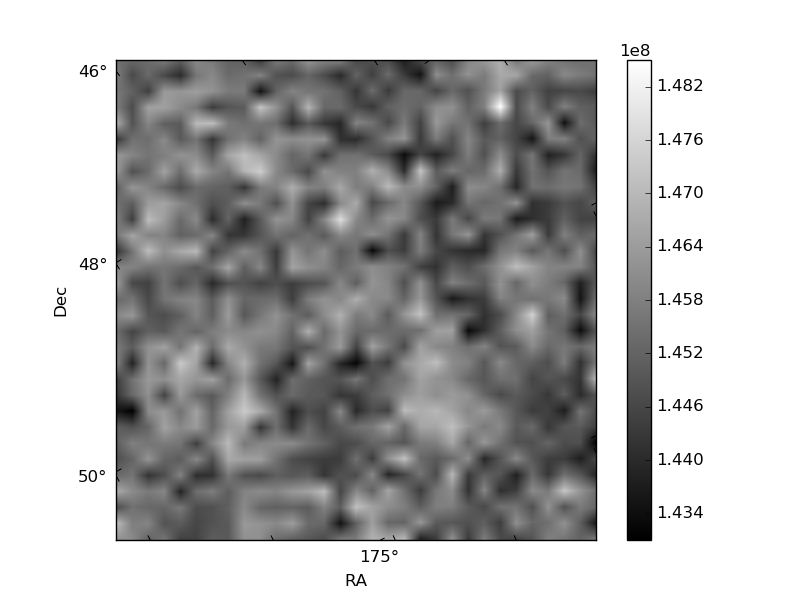
Quadrant B |
|---|---|---|---|
| Quadrant D | 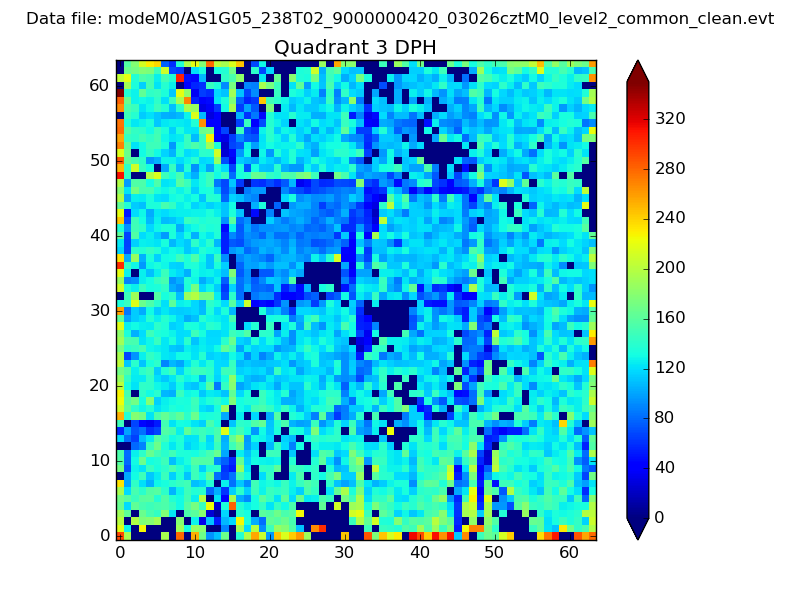 |
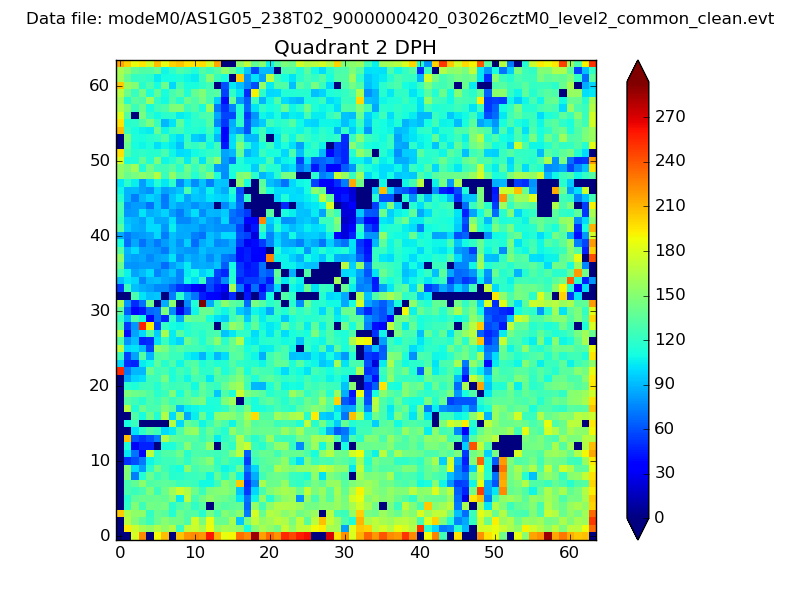 |
Quadrant C |
| Plot type | Count rate plots | Images |
|---|---|---|
| Comparison with Poisson distribution Blue bars denote a histogram of data divided into 1 sec bins. Red curve is a Poisson curve with rate = median count rate of data. |
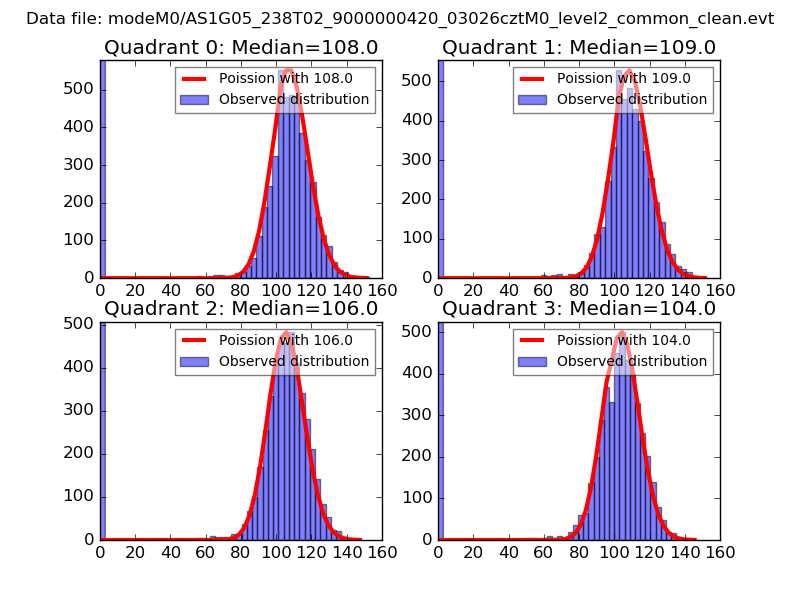 |
 |
| Quadrant-wise count rates Data is divided into 100 sec bins |
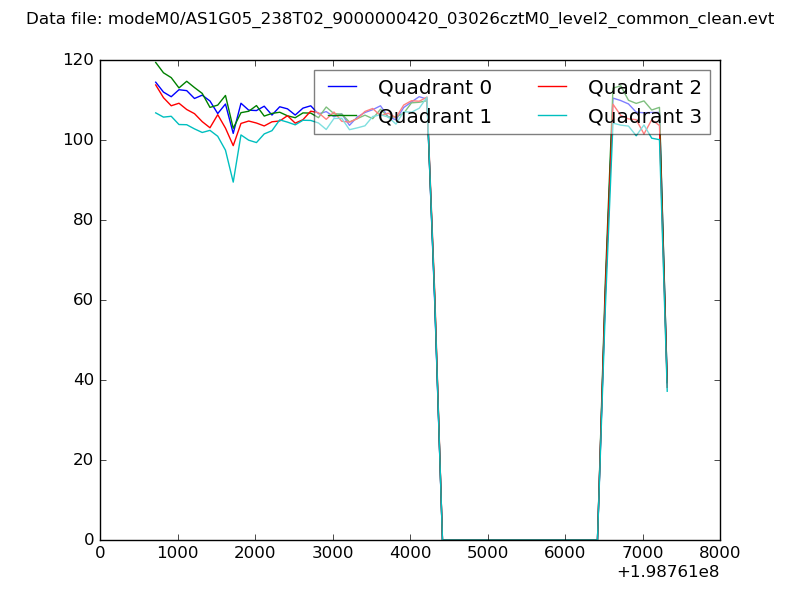 |
|
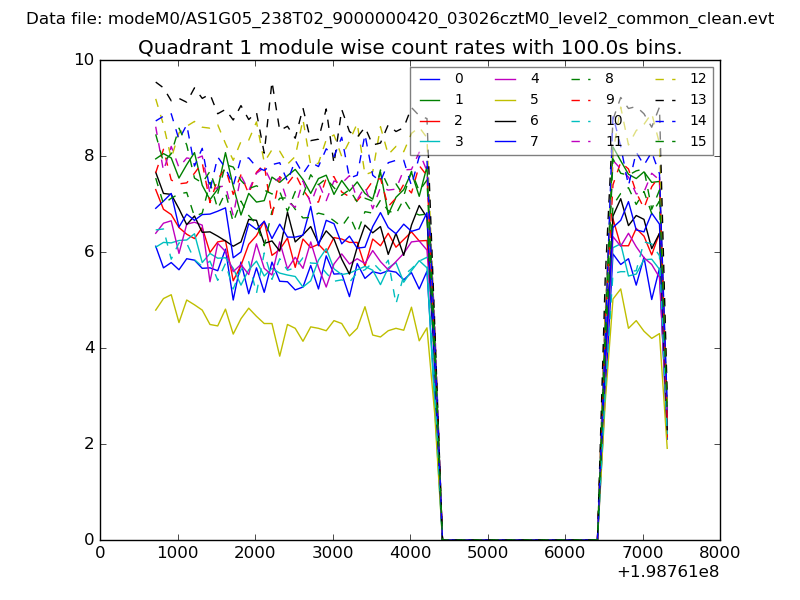
| Module-wise count rates for Quadrant A Data is divided into 100 sec bins |
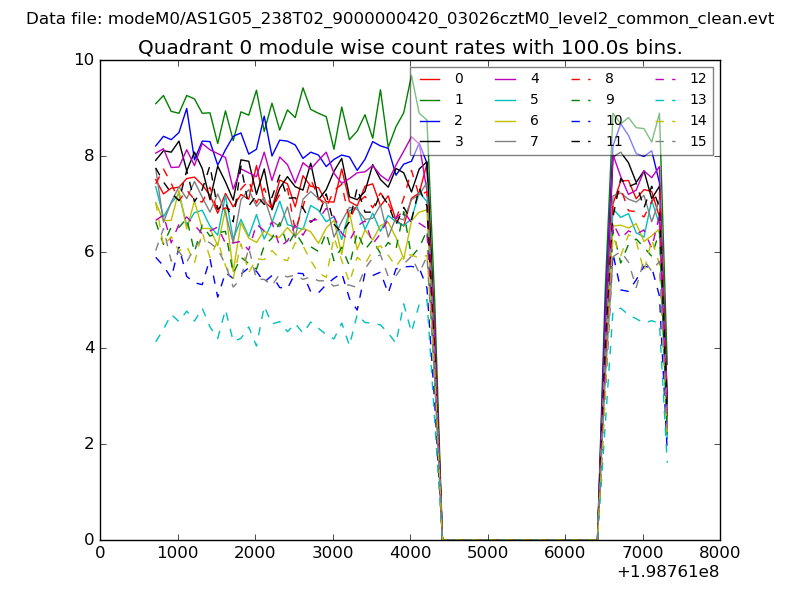 |
 |
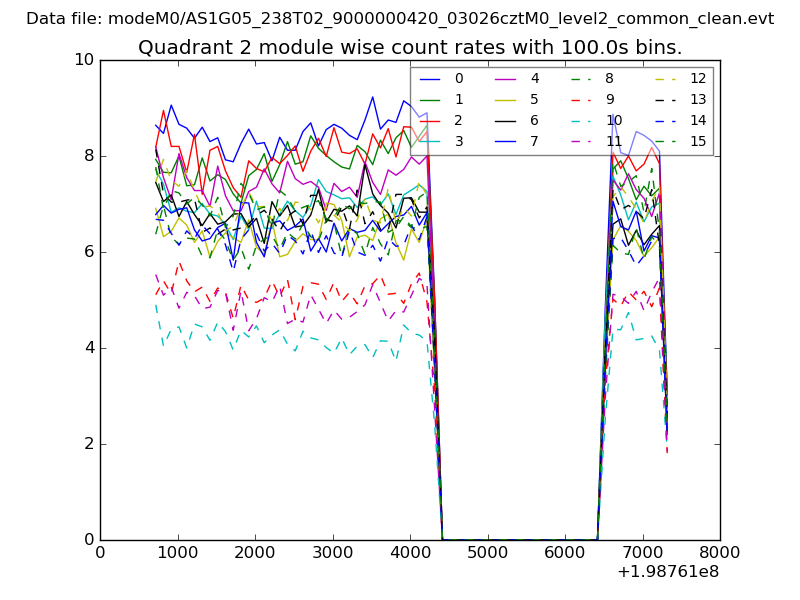
| Module-wise count rates for Quadrant B Data is divided into 100 sec bins |
 |
 |
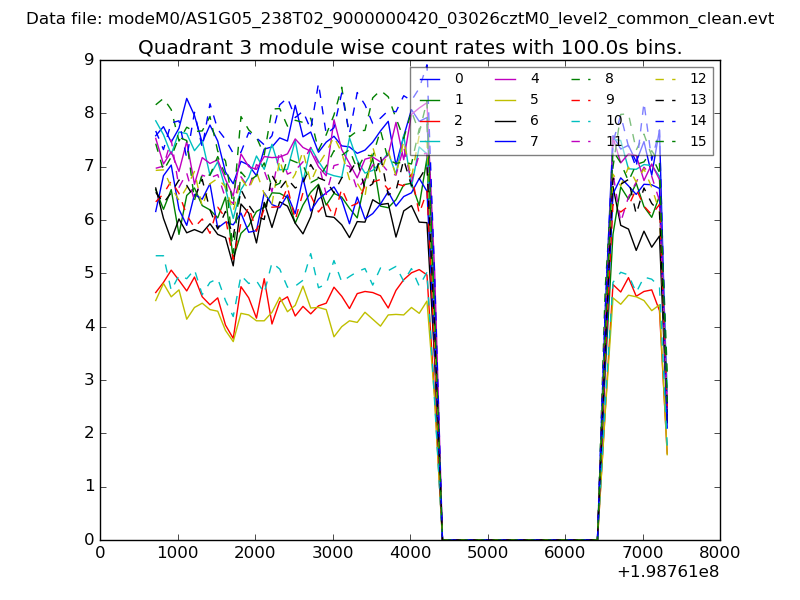
| Module-wise count rates for Quadrant C Data is divided into 100 sec bins |
 |
 |
| Module-wise count rates for Quadrant D Data is divided into 100 sec bins |
 |
 |
| Parameter | Plot |
|---|---|
| CZT HV Monitor | 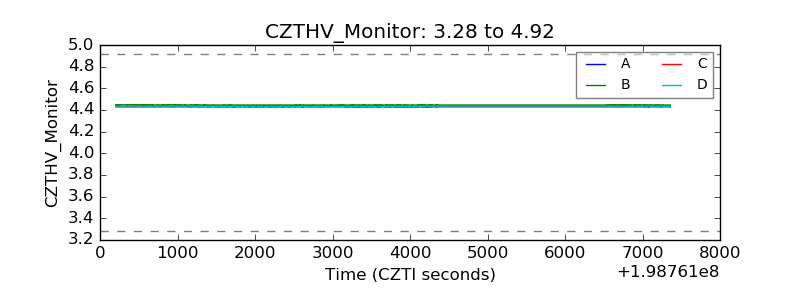 |
| D_VDD | 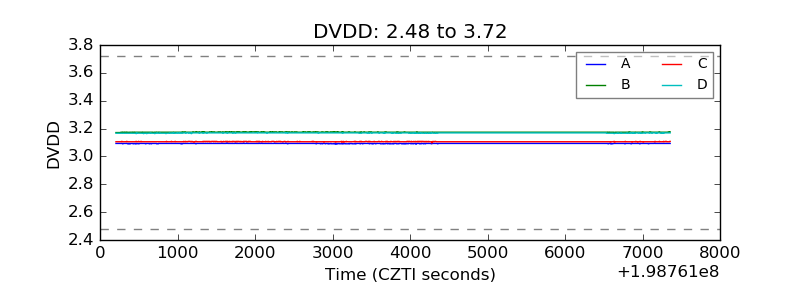 |
| Temperature 1 | 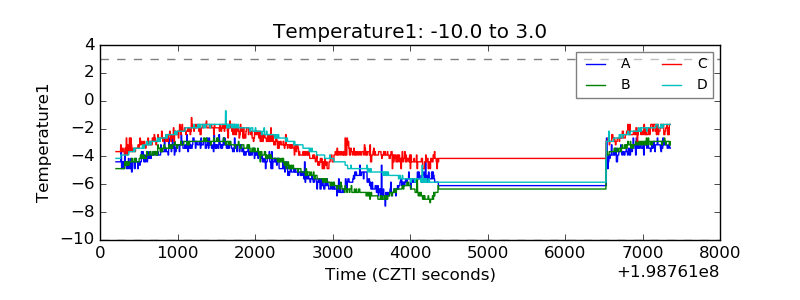 |
| Veto HV Monitor | 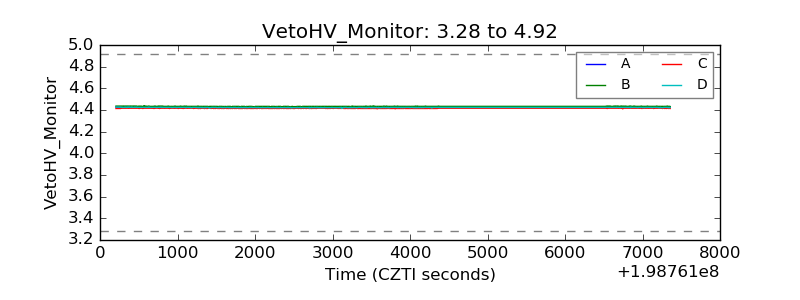 |
| Veto LLD | 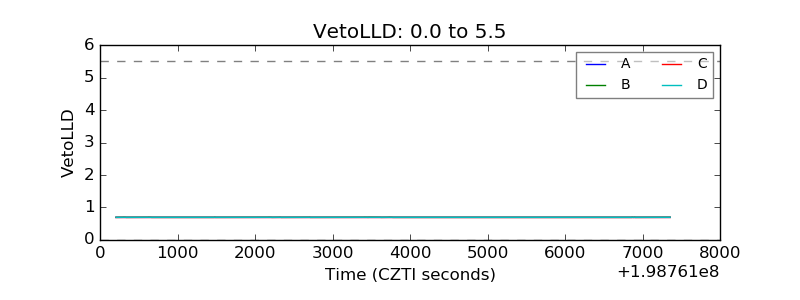 |
| Alpha Counter | 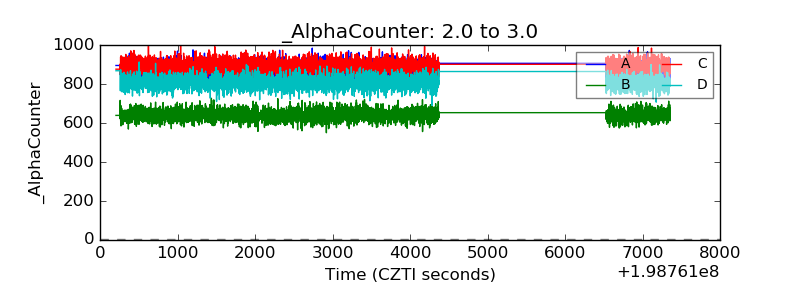 |
| _CPM_Rate | 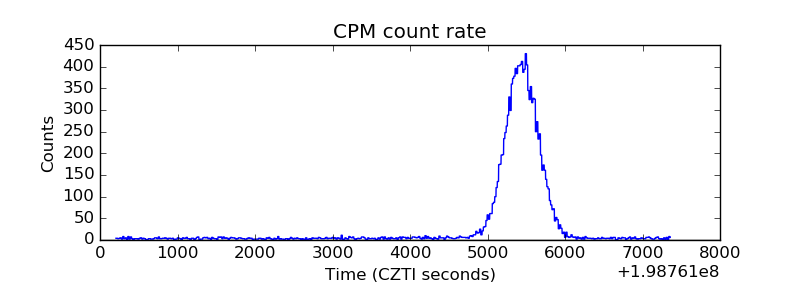 |
| CZT Counter | 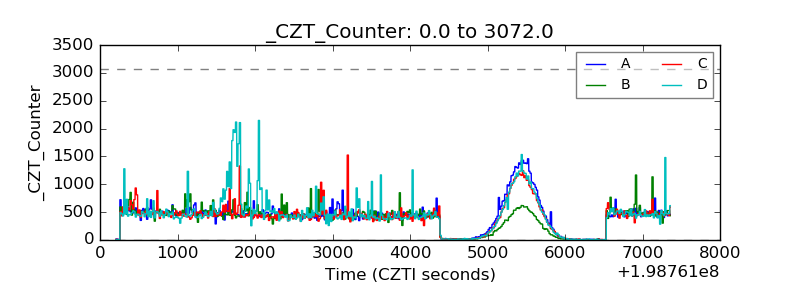 |
| +2.5 Volts monitor |  |
| +5 Volts monitor |  |
| Veto Counter | 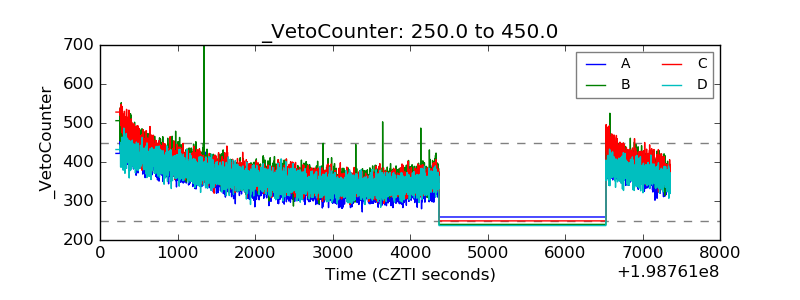 |