| Param | Original file | Final file |
|---|---|---|
| Filename | modeM0/AS1G05_238T02_9000000420_03027cztM0_level2.evt | modeM0/AS1G05_238T02_9000000420_03027cztM0_level2_quad_clean.evt |
| Size (bytes) | 88,338,240 | 21,340,800 |
| Size | 84.2 MB | 20.4 MB |
| Events in quadrant A | 628,010 | 138,410 |
| Events in quadrant B | 691,442 | 140,360 |
| Events in quadrant C | 618,348 | 135,486 |
| Events in quadrant D | 644,359 | 132,288 |
| Mode M0 | |||
|---|---|---|---|
| Quadrant | BADHDUFLAG | Total packets | Discarded packets |
| A | 0 | 2671 | 1 |
| B | 0 | 2856 | 1 |
| C | 0 | 2695 | 1 |
| D | 0 | 2783 | 1 |
| Mode SS | |||
|---|---|---|---|
| Quadrant | BADHDUFLAG | Total packets | Discarded packets |
| A | 0 | 28 | 0 |
| B | 0 | 28 | 0 |
| C | 0 | 28 | 0 |
| D | 0 | 28 | 0 |
| Mode M9 | |||
|---|---|---|---|
| Quadrant | BADHDUFLAG | Total packets | Discarded packets |
| A | 0 | 22 | 0 |
| B | 0 | 22 | 0 |
| C | 0 | 22 | 0 |
| D | 0 | 22 | 0 |
| Quadrant | Total seconds | Saturated seconds | Saturation percentage |
|---|---|---|---|
| A | 1327 | 3 | 0.226074% |
| B | 1327 | 4 | 0.301432% |
| C | 1327 | 3 | 0.226074% |
| D | 1327 | 3 | 0.226074% |
Noise dominated data is calculated using 1-second bins in cleaned event files. If a bin has >2000 counts, and if more than 50% of those come from <1% of pixels, then it is considered to be noise-dominated and hence unusable.
| Quadrant | # 1 sec bins | Bins with >0 counts | Bins with >2000 counts | High rate bins dominated by noise | Noise dominated (total time) | Noise dominated (detector-on time) | Marked lightcurve |
|---|---|---|---|---|---|---|---|
| A | 3482 | 1328 | 0 | 0 | 0.00% | 0.00% | 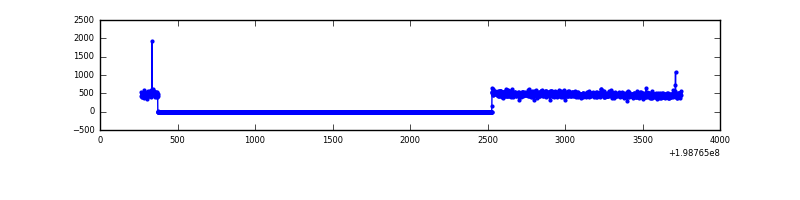 |
| B | 3482 | 1328 | 2 | 2 | 0.06% | 0.15% | 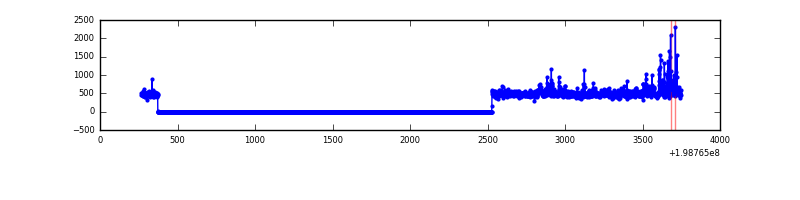 |
| C | 3482 | 1328 | 1 | 1 | 0.03% | 0.08% | 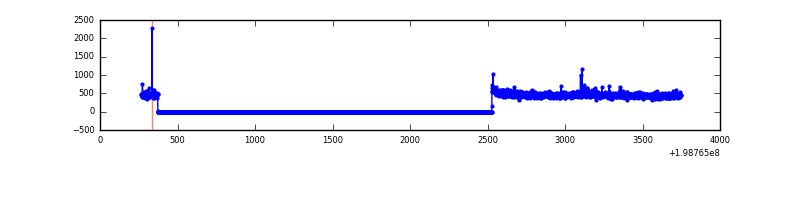 |
| D | 3482 | 1328 | 1 | 1 | 0.03% | 0.08% | 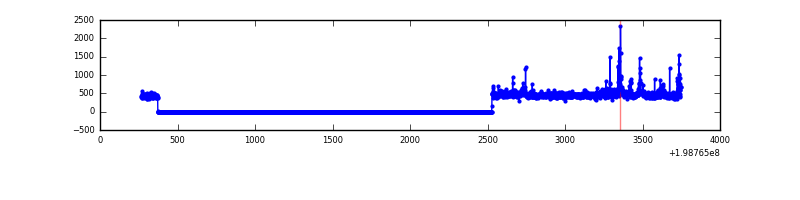 |
Top three noisy pixels from each quadrant. If the there are fewer than three noisy pixels in the level2.evt file, extra rows are filled as -1
| Pixel properties | Quadrant properties | ||||||
|---|---|---|---|---|---|---|---|
| Quadrant | DetID | PixID | Counts | Sigma | Mean | Median | Sigma |
| A | 13 | 14 | 6969 | 199.61 | 158 | 155 | 34.1 |
| A | 13 | 251 | 3775 | 106.04 | 158 | 155 | 34.1 |
| A | 0 | 50 | 3252 | 90.72 | 158 | 155 | 34.1 |
| B | 14 | 167 | 58854 | 1782.39 | 159 | 155 | 32.9 |
| B | 0 | 219 | 8468 | 252.42 | 159 | 155 | 32.9 |
| B | 2 | 249 | 8220 | 244.89 | 159 | 155 | 32.9 |
| C | 5 | 190 | 6161 | 159.73 | 153 | 153 | 37.6 |
| C | 14 | 234 | 4162 | 106.59 | 153 | 153 | 37.6 |
| C | 1 | 16 | 3614 | 92.02 | 153 | 153 | 37.6 |
| D | 2 | 152 | 20134 | 519.76 | 153 | 149 | 38.5 |
| D | 12 | 1 | 19246 | 496.67 | 153 | 149 | 38.5 |
| D | 13 | 114 | 11843 | 304.13 | 153 | 149 | 38.5 |
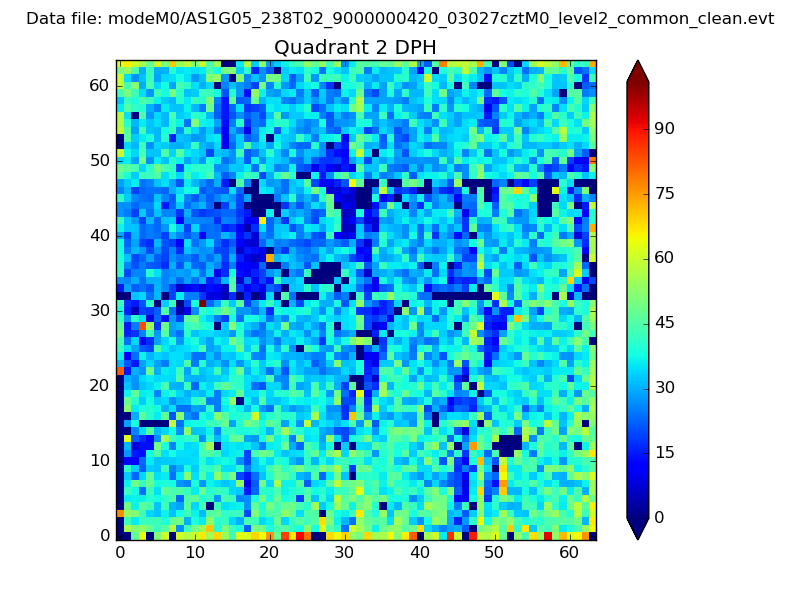
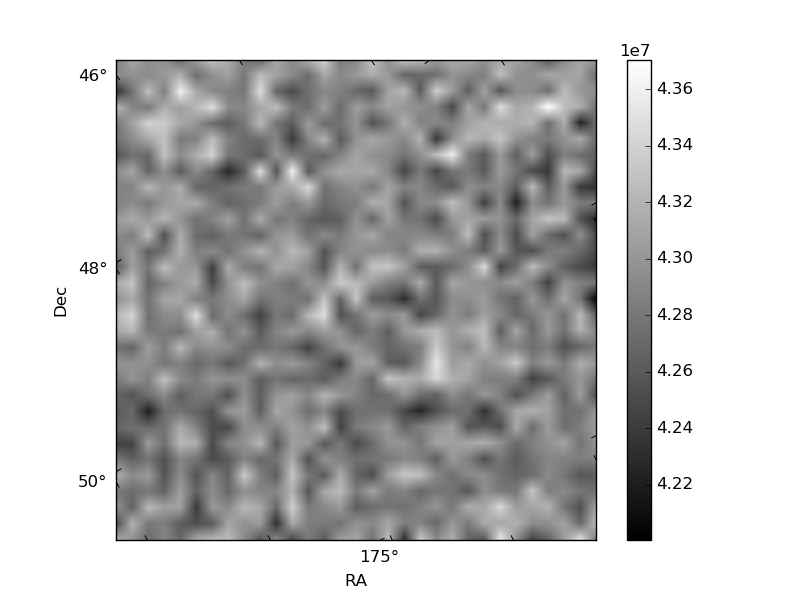
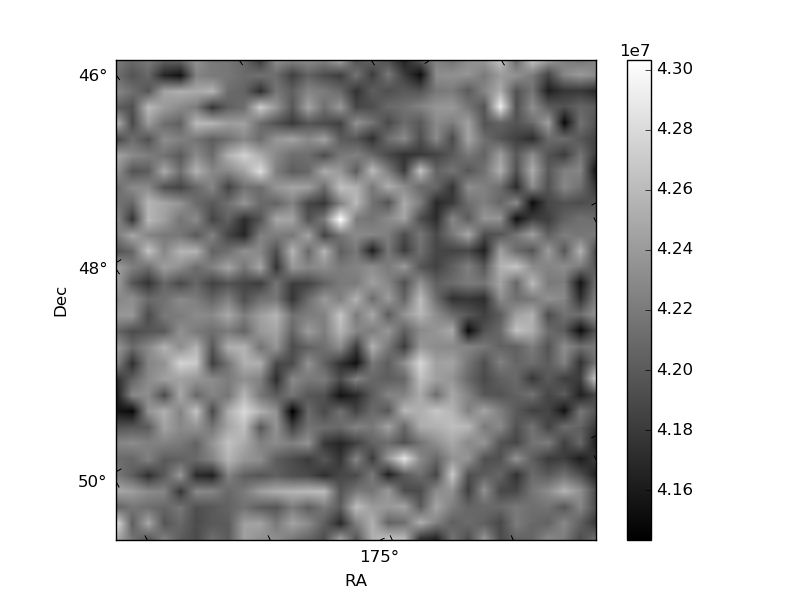
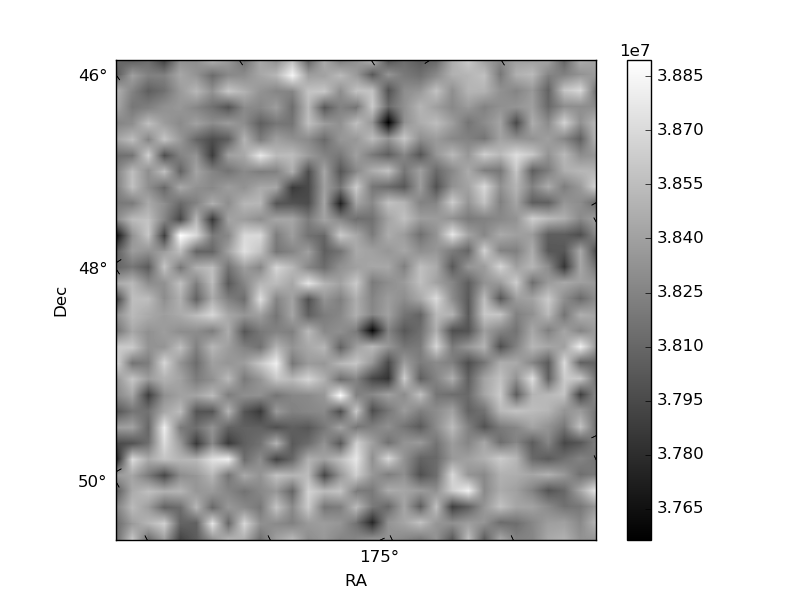
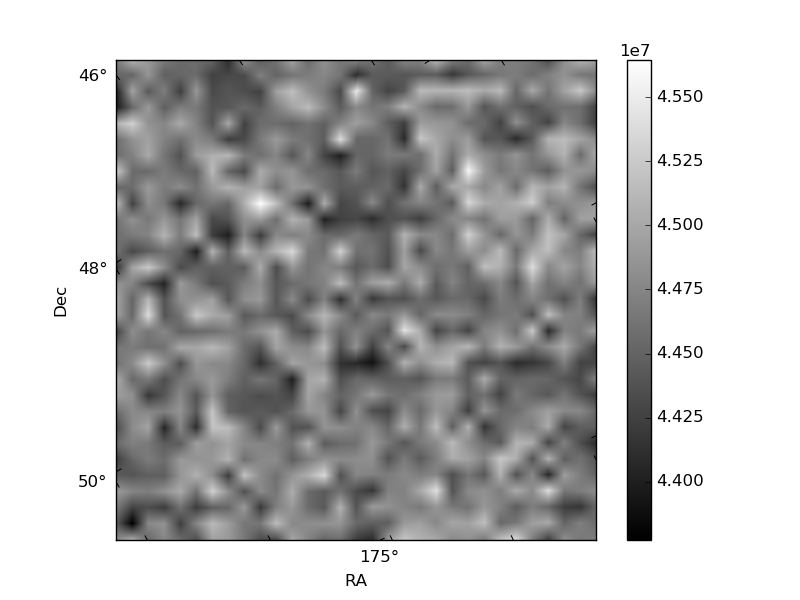
Histogram calculated using DETX and DETY for each event in the final _common_clean file
| Quadrant A | 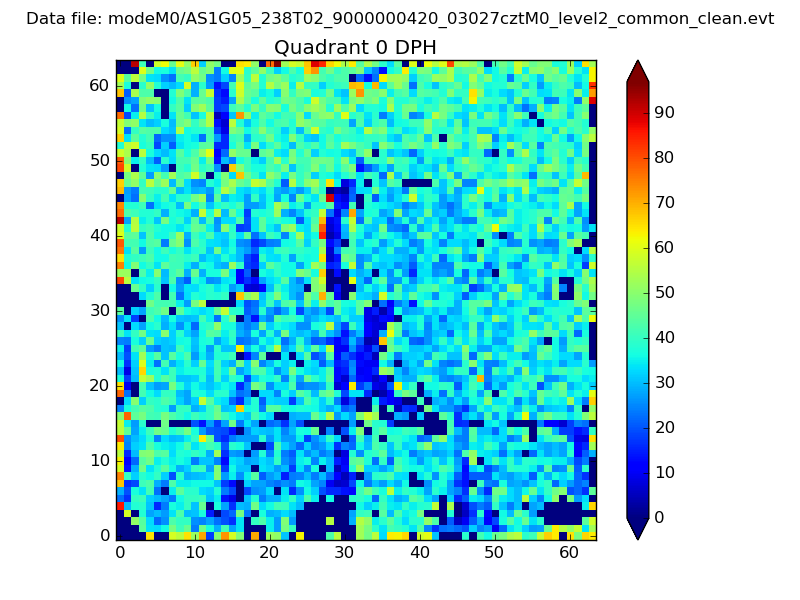 |
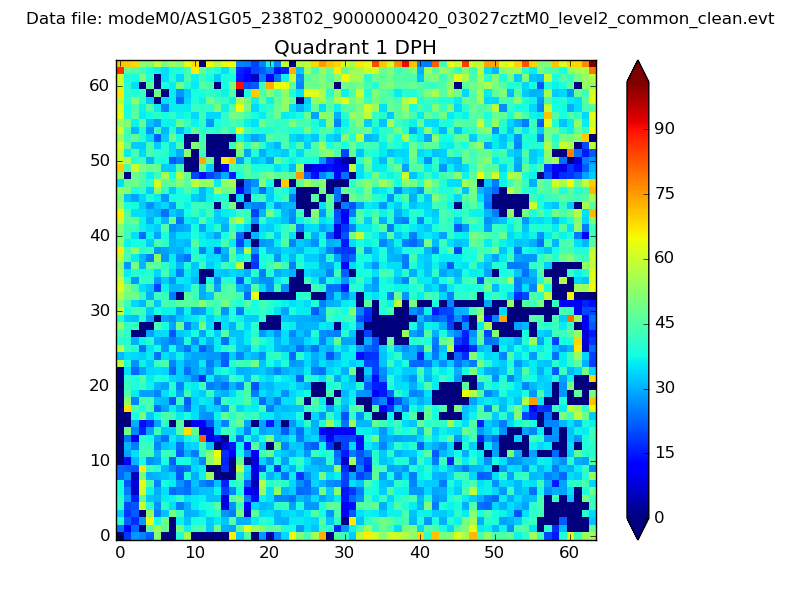 |
Quadrant B |
|---|---|---|---|
| Quadrant D | 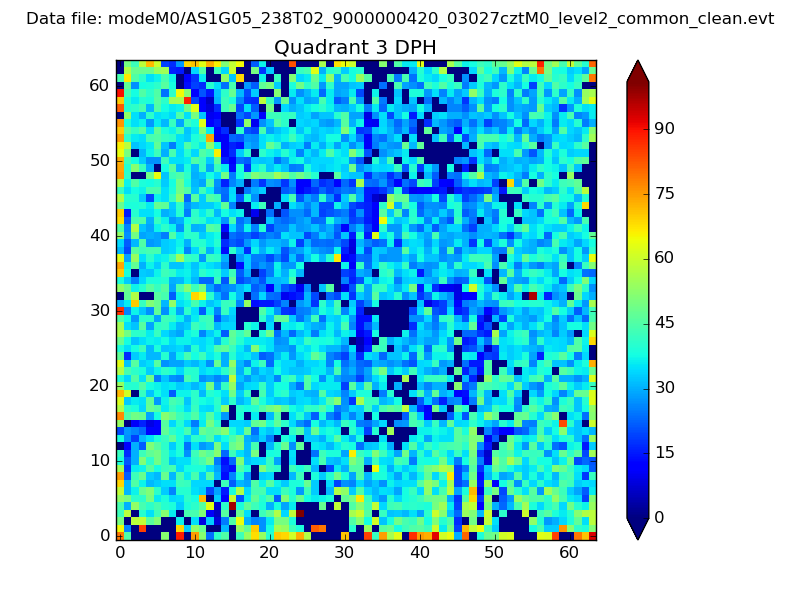 |
 |
Quadrant C |
| Plot type | Count rate plots | Images |
|---|---|---|
| Comparison with Poisson distribution Blue bars denote a histogram of data divided into 1 sec bins. Red curve is a Poisson curve with rate = median count rate of data. |
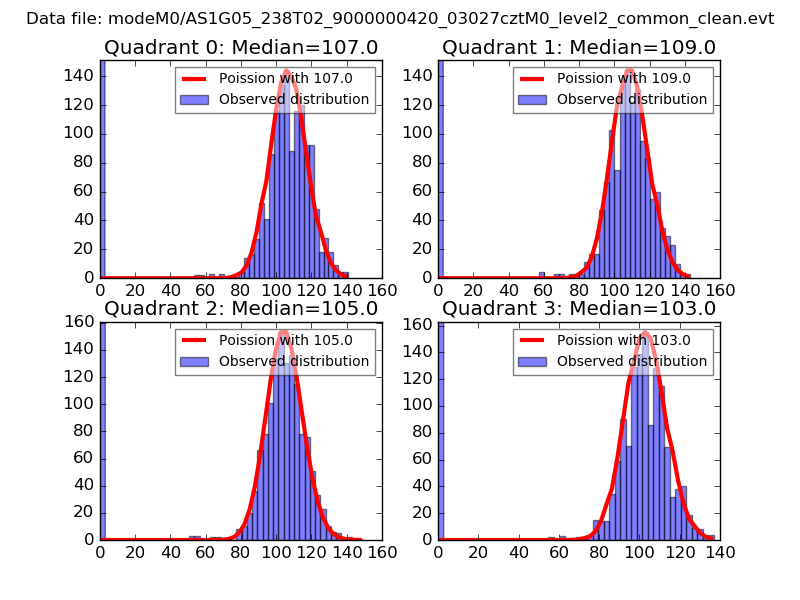 |
 |
| Quadrant-wise count rates Data is divided into 100 sec bins |
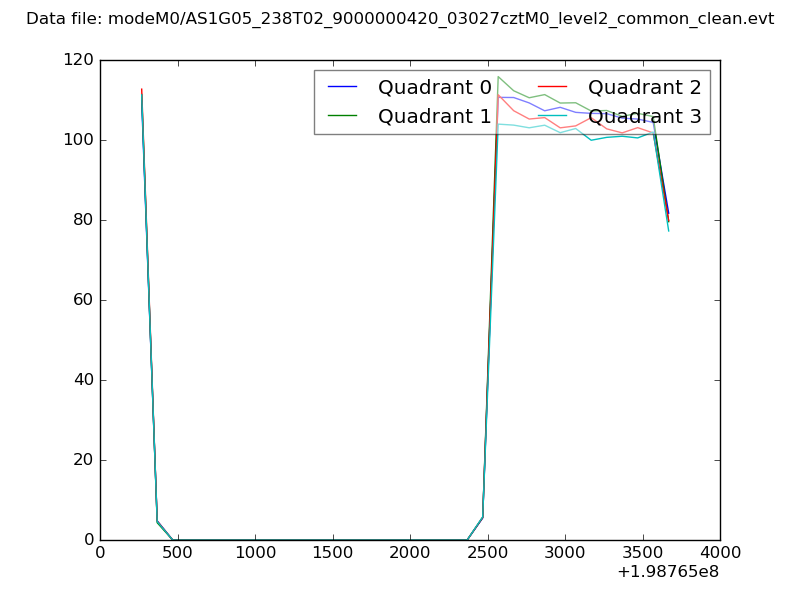 |
|
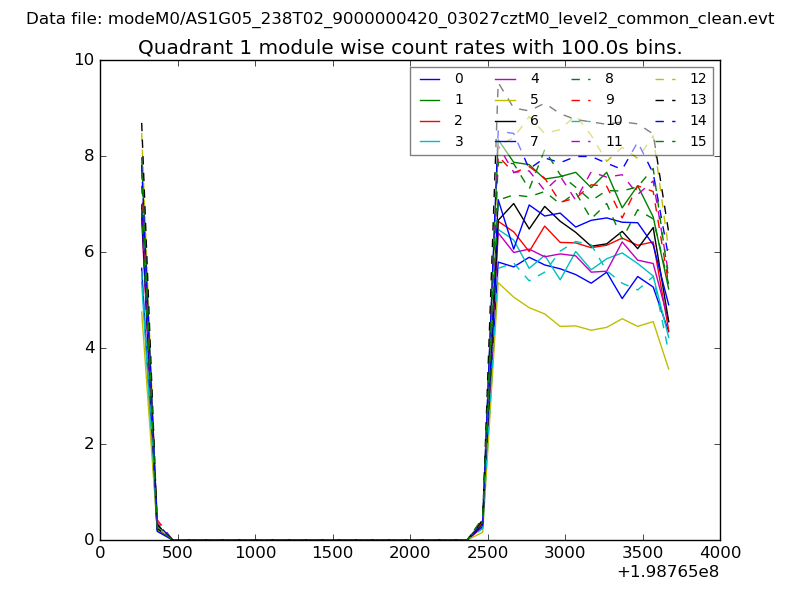
| Module-wise count rates for Quadrant A Data is divided into 100 sec bins |
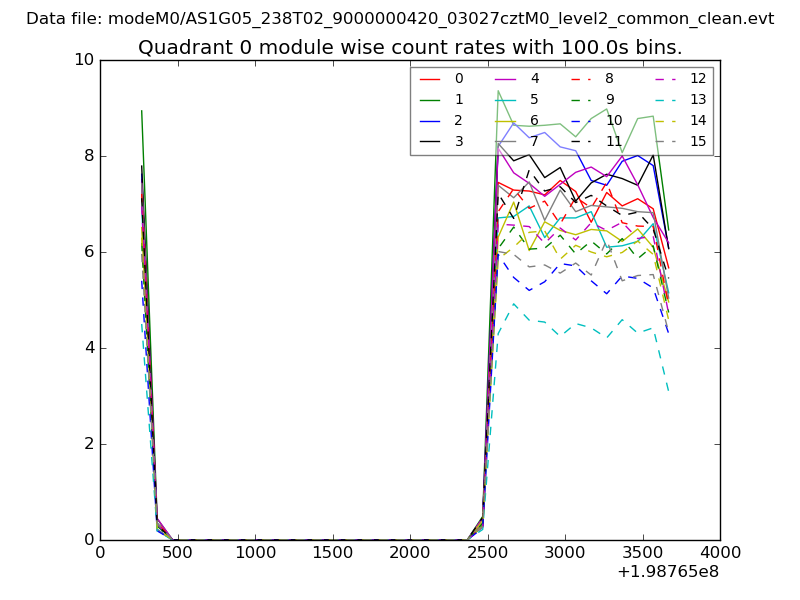 |
 |
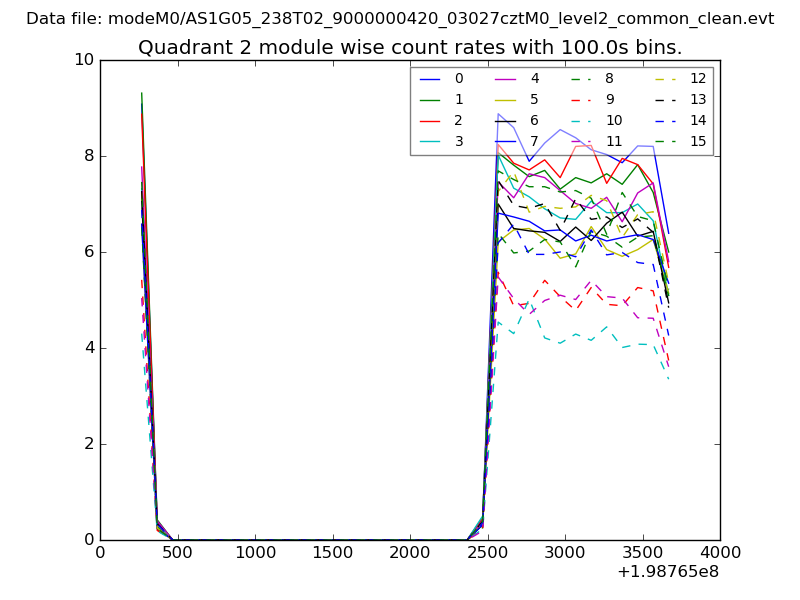
| Module-wise count rates for Quadrant B Data is divided into 100 sec bins |
 |
 |
| Module-wise count rates for Quadrant C Data is divided into 100 sec bins |
 |
 |
| Module-wise count rates for Quadrant D Data is divided into 100 sec bins |
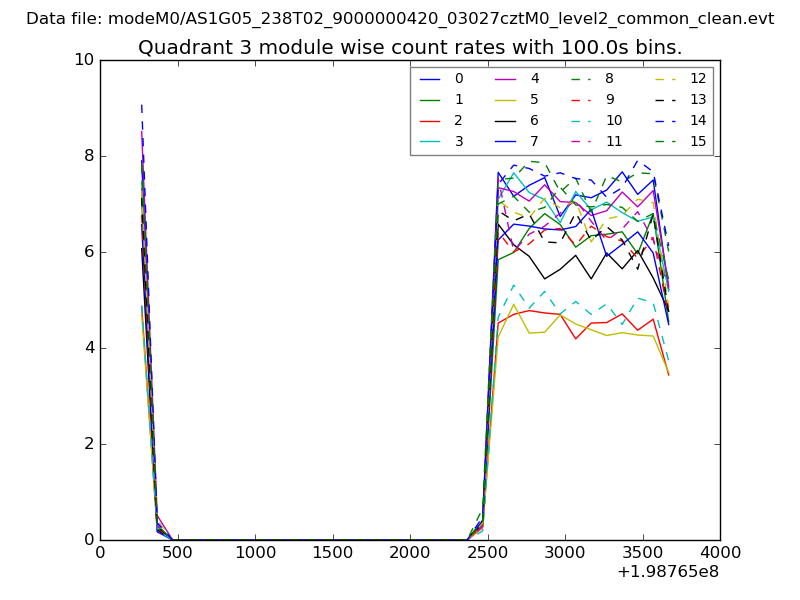 |
 |
| Parameter | Plot |
|---|---|
| CZT HV Monitor | 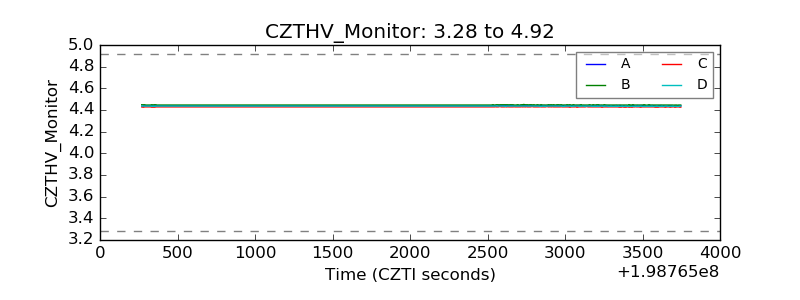 |
| D_VDD | 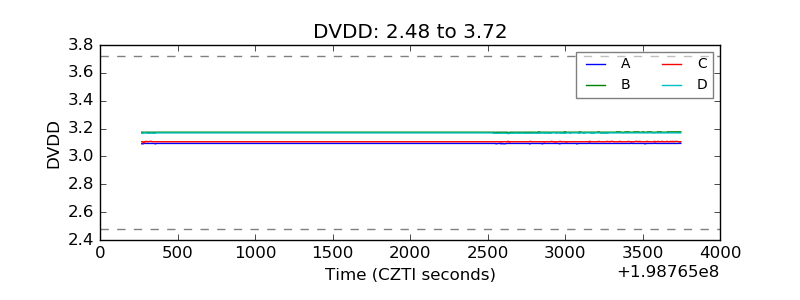 |
| Temperature 1 | 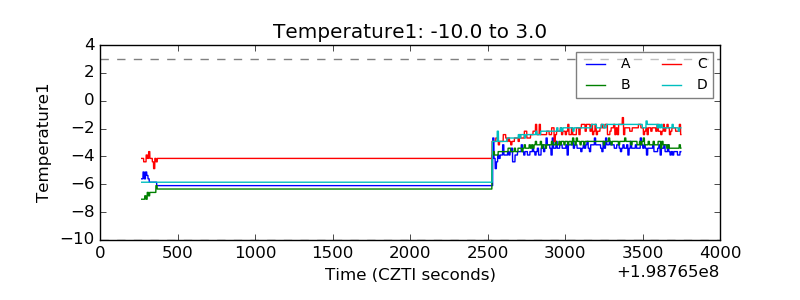 |
| Veto HV Monitor | 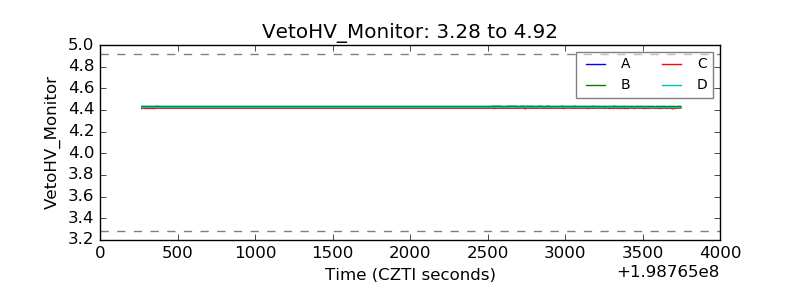 |
| Veto LLD | 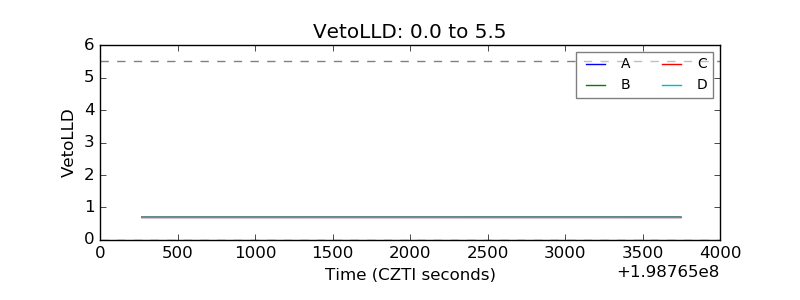 |
| Alpha Counter | 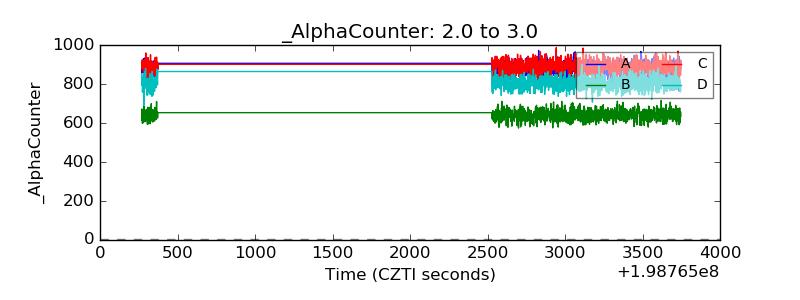 |
| _CPM_Rate | 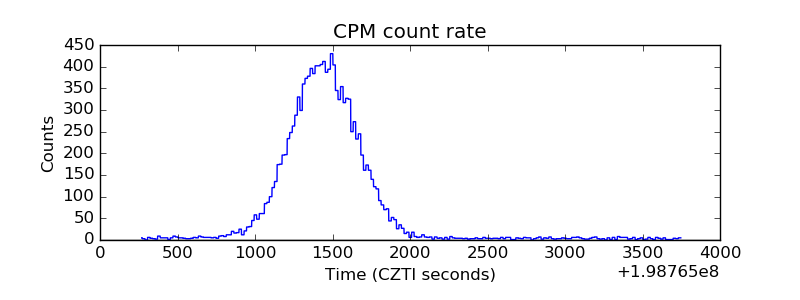 |
| CZT Counter | 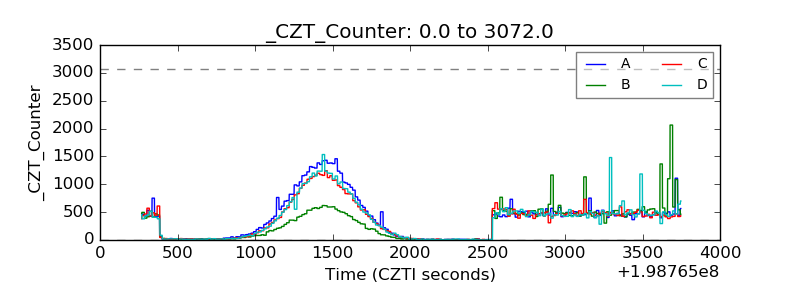 |
| +2.5 Volts monitor |  |
| +5 Volts monitor | 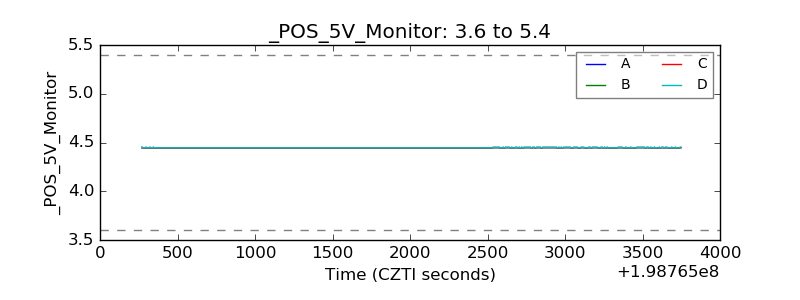 |
| Veto Counter | 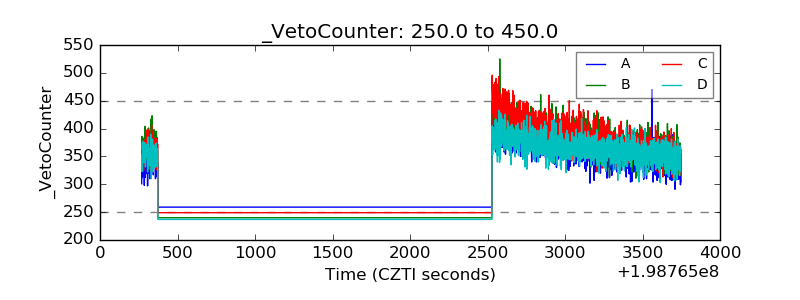 |