| Param | Original file | Final file |
|---|---|---|
| Filename | modeM0/AS1G05_237T02_9000000422_03027cztM0_level2.evt | modeM0/AS1G05_237T02_9000000422_03027cztM0_level2_quad_clean.evt |
| Size (bytes) | 220,351,680 | 48,787,200 |
| Size | 210.1 MB | 46.5 MB |
| Events in quadrant A | 1,767,114 | 307,947 |
| Events in quadrant B | 1,501,441 | 313,013 |
| Events in quadrant C | 1,467,828 | 317,203 |
| Events in quadrant D | 1,716,802 | 310,696 |
| Mode SS | |||
|---|---|---|---|
| Quadrant | BADHDUFLAG | Total packets | Discarded packets |
| A | 0 | 66 | 0 |
| B | 0 | 66 | 0 |
| C | 0 | 66 | 0 |
| D | 0 | 66 | 0 |
| Mode M9 | |||
|---|---|---|---|
| Quadrant | BADHDUFLAG | Total packets | Discarded packets |
| A | 0 | 21 | 0 |
| B | 0 | 21 | 0 |
| C | 0 | 21 | 0 |
| D | 0 | 21 | 0 |
| Mode M0 | |||
|---|---|---|---|
| Quadrant | BADHDUFLAG | Total packets | Discarded packets |
| A | 0 | 7556 | 2 |
| B | 0 | 6778 | 1 |
| C | 0 | 6744 | 1 |
| D | 0 | 7468 | 1 |
| Quadrant | Total seconds | Saturated seconds | Saturation percentage |
|---|---|---|---|
| A | 3212 | 105 | 3.268991% |
| B | 3212 | 19 | 0.591532% |
| C | 3212 | 9 | 0.280199% |
| D | 3212 | 19 | 0.591532% |
Noise dominated data is calculated using 1-second bins in cleaned event files. If a bin has >2000 counts, and if more than 50% of those come from <1% of pixels, then it is considered to be noise-dominated and hence unusable.
| Quadrant | # 1 sec bins | Bins with >0 counts | Bins with >2000 counts | High rate bins dominated by noise | Noise dominated (total time) | Noise dominated (detector-on time) | Marked lightcurve |
|---|---|---|---|---|---|---|---|
| A | 5367 | 3213 | 100 | 100 | 1.86% | 3.11% | 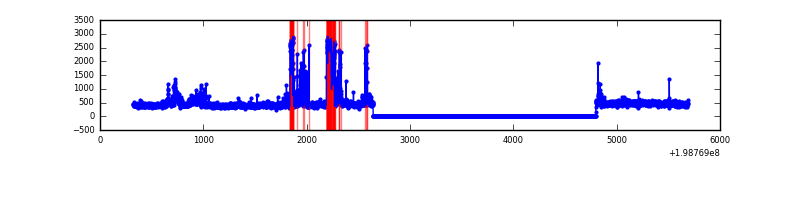 |
| B | 5367 | 3213 | 16 | 16 | 0.30% | 0.50% | 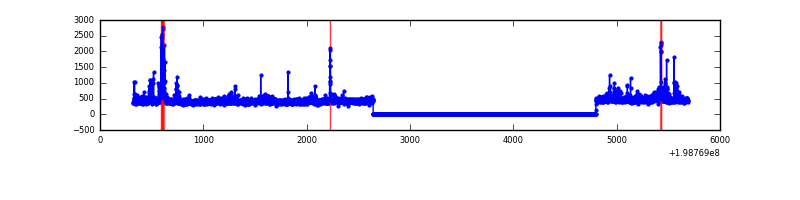 |
| C | 5366 | 3212 | 6 | 6 | 0.11% | 0.19% | 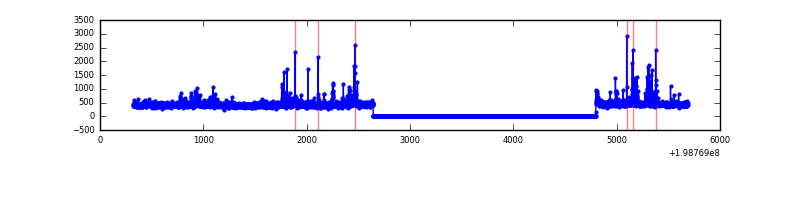 |
| D | 5367 | 3213 | 22 | 22 | 0.41% | 0.68% | 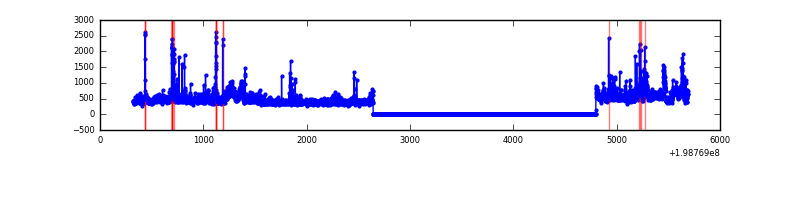 |
Top three noisy pixels from each quadrant. If the there are fewer than three noisy pixels in the level2.evt file, extra rows are filled as -1
| Pixel properties | Quadrant properties | ||||||
|---|---|---|---|---|---|---|---|
| Quadrant | DetID | PixID | Counts | Sigma | Mean | Median | Sigma |
| A | 14 | 249 | 379578 | 5518.29 | 334 | 327 | 68.7 |
| A | 0 | 50 | 62442 | 903.8 | 334 | 327 | 68.7 |
| A | 8 | 15 | 13615 | 193.35 | 334 | 327 | 68.7 |
| B | 14 | 167 | 59238 | 879.25 | 344 | 337 | 67.0 |
| B | 2 | 249 | 47606 | 705.61 | 344 | 337 | 67.0 |
| B | 0 | 219 | 42928 | 635.78 | 344 | 337 | 67.0 |
| C | 6 | 80 | 106094 | 1347.02 | 335 | 337 | 78.5 |
| C | 15 | 208 | 24172 | 303.59 | 335 | 337 | 78.5 |
| C | 12 | 206 | 6382 | 77.0 | 335 | 337 | 78.5 |
| D | 13 | 114 | 308067 | 3911.27 | 330 | 323 | 78.7 |
| D | 2 | 152 | 75937 | 961.02 | 330 | 323 | 78.7 |
| D | 12 | 1 | 23866 | 299.22 | 330 | 323 | 78.7 |
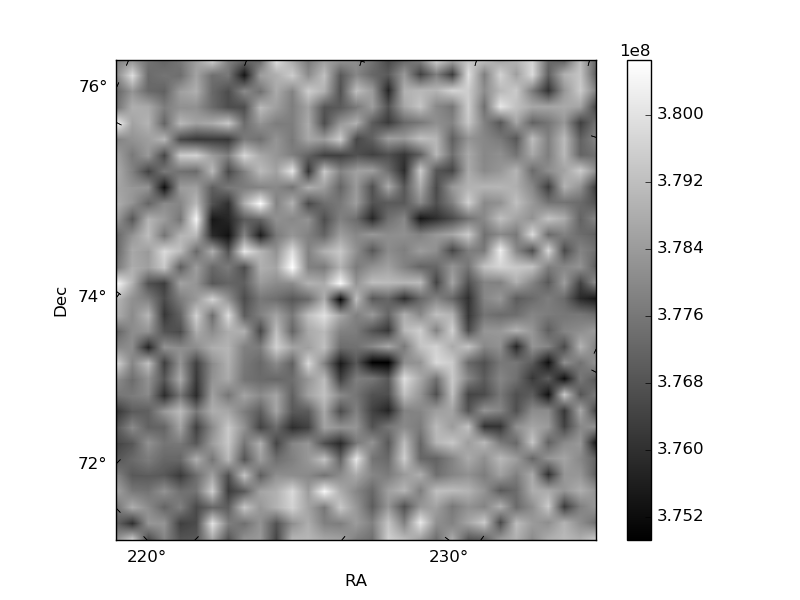
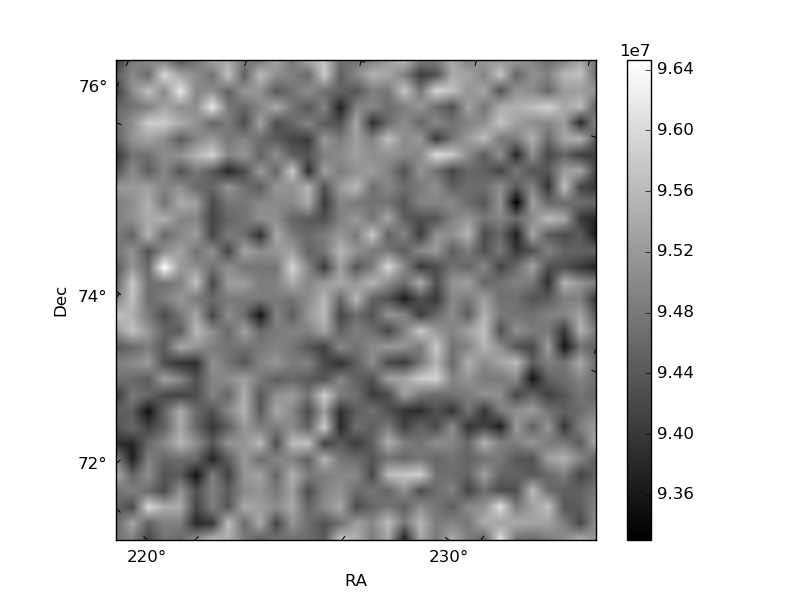
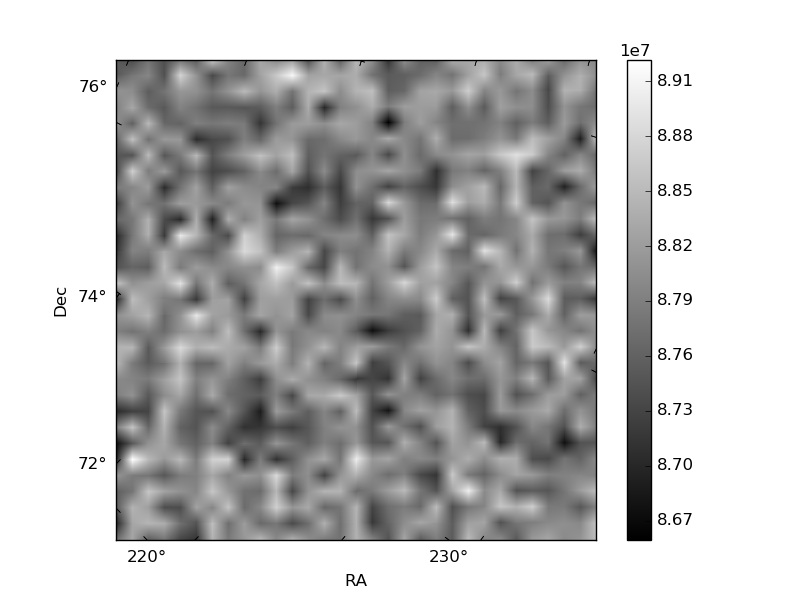
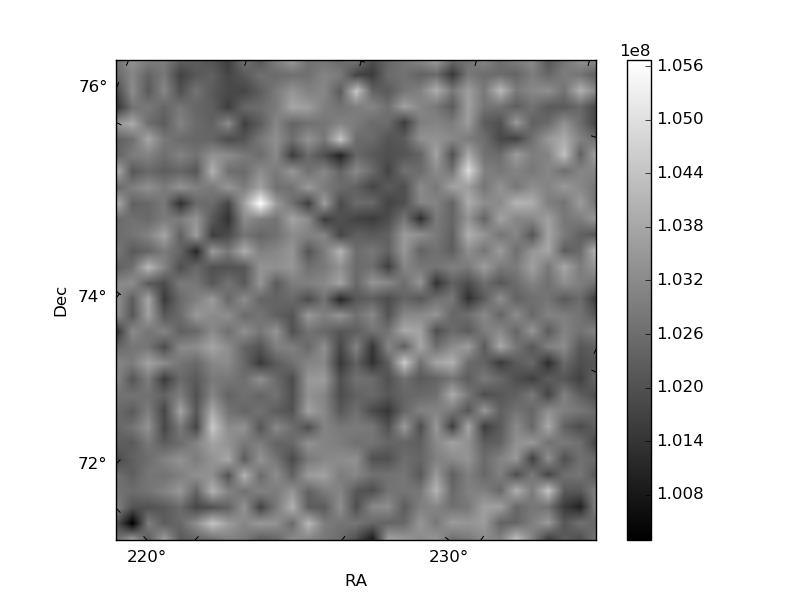
Histogram calculated using DETX and DETY for each event in the final _common_clean file
| Quadrant A | 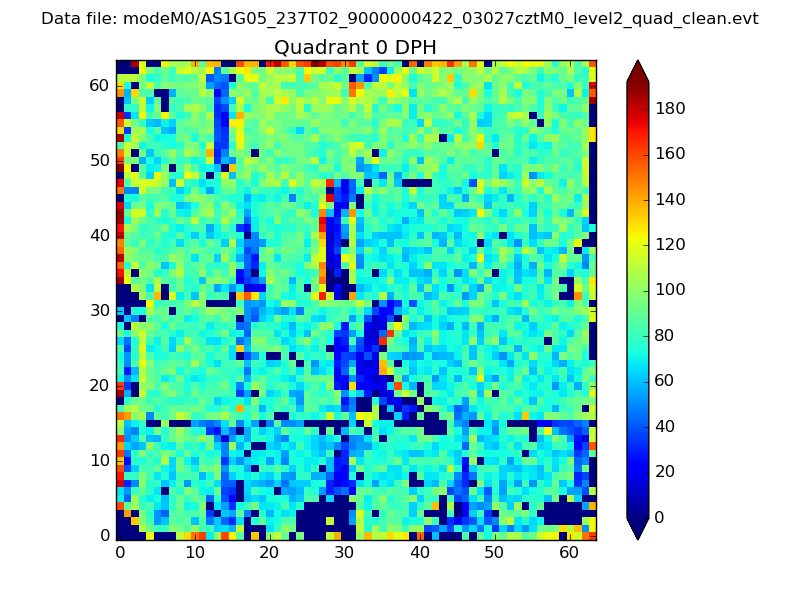 |
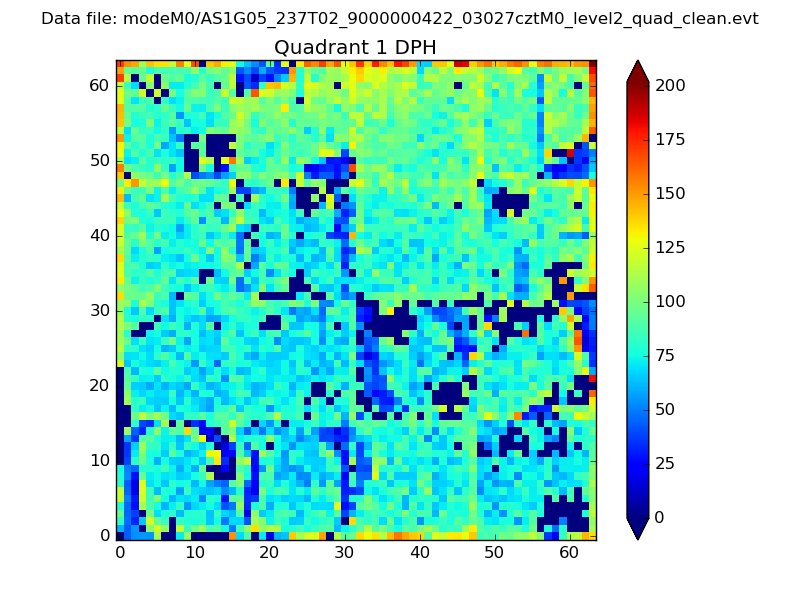 |
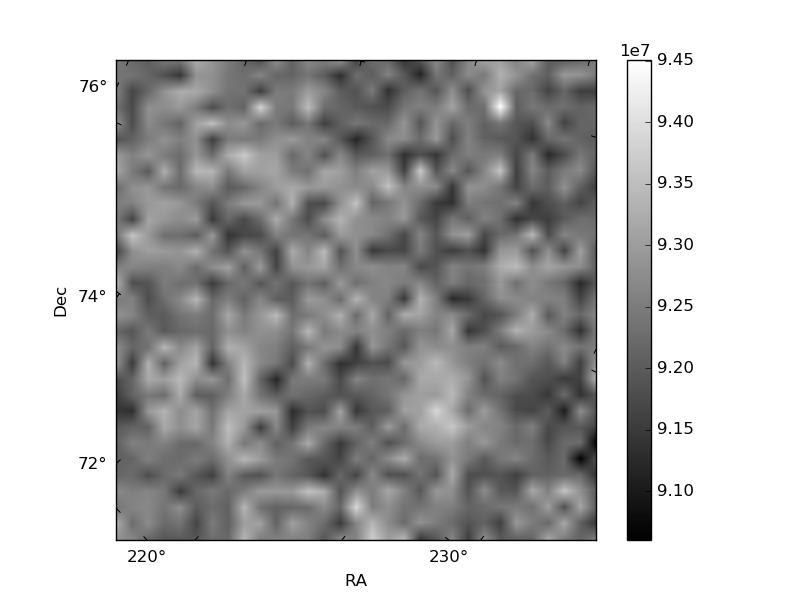
Quadrant B |
|---|---|---|---|
| Quadrant D | 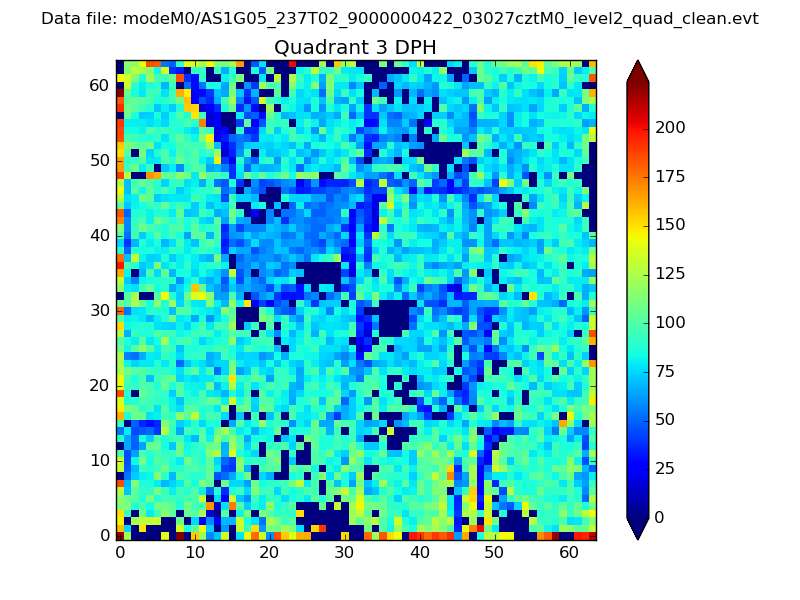 |
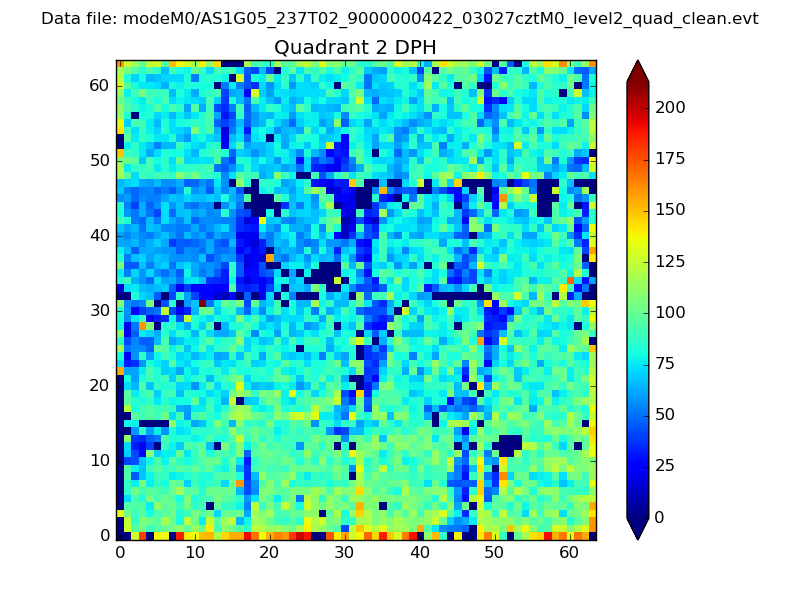 |
Quadrant C |
| Plot type | Count rate plots | Images |
|---|---|---|
| Comparison with Poisson distribution Blue bars denote a histogram of data divided into 1 sec bins. Red curve is a Poisson curve with rate = median count rate of data. |
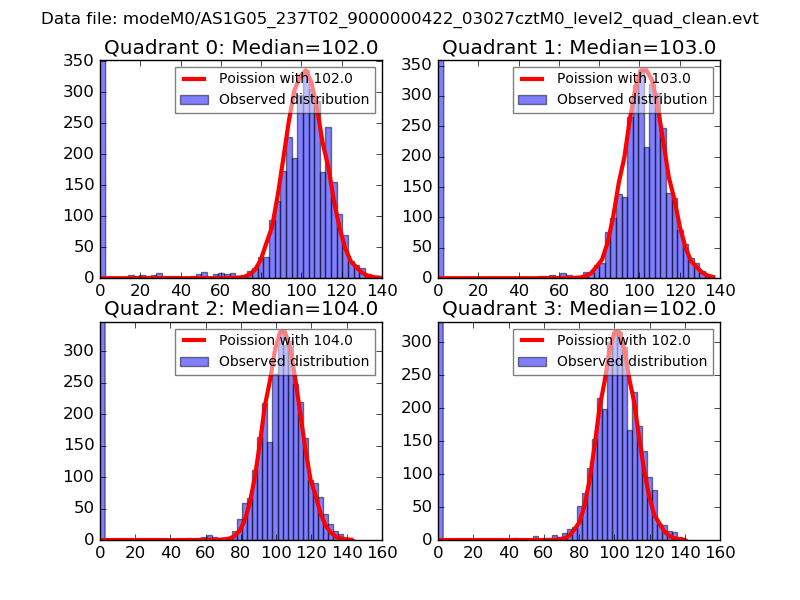 |
 |
| Quadrant-wise count rates Data is divided into 100 sec bins |
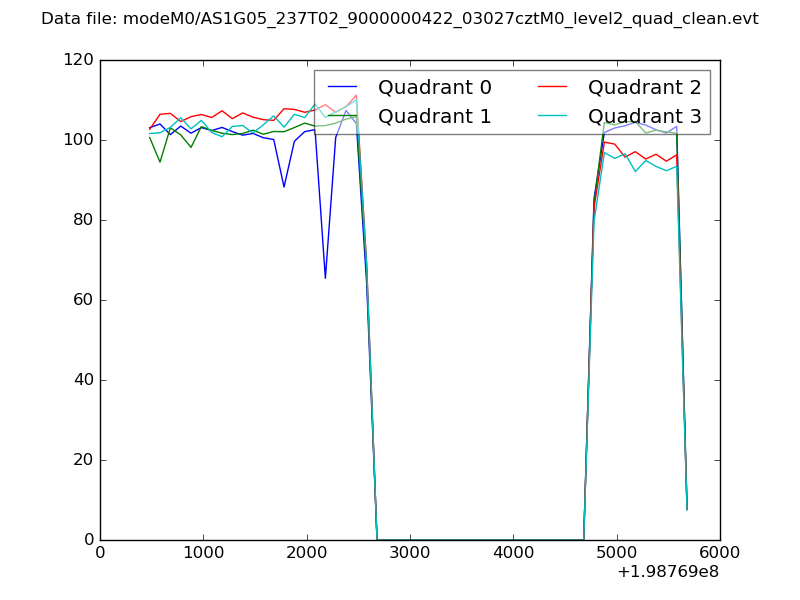 |
|
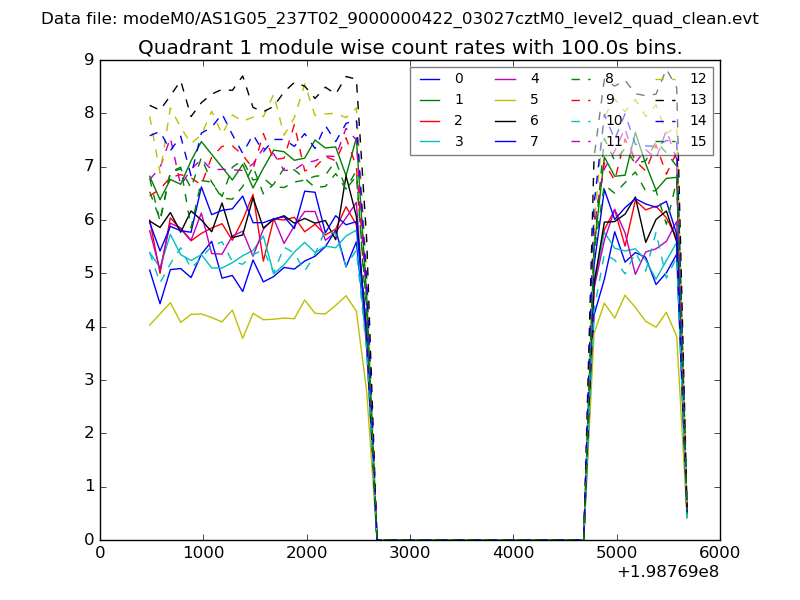
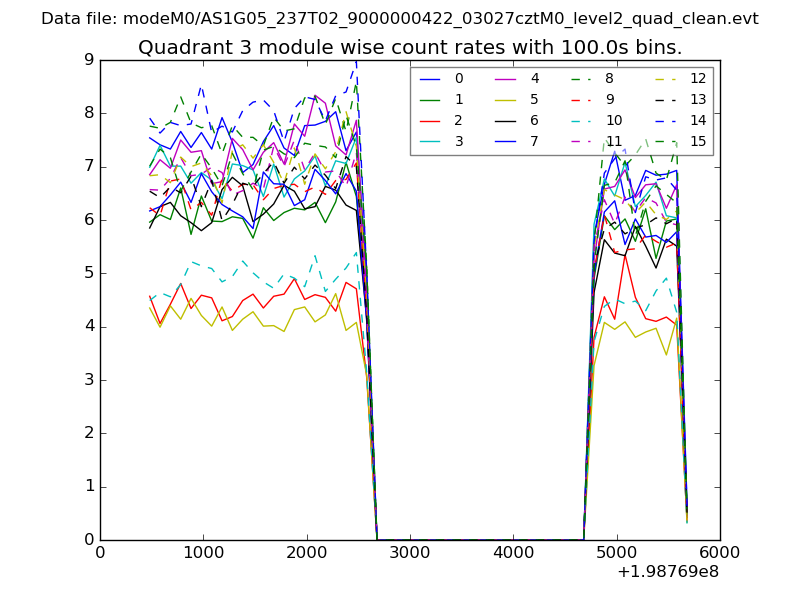
| Module-wise count rates for Quadrant A Data is divided into 100 sec bins |
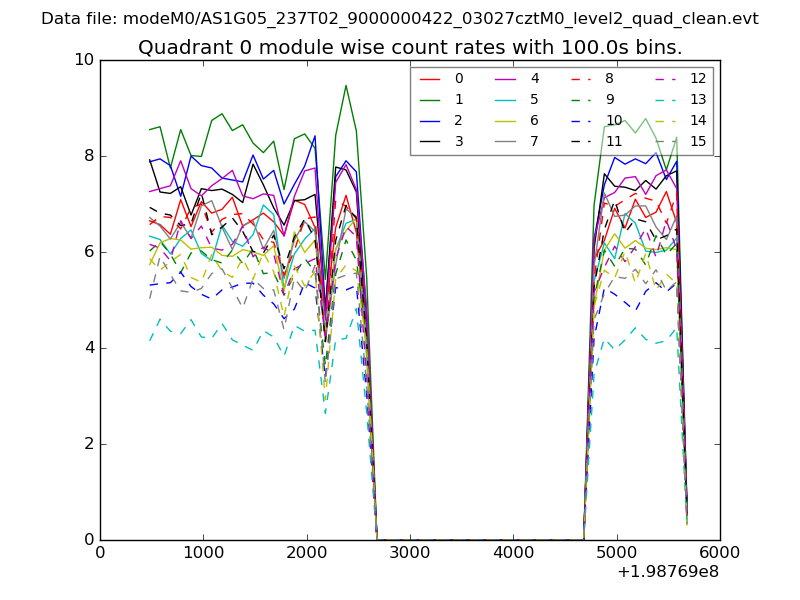 |
 |
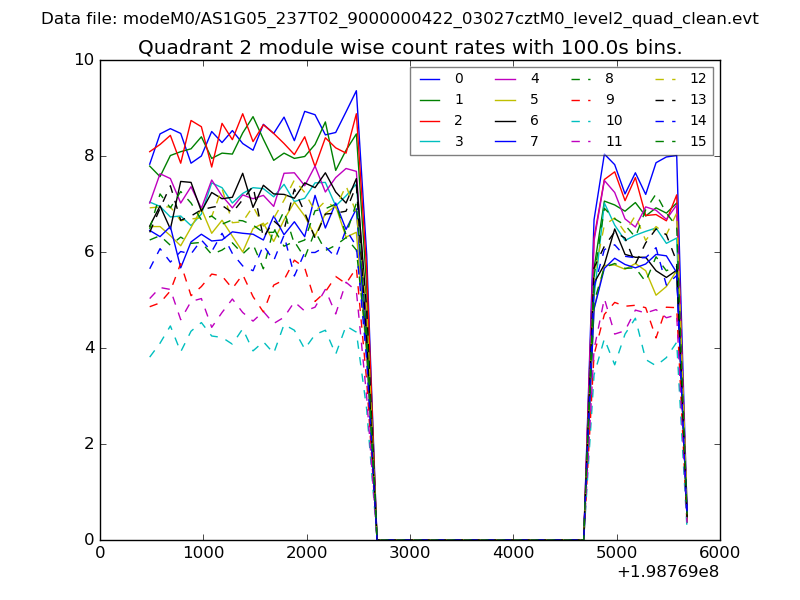
| Module-wise count rates for Quadrant B Data is divided into 100 sec bins |
 |
 |
| Module-wise count rates for Quadrant C Data is divided into 100 sec bins |
 |
 |
| Module-wise count rates for Quadrant D Data is divided into 100 sec bins |
 |
 |
| Parameter | Plot |
|---|---|
| CZT HV Monitor | 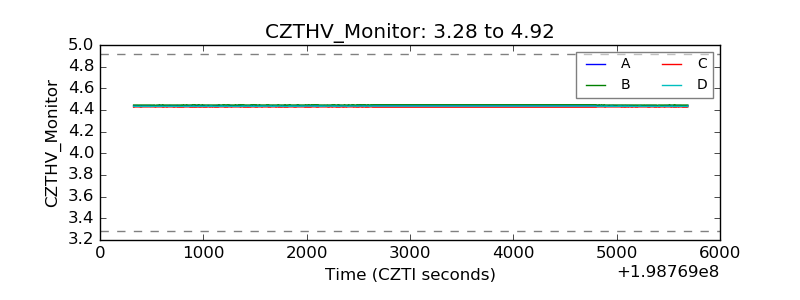 |
| D_VDD | 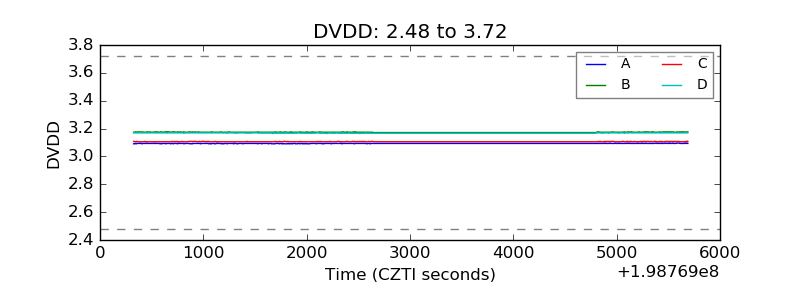 |
| Temperature 1 | 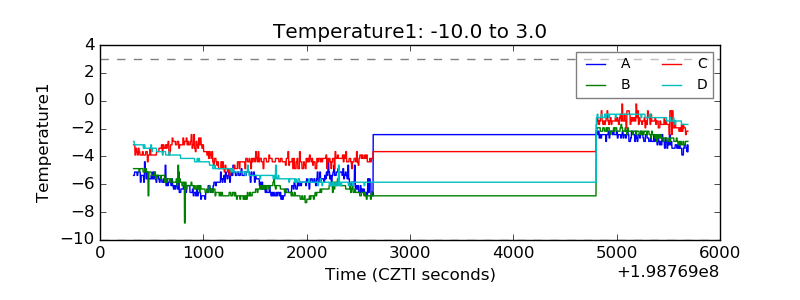 |
| Veto HV Monitor | 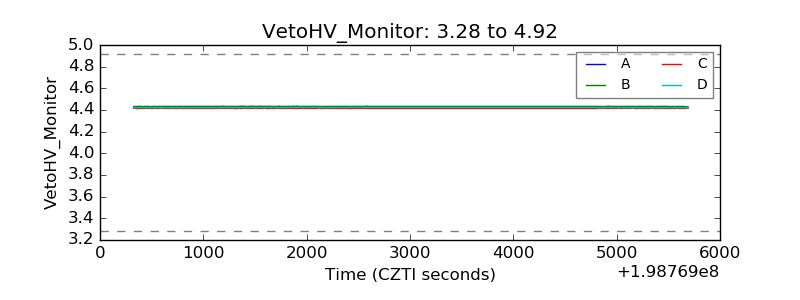 |
| Veto LLD | 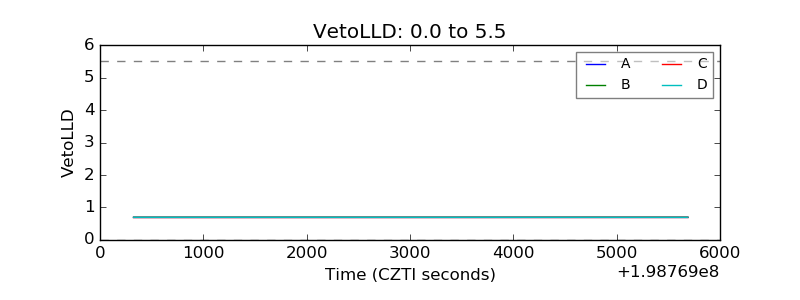 |
| Alpha Counter | 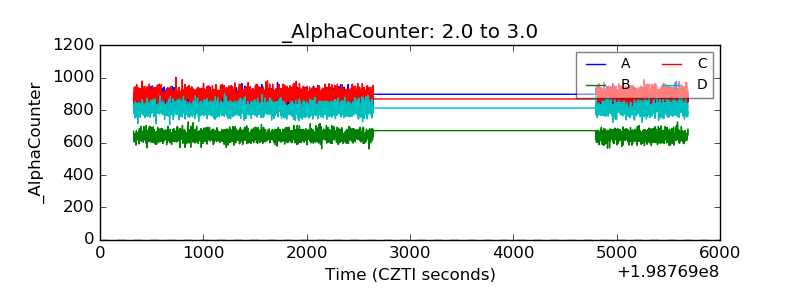 |
| _CPM_Rate | 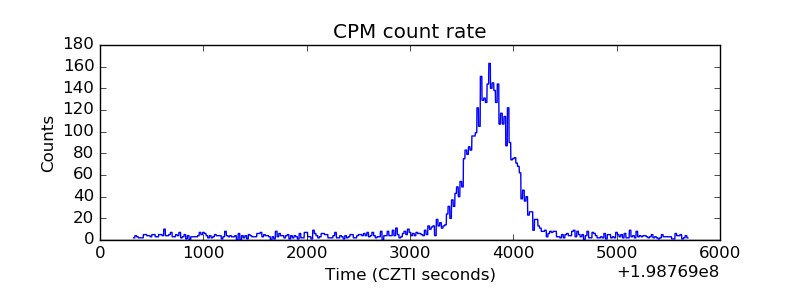 |
| CZT Counter | 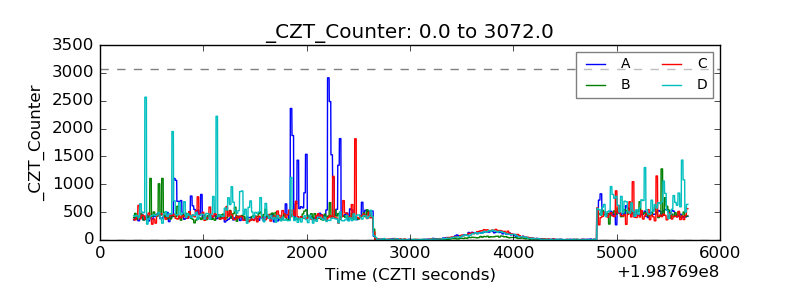 |
| +2.5 Volts monitor | 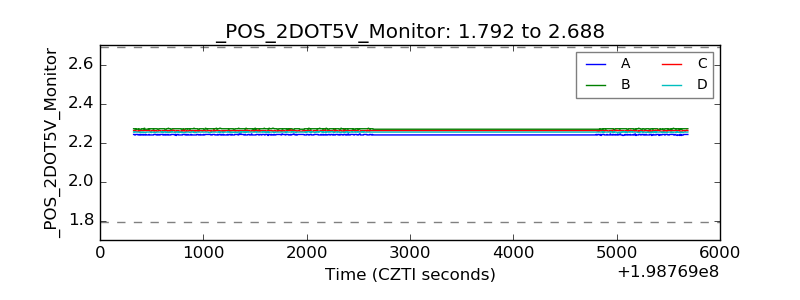 |
| +5 Volts monitor |  |
| _ROLL_ROT | 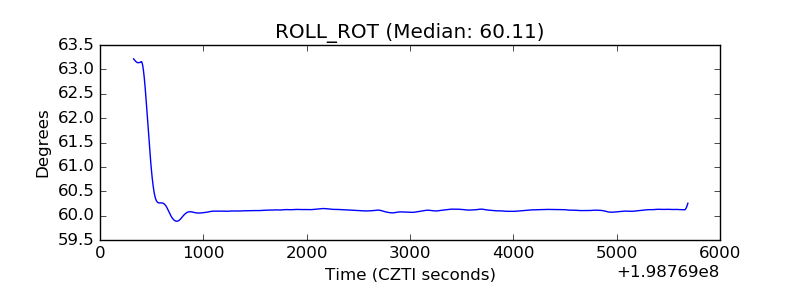 |
| _Roll_DEC | 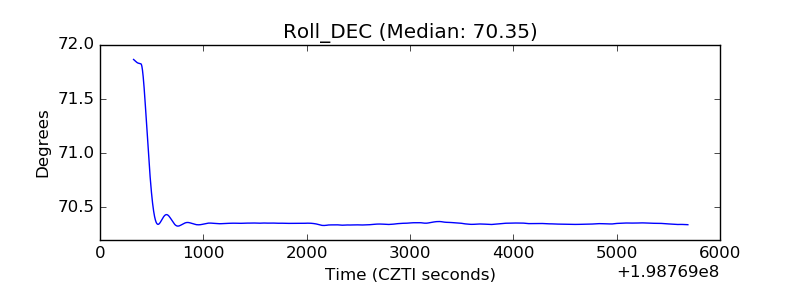 |
| _Roll_RA | 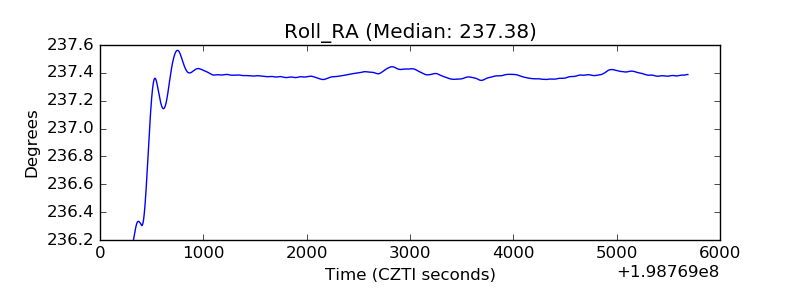 |
| Veto Counter | 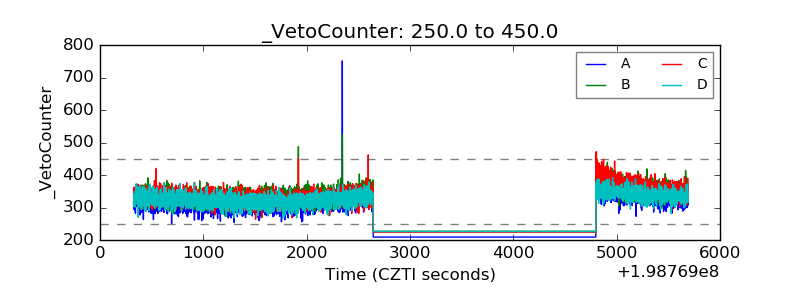 |