| Param | Original file | Final file |
|---|---|---|
| Filename | modeM0/AS1G05_237T02_9000000422_03028cztM0_level2.evt | modeM0/AS1G05_237T02_9000000422_03028cztM0_level2_quad_clean.evt |
| Size (bytes) | 340,185,600 | 75,962,880 |
| Size | 324.4 MB | 72.4 MB |
| Events in quadrant A | 2,319,693 | 490,298 |
| Events in quadrant B | 2,318,961 | 491,894 |
| Events in quadrant C | 2,268,190 | 494,417 |
| Events in quadrant D | 3,059,249 | 477,319 |
| Mode SS | |||
|---|---|---|---|
| Quadrant | BADHDUFLAG | Total packets | Discarded packets |
| A | 0 | 102 | 0 |
| B | 0 | 102 | 0 |
| C | 0 | 102 | 0 |
| D | 0 | 102 | 0 |
| Mode M9 | |||
|---|---|---|---|
| Quadrant | BADHDUFLAG | Total packets | Discarded packets |
| A | 0 | 21 | 0 |
| B | 0 | 21 | 0 |
| C | 0 | 21 | 0 |
| D | 0 | 21 | 0 |
| Mode M0 | |||
|---|---|---|---|
| Quadrant | BADHDUFLAG | Total packets | Discarded packets |
| A | 0 | 10495 | 3 |
| B | 0 | 10393 | 2 |
| C | 0 | 10312 | 2 |
| D | 0 | 12886 | 2 |
| Quadrant | Total seconds | Saturated seconds | Saturation percentage |
|---|---|---|---|
| A | 4931 | 31 | 0.628676% |
| B | 4931 | 19 | 0.385317% |
| C | 4931 | 7 | 0.141959% |
| D | 4932 | 147 | 2.980535% |
Noise dominated data is calculated using 1-second bins in cleaned event files. If a bin has >2000 counts, and if more than 50% of those come from <1% of pixels, then it is considered to be noise-dominated and hence unusable.
| Quadrant | # 1 sec bins | Bins with >0 counts | Bins with >2000 counts | High rate bins dominated by noise | Noise dominated (total time) | Noise dominated (detector-on time) | Marked lightcurve |
|---|---|---|---|---|---|---|---|
| A | 7085 | 4931 | 20 | 20 | 0.28% | 0.41% | 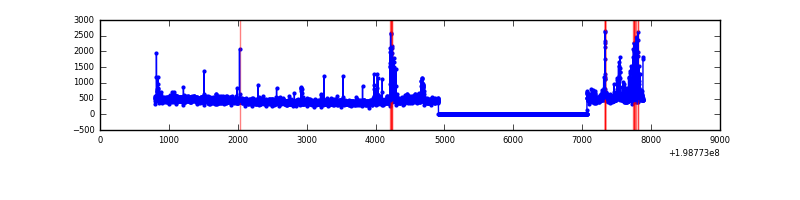 |
| B | 7085 | 4930 | 14 | 14 | 0.20% | 0.28% | 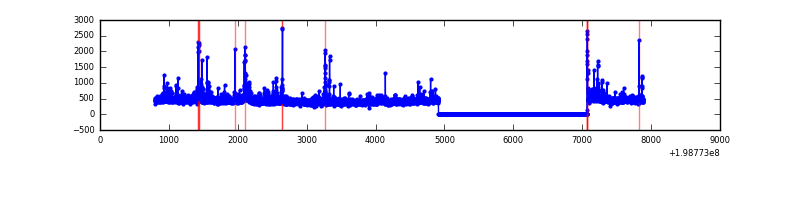 |
| C | 7085 | 4931 | 5 | 5 | 0.07% | 0.10% | 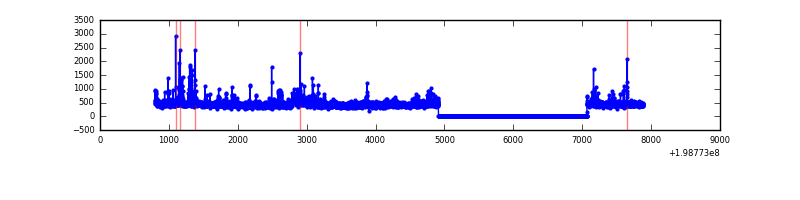 |
| D | 7086 | 4932 | 141 | 141 | 1.99% | 2.86% | 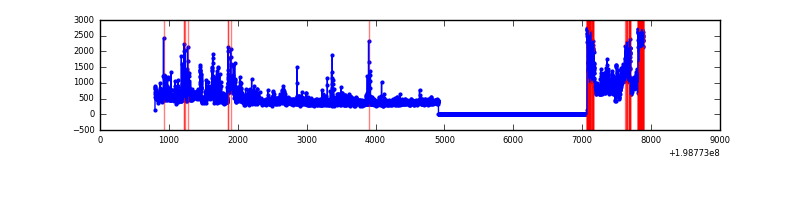 |
Top three noisy pixels from each quadrant. If the there are fewer than three noisy pixels in the level2.evt file, extra rows are filled as -1
| Pixel properties | Quadrant properties | ||||||
|---|---|---|---|---|---|---|---|
| Quadrant | DetID | PixID | Counts | Sigma | Mean | Median | Sigma |
| A | 14 | 249 | 180274 | 1680.32 | 519 | 506 | 107.0 |
| A | 12 | 247 | 51601 | 477.59 | 519 | 506 | 107.0 |
| A | 8 | 15 | 25149 | 230.34 | 519 | 506 | 107.0 |
| B | 14 | 167 | 85070 | 831.99 | 528 | 516 | 101.6 |
| B | 0 | 219 | 83159 | 813.19 | 528 | 516 | 101.6 |
| B | 15 | 85 | 41376 | 402.05 | 528 | 516 | 101.6 |
| C | 1 | 192 | 115292 | 964.27 | 511 | 514 | 119.0 |
| C | 6 | 80 | 82975 | 692.77 | 511 | 514 | 119.0 |
| C | 15 | 208 | 21736 | 178.29 | 511 | 514 | 119.0 |
| D | 13 | 114 | 965282 | 8157.2 | 501 | 489 | 118.3 |
| D | 2 | 152 | 118092 | 994.32 | 501 | 489 | 118.3 |
| D | 13 | 239 | 17348 | 142.54 | 501 | 489 | 118.3 |
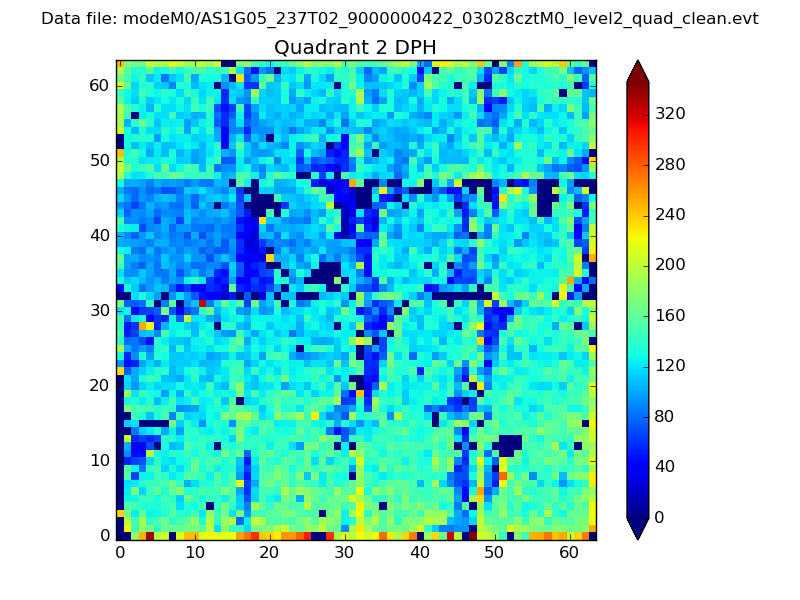
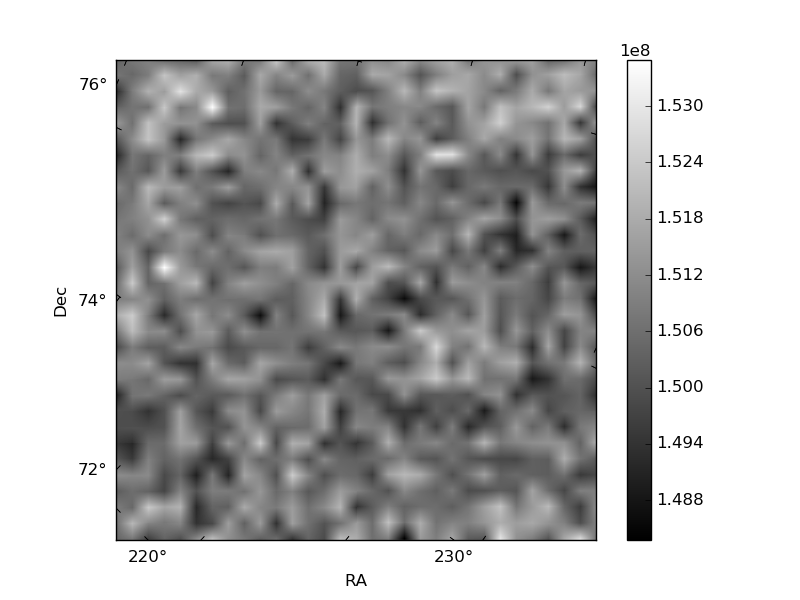
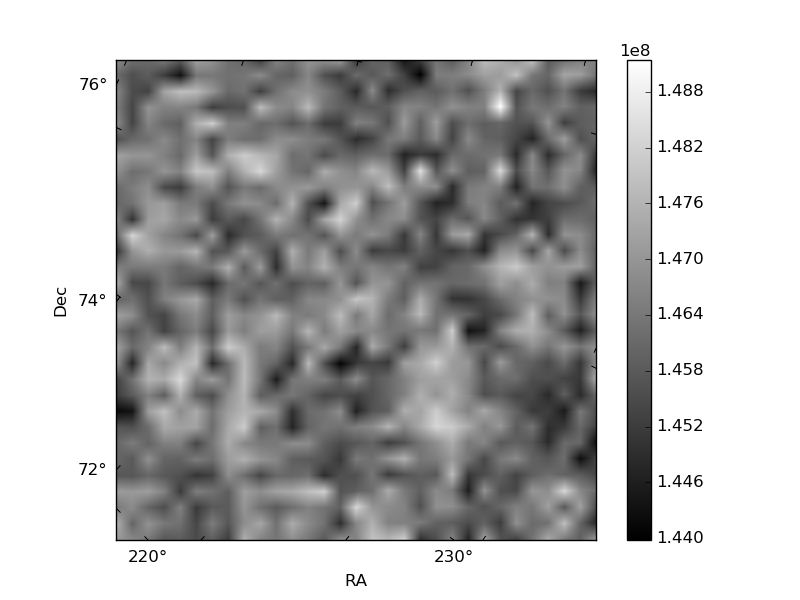
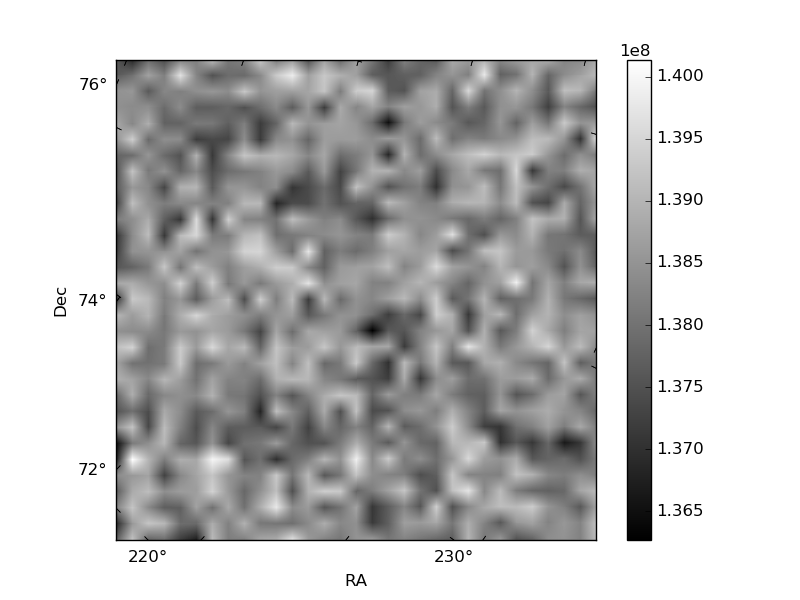
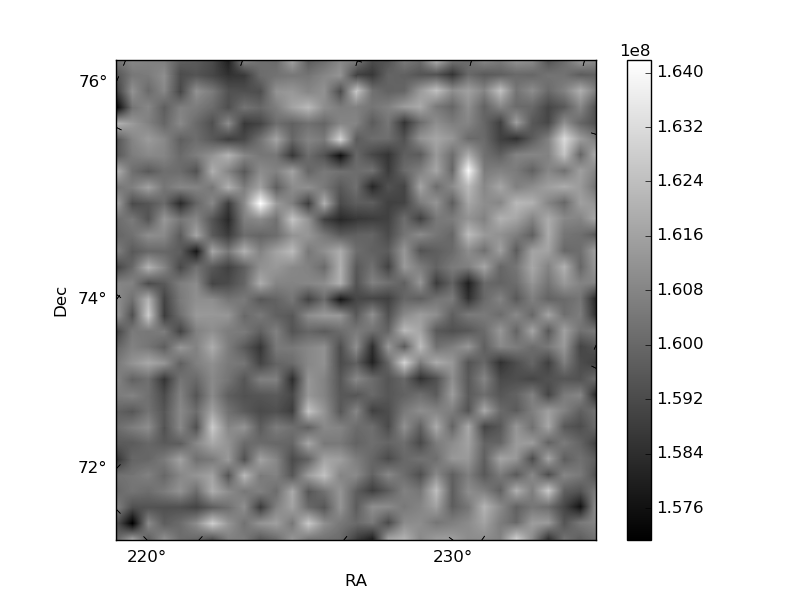
Histogram calculated using DETX and DETY for each event in the final _common_clean file
| Quadrant A | 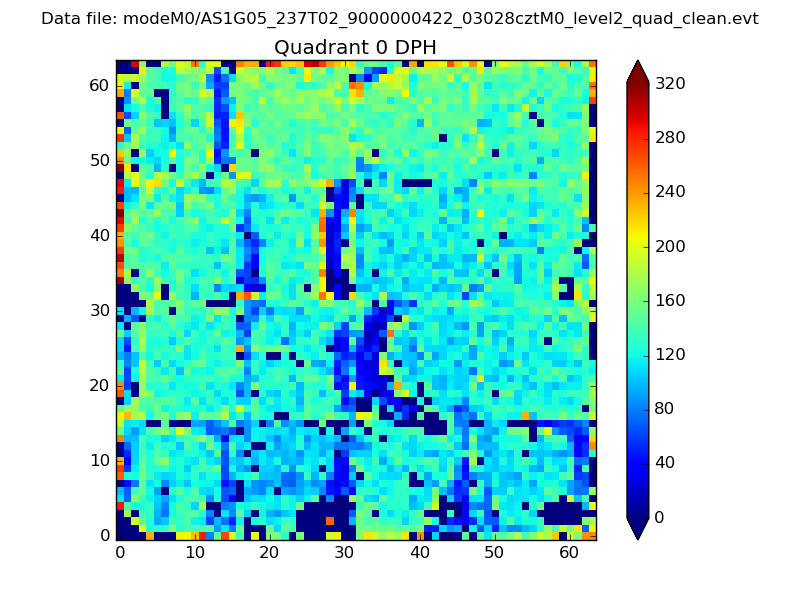 |
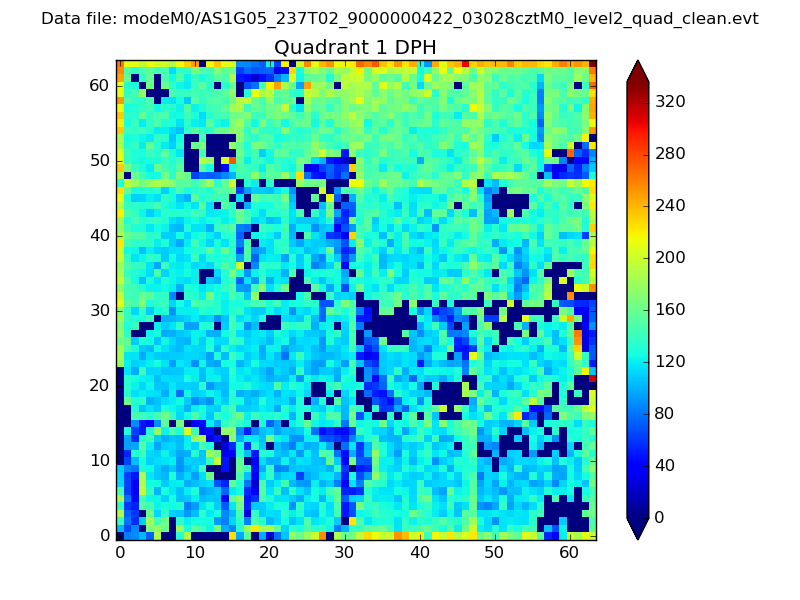 |
Quadrant B |
|---|---|---|---|
| Quadrant D | 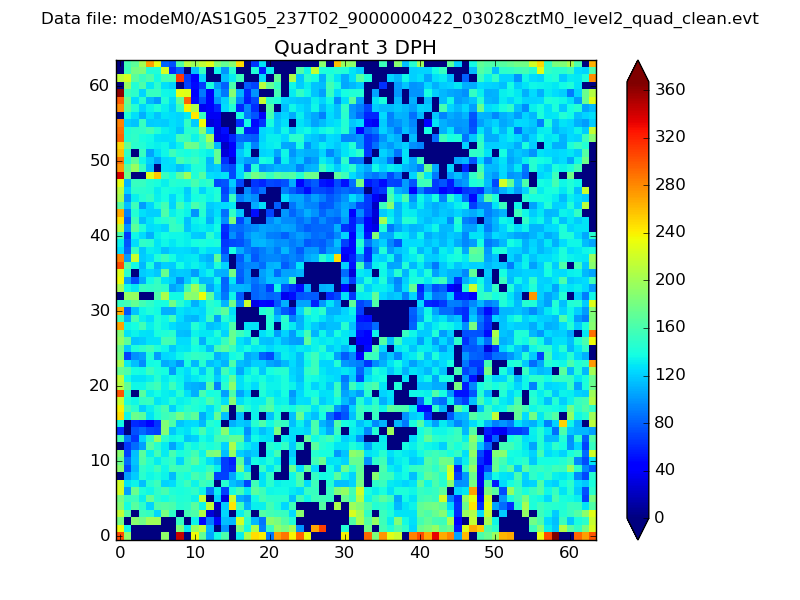 |
 |
Quadrant C |
| Plot type | Count rate plots | Images |
|---|---|---|
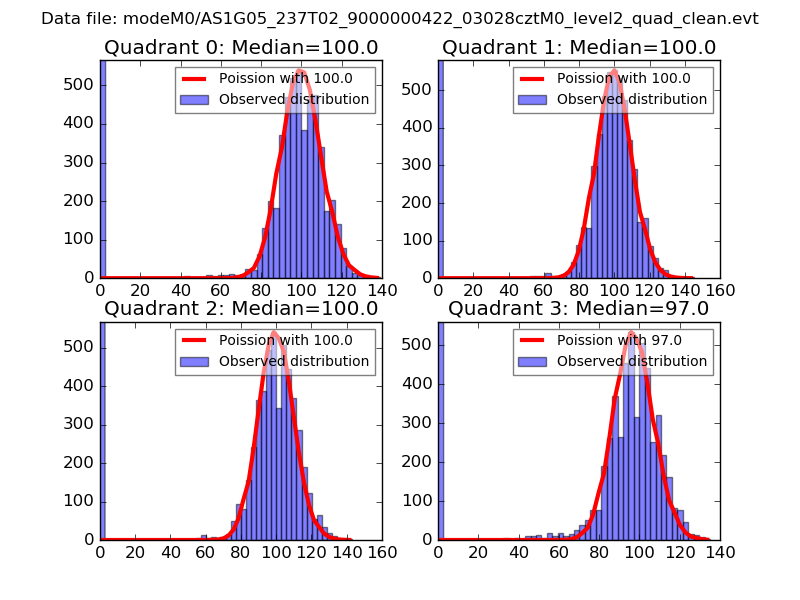
| Comparison with Poisson distribution Blue bars denote a histogram of data divided into 1 sec bins. Red curve is a Poisson curve with rate = median count rate of data. |
 |
 |
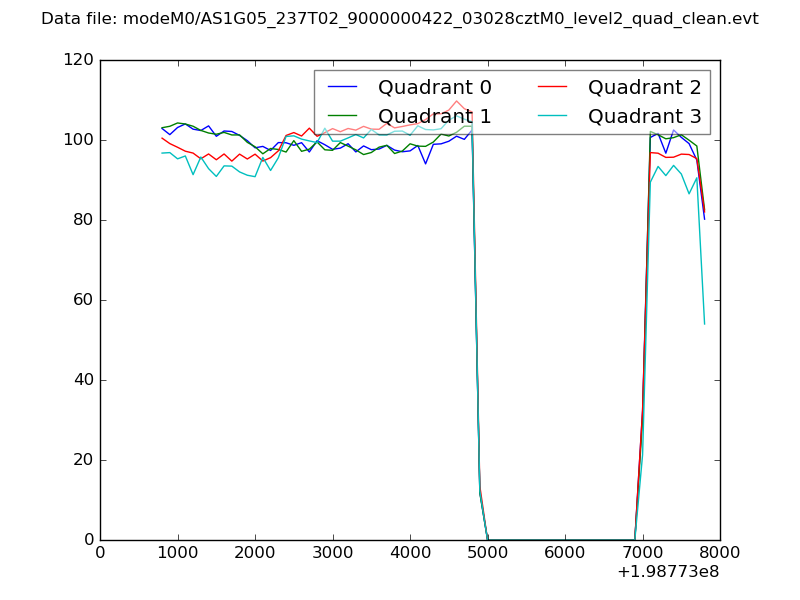
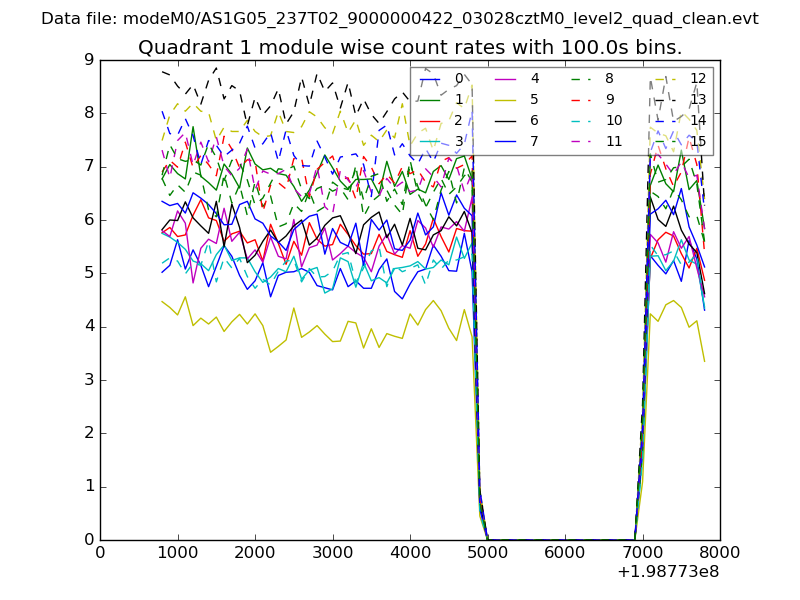
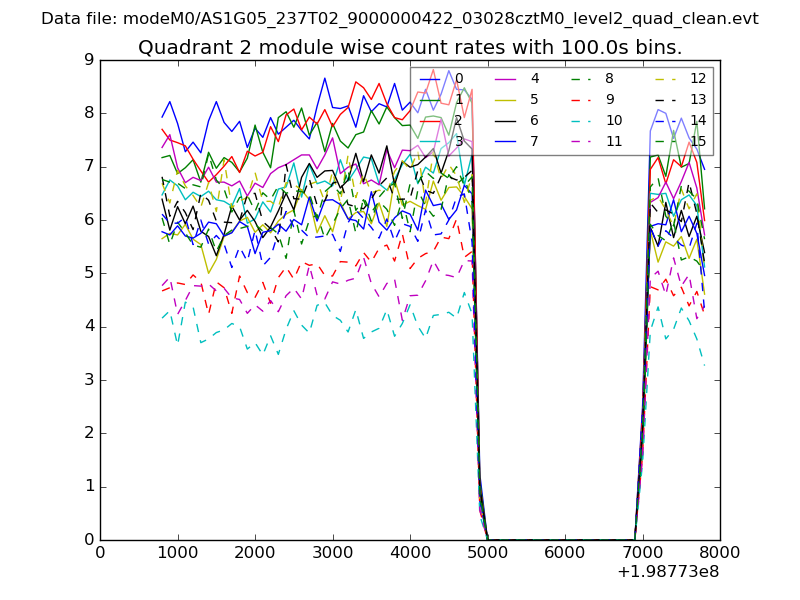
| Quadrant-wise count rates Data is divided into 100 sec bins |
 |
|
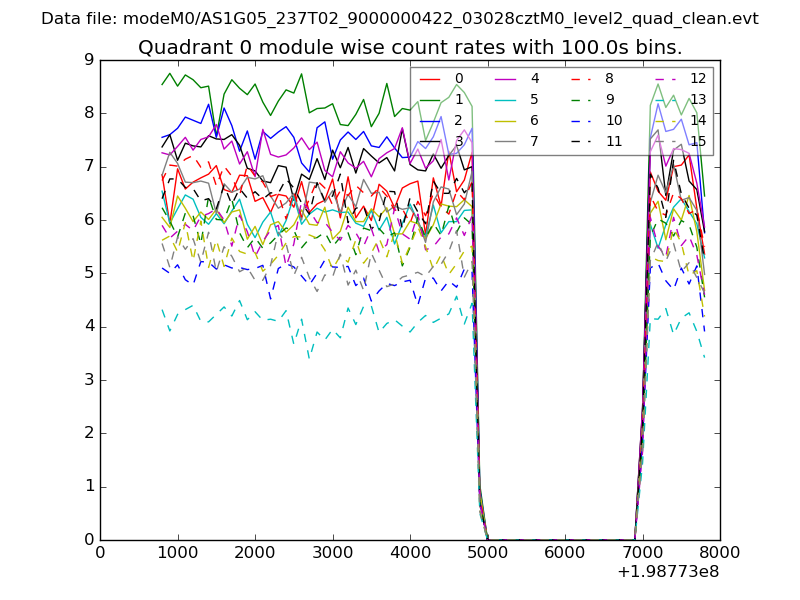
| Module-wise count rates for Quadrant A Data is divided into 100 sec bins |
 |
 |
| Module-wise count rates for Quadrant B Data is divided into 100 sec bins |
 |
 |
| Module-wise count rates for Quadrant C Data is divided into 100 sec bins |
 |
 |
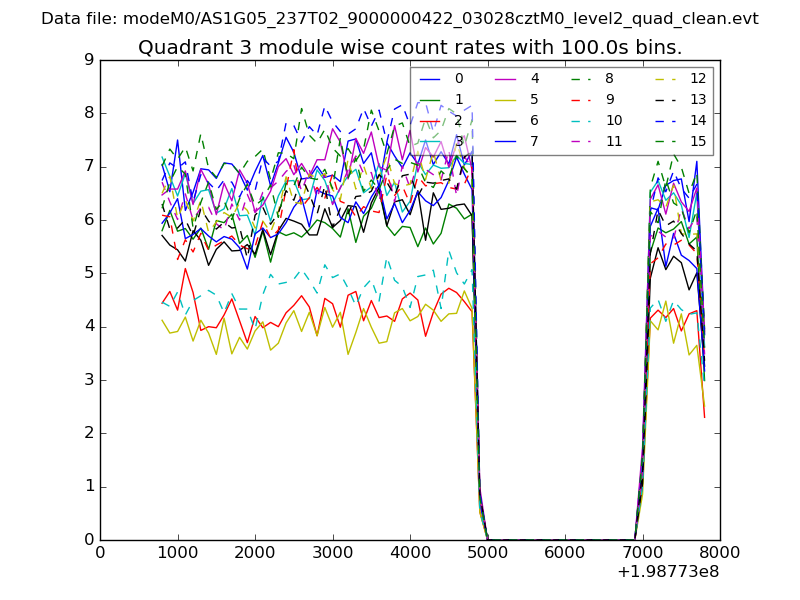
| Module-wise count rates for Quadrant D Data is divided into 100 sec bins |
 |
 |
| Parameter | Plot |
|---|---|
| CZT HV Monitor | 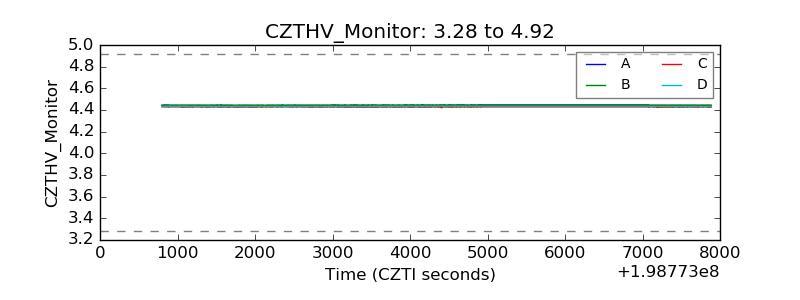 |
| D_VDD | 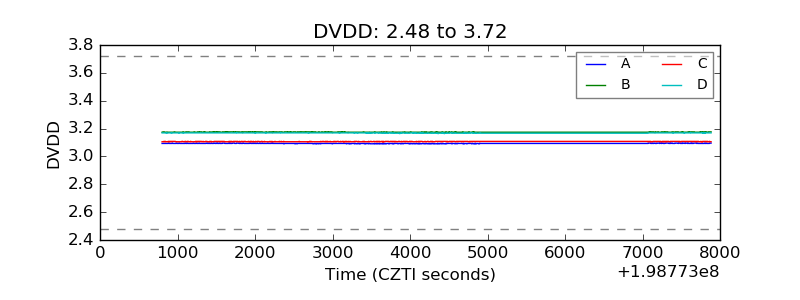 |
| Temperature 1 | 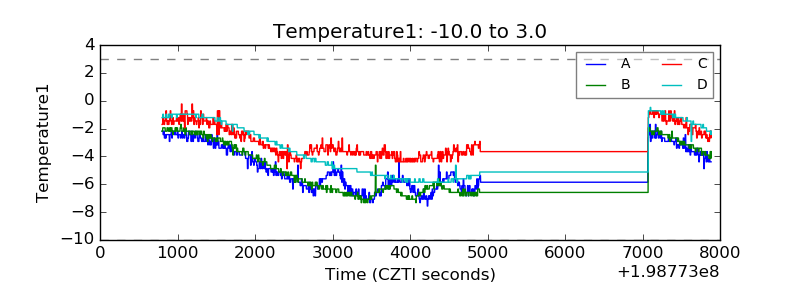 |
| Veto HV Monitor | 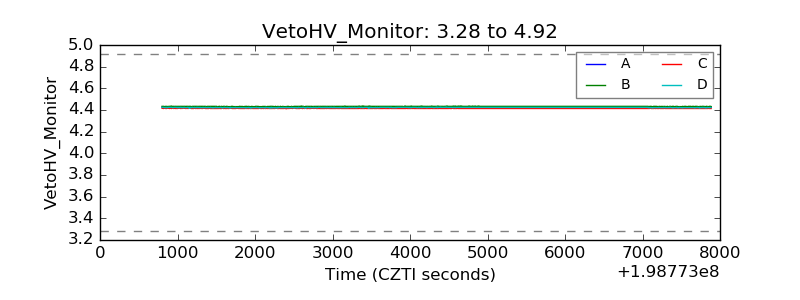 |
| Veto LLD | 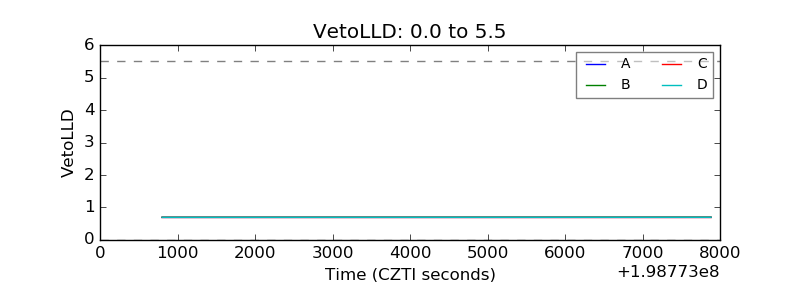 |
| Alpha Counter | 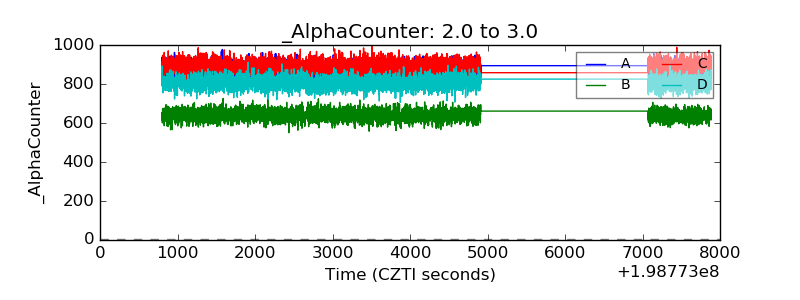 |
| _CPM_Rate | 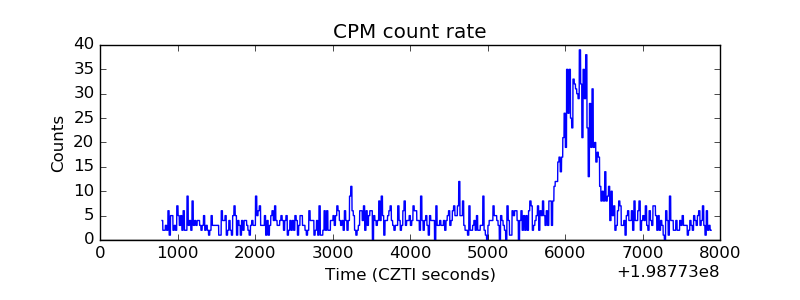 |
| CZT Counter | 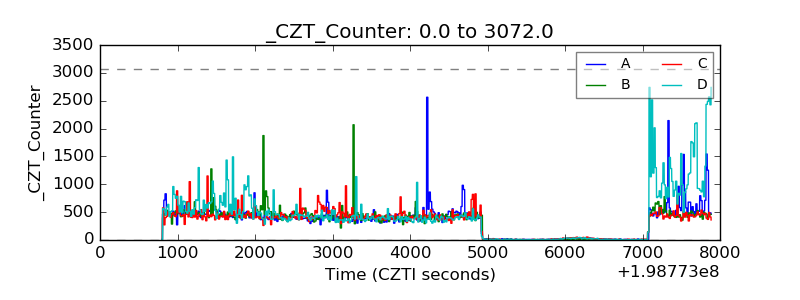 |
| +2.5 Volts monitor |  |
| +5 Volts monitor |  |
| _ROLL_ROT | 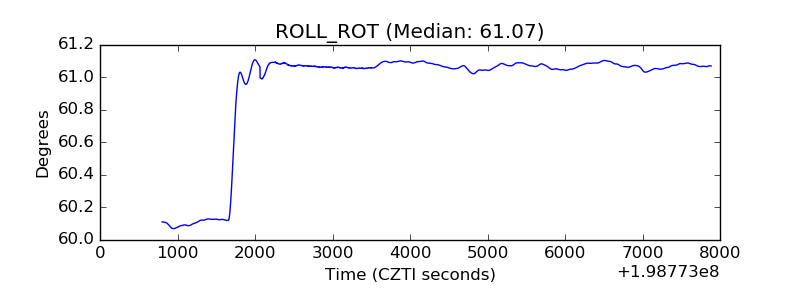 |
| _Roll_DEC | 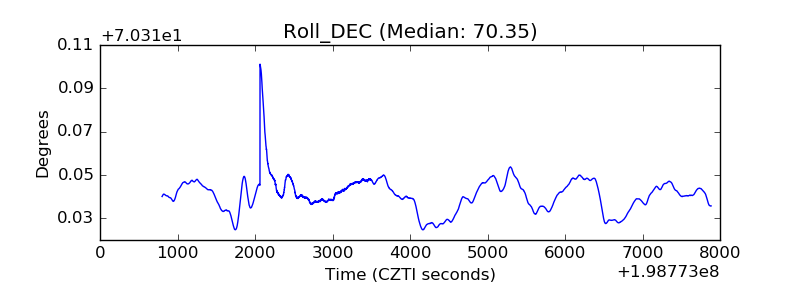 |
| _Roll_RA | 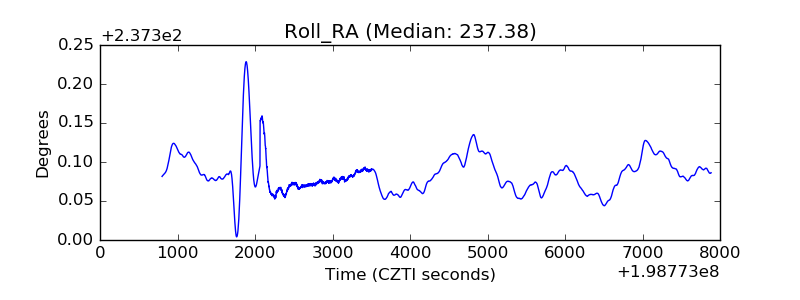 |
| Veto Counter | 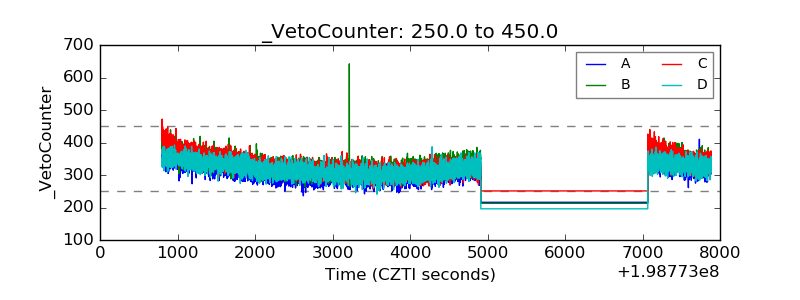 |