| Param | Original file | Final file |
|---|---|---|
| Filename | modeM0/AS1G05_237T02_9000000422_03029cztM0_level2.evt | modeM0/AS1G05_237T02_9000000422_03029cztM0_level2_quad_clean.evt |
| Size (bytes) | 377,216,640 | 75,862,080 |
| Size | 359.7 MB | 72.3 MB |
| Events in quadrant A | 2,268,552 | 488,063 |
| Events in quadrant B | 2,447,845 | 487,332 |
| Events in quadrant C | 2,143,254 | 499,712 |
| Events in quadrant D | 4,223,644 | 470,945 |
| Mode SS | |||
|---|---|---|---|
| Quadrant | BADHDUFLAG | Total packets | Discarded packets |
| A | 0 | 102 | 0 |
| B | 0 | 102 | 0 |
| C | 0 | 102 | 0 |
| D | 0 | 102 | 0 |
| Mode M9 | |||
|---|---|---|---|
| Quadrant | BADHDUFLAG | Total packets | Discarded packets |
| A | 0 | 25 | 0 |
| B | 0 | 25 | 0 |
| C | 0 | 25 | 0 |
| D | 0 | 26 | 0 |
| Mode M0 | |||
|---|---|---|---|
| Quadrant | BADHDUFLAG | Total packets | Discarded packets |
| A | 0 | 10561 | 3 |
| B | 0 | 10857 | 2 |
| C | 0 | 10276 | 2 |
| D | 0 | 16190 | 2 |
| Quadrant | Total seconds | Saturated seconds | Saturation percentage |
|---|---|---|---|
| A | 5005 | 34 | 0.679321% |
| B | 5005 | 58 | 1.158841% |
| C | 5005 | 8 | 0.159840% |
| D | 5005 | 367 | 7.332667% |
Noise dominated data is calculated using 1-second bins in cleaned event files. If a bin has >2000 counts, and if more than 50% of those come from <1% of pixels, then it is considered to be noise-dominated and hence unusable.
| Quadrant | # 1 sec bins | Bins with >0 counts | Bins with >2000 counts | High rate bins dominated by noise | Noise dominated (total time) | Noise dominated (detector-on time) | Marked lightcurve |
|---|---|---|---|---|---|---|---|
| A | 7160 | 5005 | 24 | 24 | 0.34% | 0.48% | 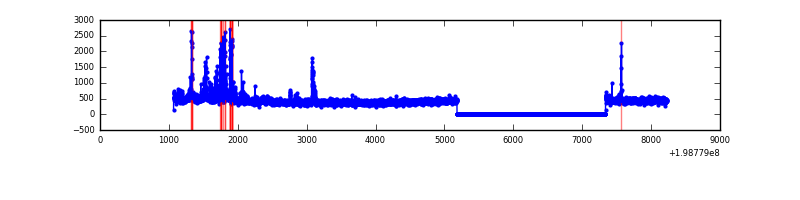 |
| B | 7160 | 5005 | 53 | 53 | 0.74% | 1.06% | 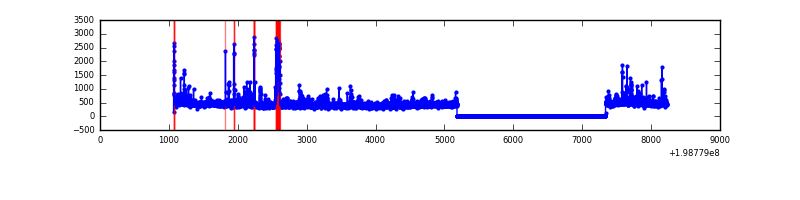 |
| C | 7160 | 5005 | 5 | 5 | 0.07% | 0.10% | 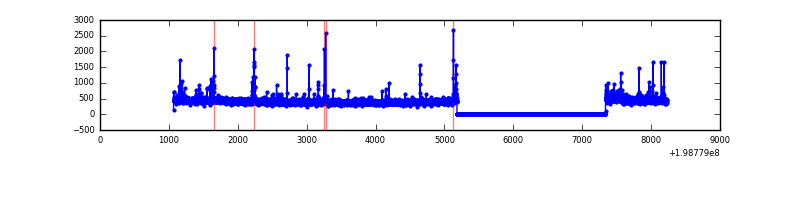 |
| D | 7160 | 5005 | 396 | 396 | 5.53% | 7.91% | 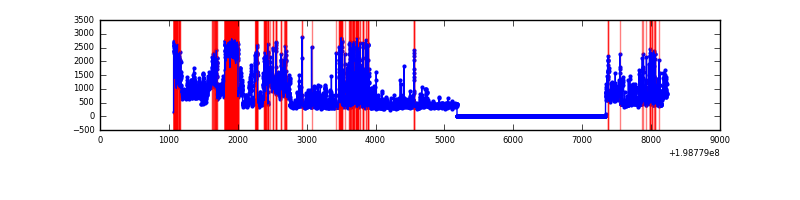 |
Top three noisy pixels from each quadrant. If the there are fewer than three noisy pixels in the level2.evt file, extra rows are filled as -1
| Pixel properties | Quadrant properties | ||||||
|---|---|---|---|---|---|---|---|
| Quadrant | DetID | PixID | Counts | Sigma | Mean | Median | Sigma |
| A | 14 | 249 | 112236 | 1045.92 | 516 | 503 | 106.8 |
| A | 12 | 247 | 54655 | 506.91 | 516 | 503 | 106.8 |
| A | 0 | 50 | 34524 | 318.47 | 516 | 503 | 106.8 |
| B | 2 | 249 | 135032 | 1328.65 | 526 | 513 | 101.2 |
| B | 14 | 167 | 63131 | 618.48 | 526 | 513 | 101.2 |
| B | 0 | 219 | 62098 | 608.28 | 526 | 513 | 101.2 |
| C | 6 | 80 | 76641 | 639.93 | 513 | 515 | 119.0 |
| C | 1 | 192 | 23821 | 195.92 | 513 | 515 | 119.0 |
| C | 1 | 16 | 17518 | 142.93 | 513 | 515 | 119.0 |
| D | 13 | 114 | 1720452 | 13672.69 | 494 | 482 | 125.8 |
| D | 10 | 237 | 200351 | 1588.83 | 494 | 482 | 125.8 |
| D | 10 | 213 | 115699 | 915.9 | 494 | 482 | 125.8 |
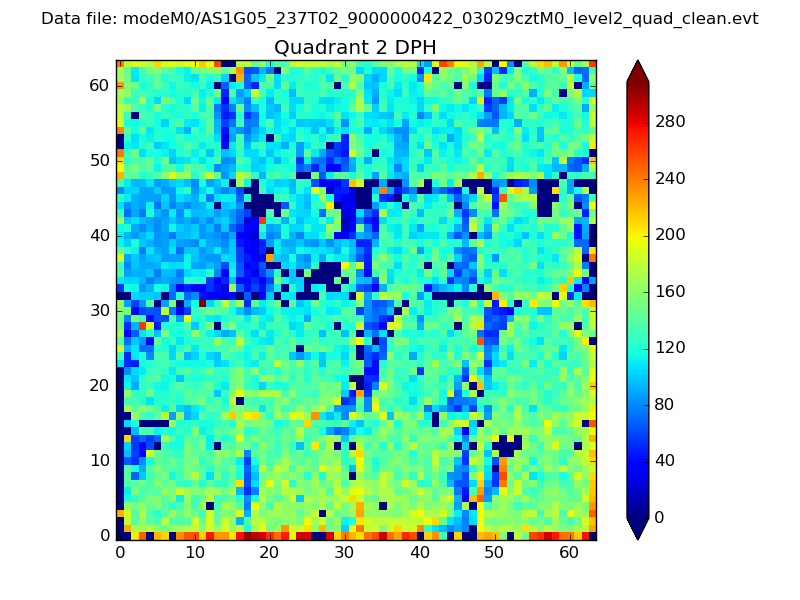
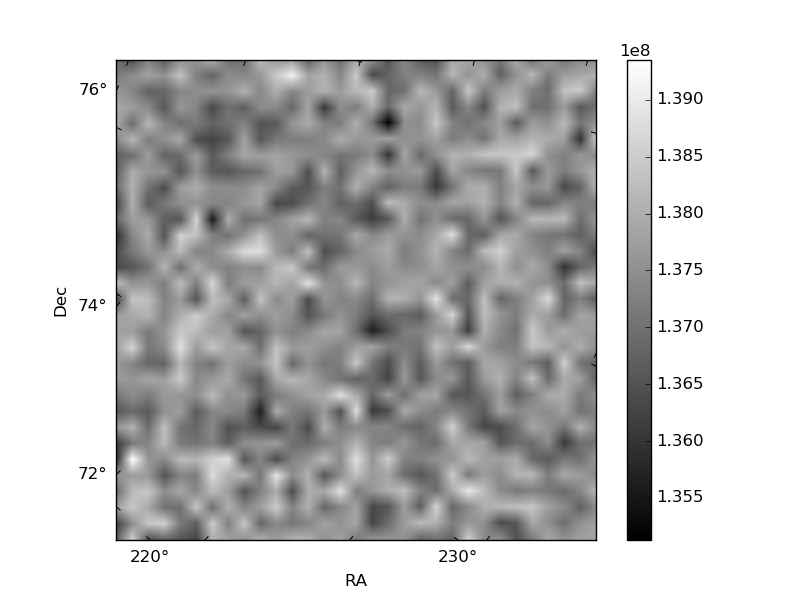
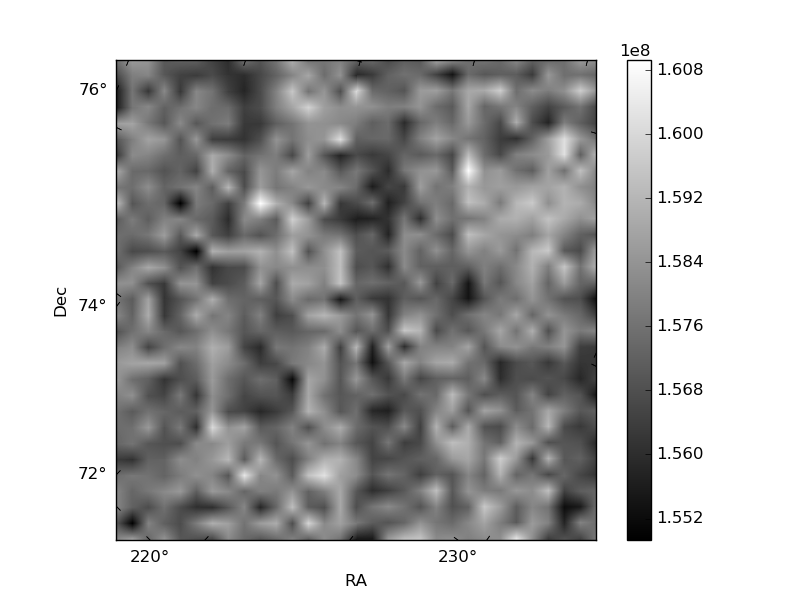
Histogram calculated using DETX and DETY for each event in the final _common_clean file
| Quadrant A | 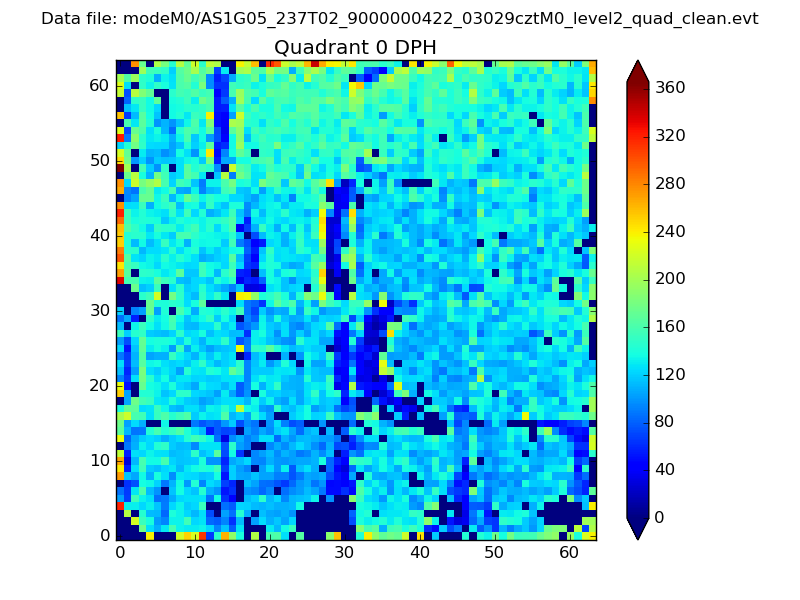 |
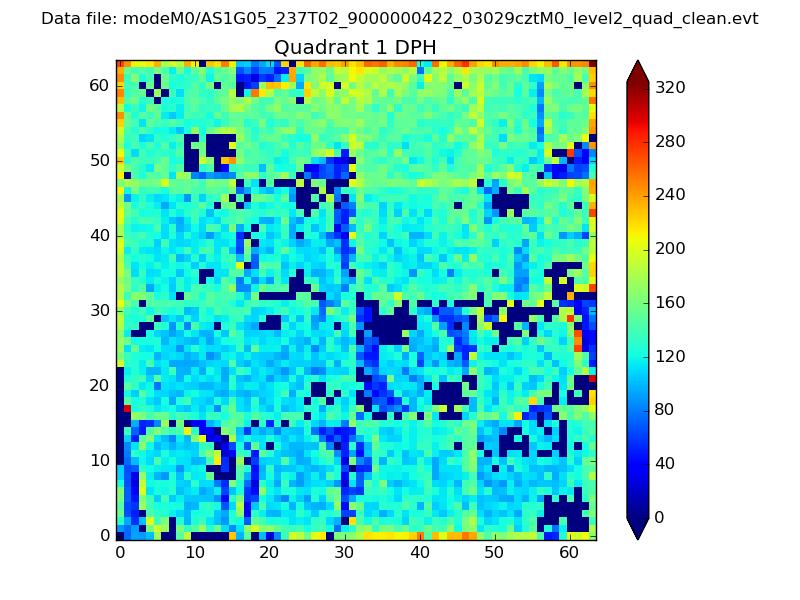 |
Quadrant B |
|---|---|---|---|
| Quadrant D | 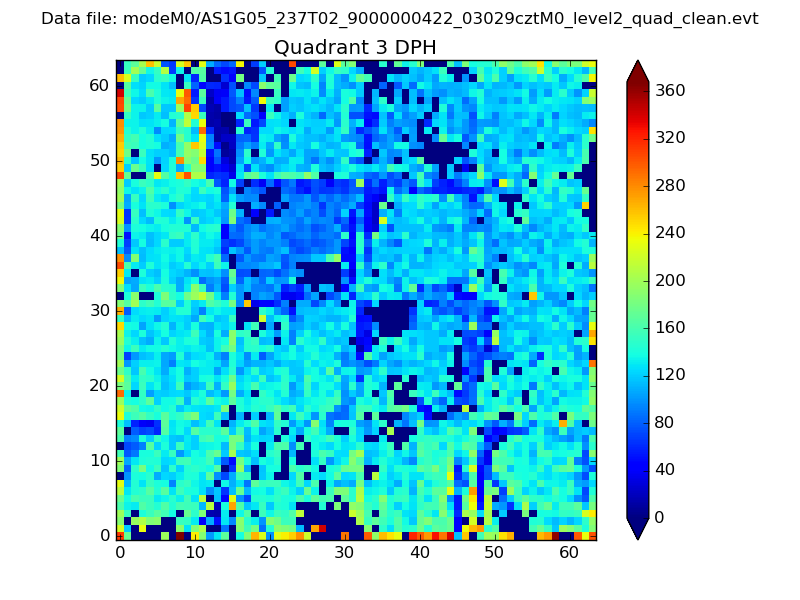 |
 |
Quadrant C |
| Plot type | Count rate plots | Images |
|---|---|---|
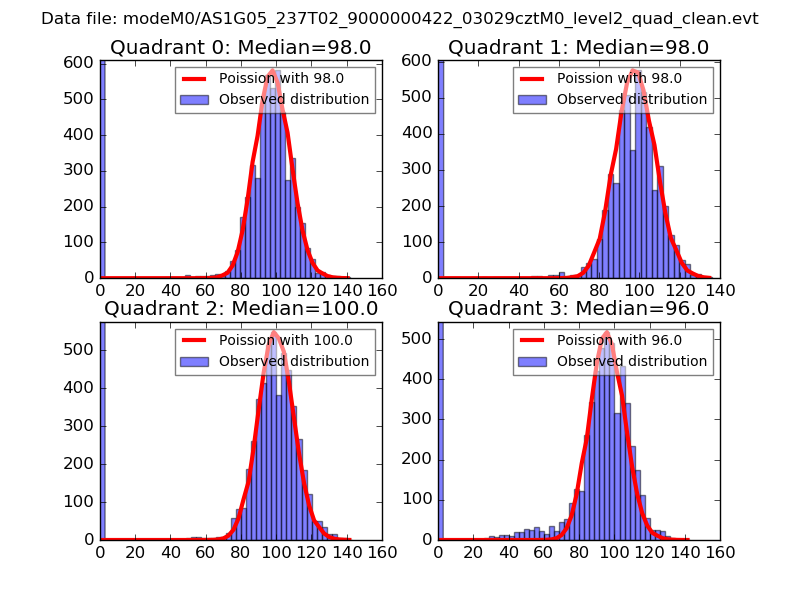
| Comparison with Poisson distribution Blue bars denote a histogram of data divided into 1 sec bins. Red curve is a Poisson curve with rate = median count rate of data. |
 |
 |
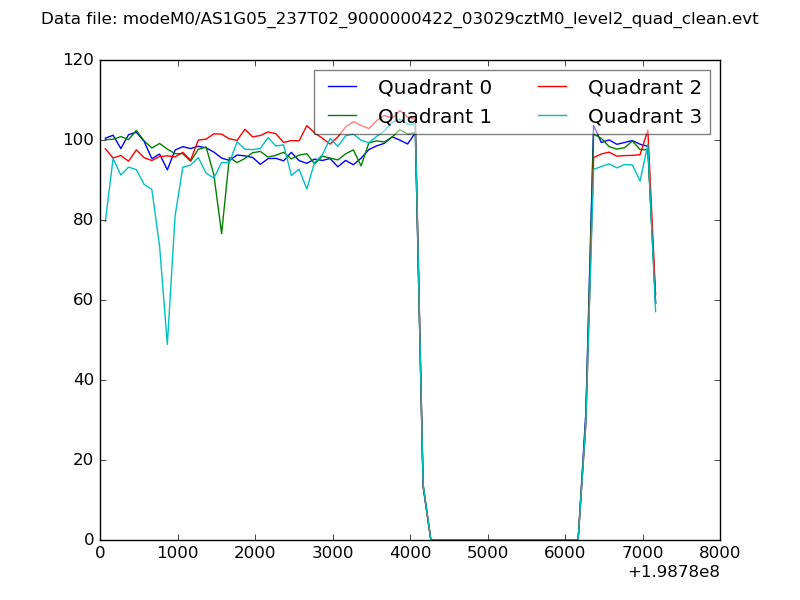
| Quadrant-wise count rates Data is divided into 100 sec bins |
 |
|
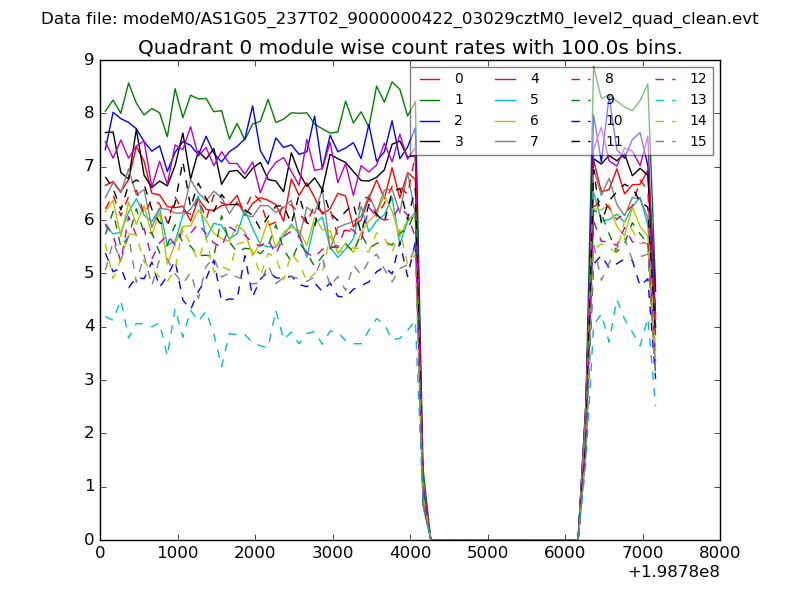
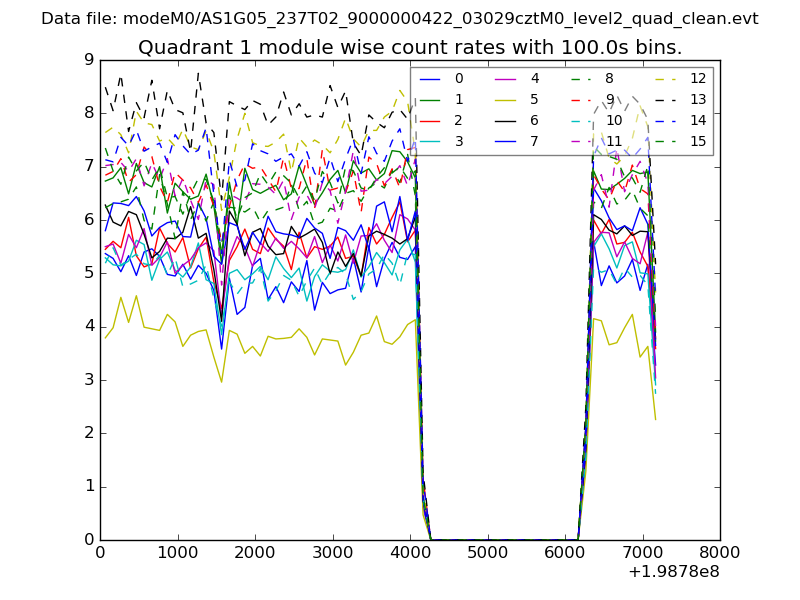
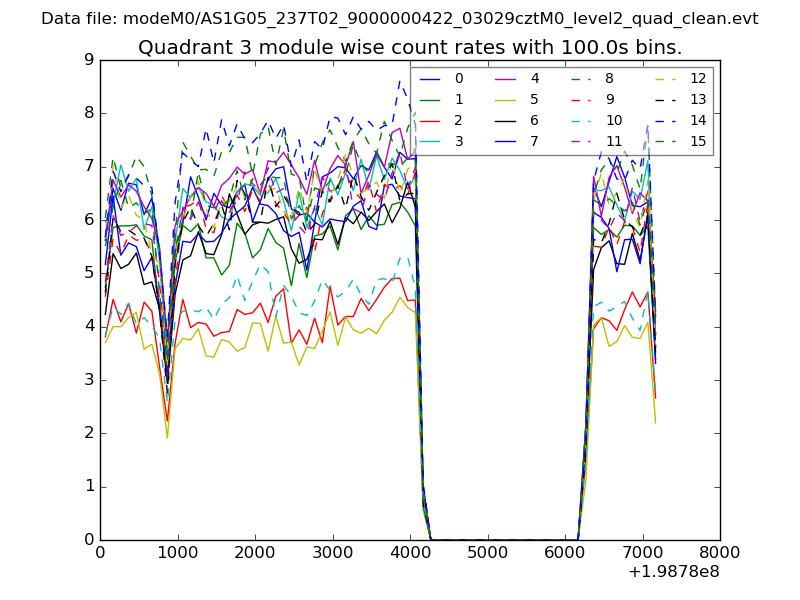
| Module-wise count rates for Quadrant A Data is divided into 100 sec bins |
 |
 |
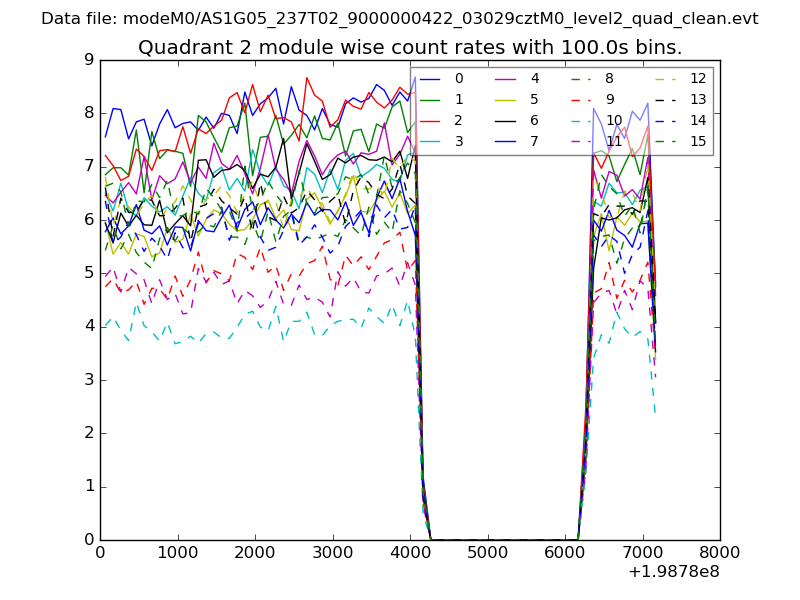
| Module-wise count rates for Quadrant B Data is divided into 100 sec bins |
 |
 |
| Module-wise count rates for Quadrant C Data is divided into 100 sec bins |
 |
 |
| Module-wise count rates for Quadrant D Data is divided into 100 sec bins |
 |
 |
| Parameter | Plot |
|---|---|
| CZT HV Monitor | 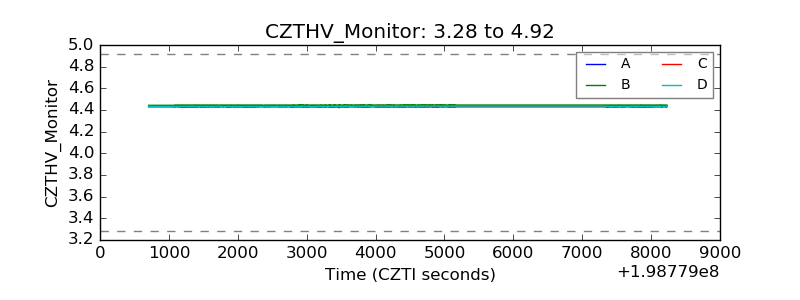 |
| D_VDD | 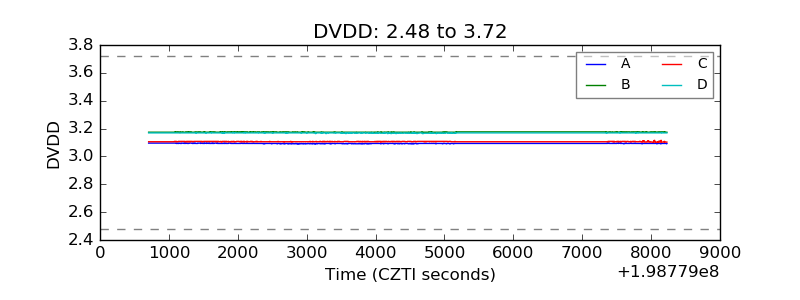 |
| Temperature 1 | 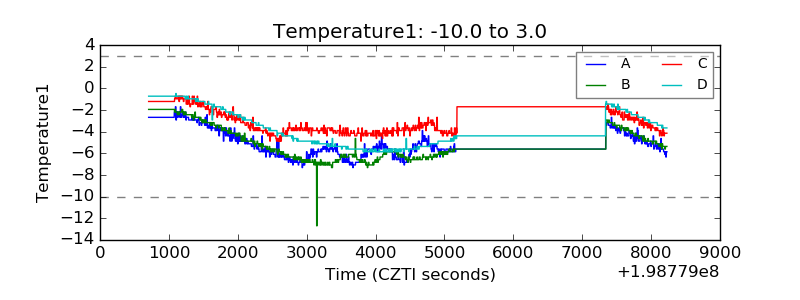 |
| Veto HV Monitor | 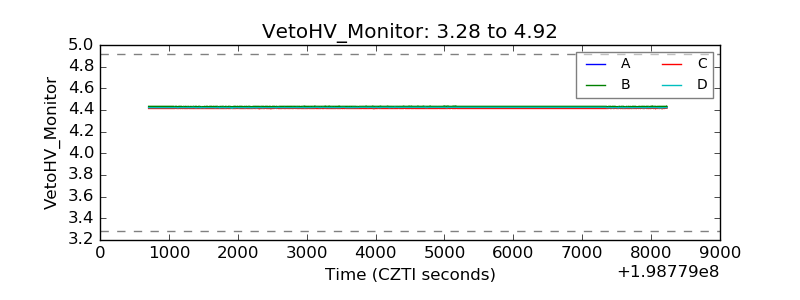 |
| Veto LLD | 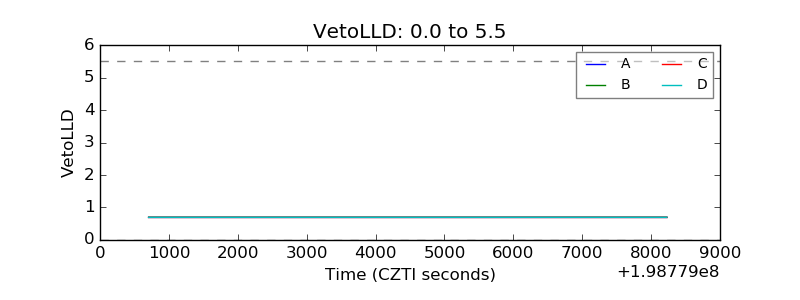 |
| Alpha Counter | 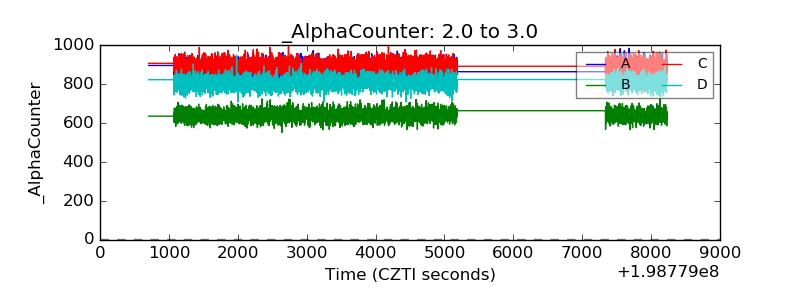 |
| _CPM_Rate | 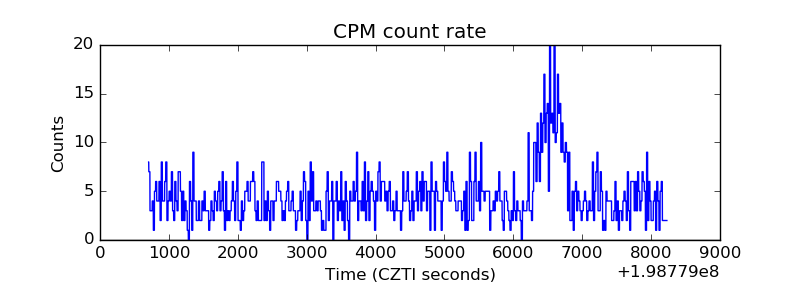 |
| CZT Counter | 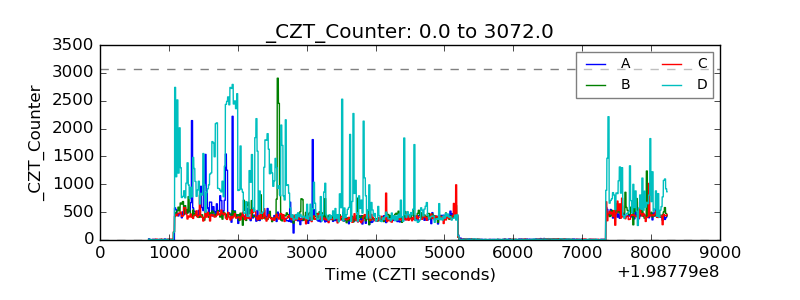 |
| +2.5 Volts monitor |  |
| +5 Volts monitor |  |
| _ROLL_ROT | 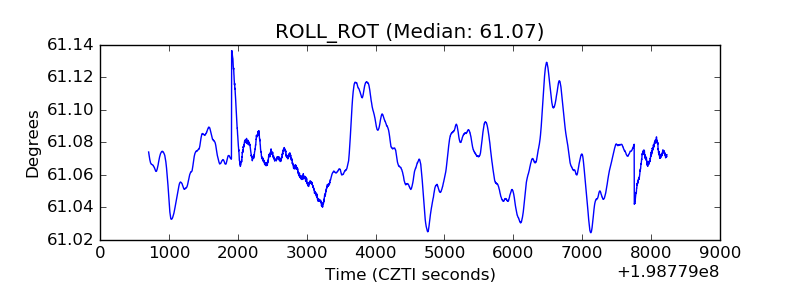 |
| _Roll_DEC | 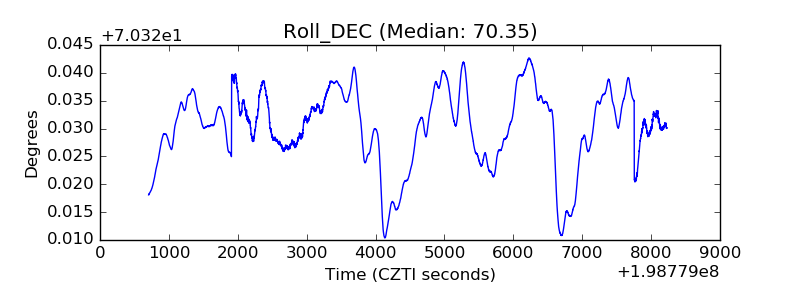 |
| _Roll_RA | 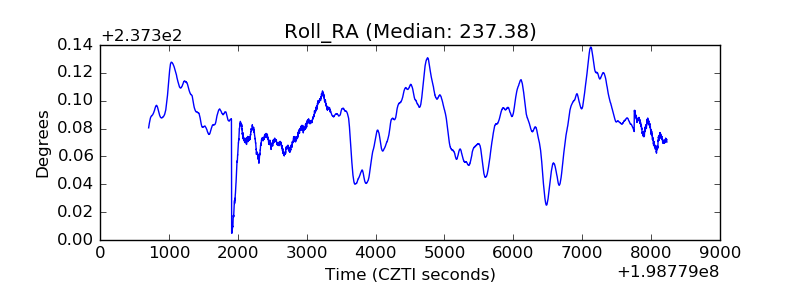 |
| Veto Counter | 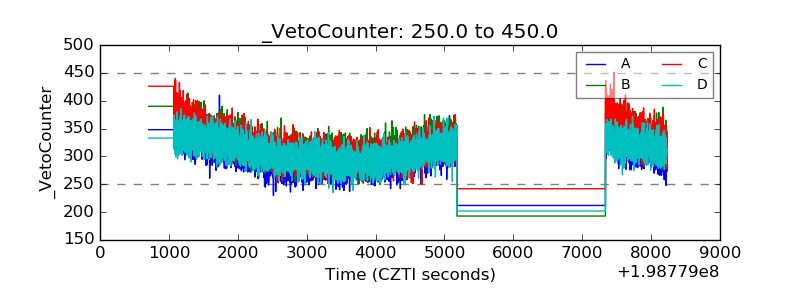 |