| Param | Original file | Final file |
|---|---|---|
| Filename | modeM0/AS1G05_237T02_9000000422_03031cztM0_level2.evt | modeM0/AS1G05_237T02_9000000422_03031cztM0_level2_quad_clean.evt |
| Size (bytes) | 338,143,680 | 78,045,120 |
| Size | 322.5 MB | 74.4 MB |
| Events in quadrant A | 2,209,899 | 490,160 |
| Events in quadrant B | 2,520,500 | 494,622 |
| Events in quadrant C | 2,157,081 | 519,283 |
| Events in quadrant D | 3,003,721 | 499,951 |
| Mode SS | |||
|---|---|---|---|
| Quadrant | BADHDUFLAG | Total packets | Discarded packets |
| A | 0 | 104 | 0 |
| B | 0 | 104 | 0 |
| C | 0 | 104 | 0 |
| D | 0 | 104 | 0 |
| Mode M9 | |||
|---|---|---|---|
| Quadrant | BADHDUFLAG | Total packets | Discarded packets |
| A | 0 | 37 | 0 |
| B | 0 | 37 | 0 |
| C | 0 | 37 | 0 |
| D | 0 | 38 | 0 |
| Mode M0 | |||
|---|---|---|---|
| Quadrant | BADHDUFLAG | Total packets | Discarded packets |
| A | 0 | 10476 | 3 |
| B | 0 | 10981 | 2 |
| C | 0 | 10479 | 2 |
| D | 0 | 12985 | 2 |
| Quadrant | Total seconds | Saturated seconds | Saturation percentage |
|---|---|---|---|
| A | 5129 | 2 | 0.038994% |
| B | 5129 | 39 | 0.760382% |
| C | 5129 | 14 | 0.272958% |
| D | 5129 | 104 | 2.027686% |
Noise dominated data is calculated using 1-second bins in cleaned event files. If a bin has >2000 counts, and if more than 50% of those come from <1% of pixels, then it is considered to be noise-dominated and hence unusable.
| Quadrant | # 1 sec bins | Bins with >0 counts | Bins with >2000 counts | High rate bins dominated by noise | Noise dominated (total time) | Noise dominated (detector-on time) | Marked lightcurve |
|---|---|---|---|---|---|---|---|
| A | 7254 | 5130 | 0 | 0 | 0.00% | 0.00% | 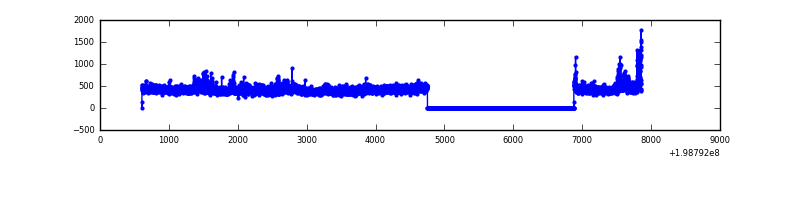 |
| B | 7254 | 5130 | 24 | 24 | 0.33% | 0.47% | 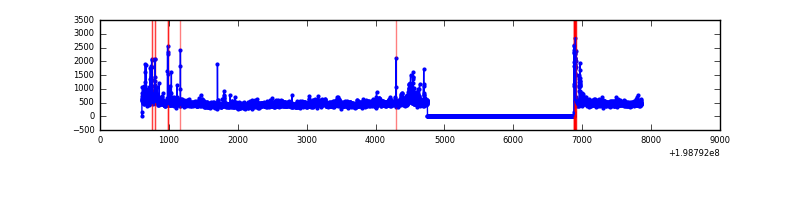 |
| C | 7254 | 5130 | 12 | 12 | 0.17% | 0.23% | 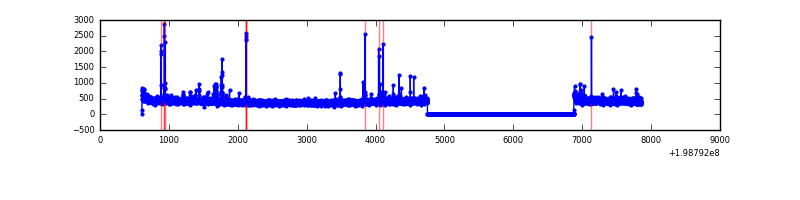 |
| D | 7254 | 5130 | 114 | 114 | 1.57% | 2.22% | 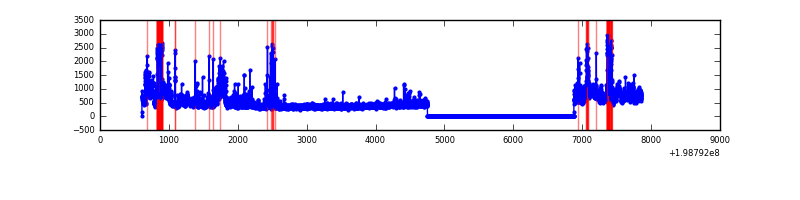 |
Top three noisy pixels from each quadrant. If the there are fewer than three noisy pixels in the level2.evt file, extra rows are filled as -1
| Pixel properties | Quadrant properties | ||||||
|---|---|---|---|---|---|---|---|
| Quadrant | DetID | PixID | Counts | Sigma | Mean | Median | Sigma |
| A | 0 | 50 | 167459 | 1563.57 | 519 | 508 | 106.8 |
| A | 13 | 251 | 12767 | 114.81 | 519 | 508 | 106.8 |
| A | 3 | 1 | 11945 | 107.11 | 519 | 508 | 106.8 |
| B | 15 | 204 | 234651 | 2298.9 | 532 | 518 | 101.8 |
| B | 2 | 249 | 62093 | 604.59 | 532 | 518 | 101.8 |
| B | 0 | 230 | 56235 | 547.07 | 532 | 518 | 101.8 |
| C | 6 | 80 | 89459 | 742.56 | 519 | 522 | 119.8 |
| C | 1 | 16 | 9717 | 76.77 | 519 | 522 | 119.8 |
| C | 5 | 96 | 5850 | 44.48 | 519 | 522 | 119.8 |
| D | 13 | 114 | 646860 | 4944.16 | 505 | 493 | 130.7 |
| D | 2 | 152 | 150481 | 1147.28 | 505 | 493 | 130.7 |
| D | 10 | 237 | 65309 | 495.79 | 505 | 493 | 130.7 |
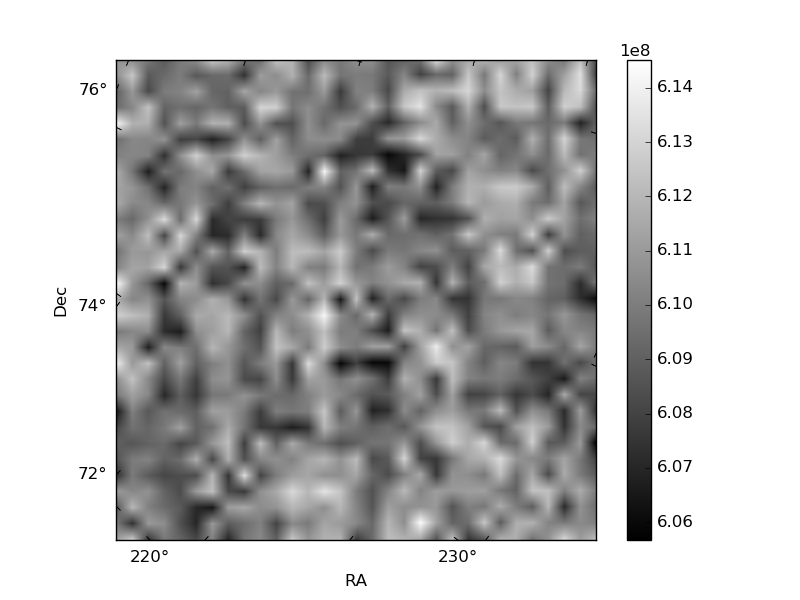
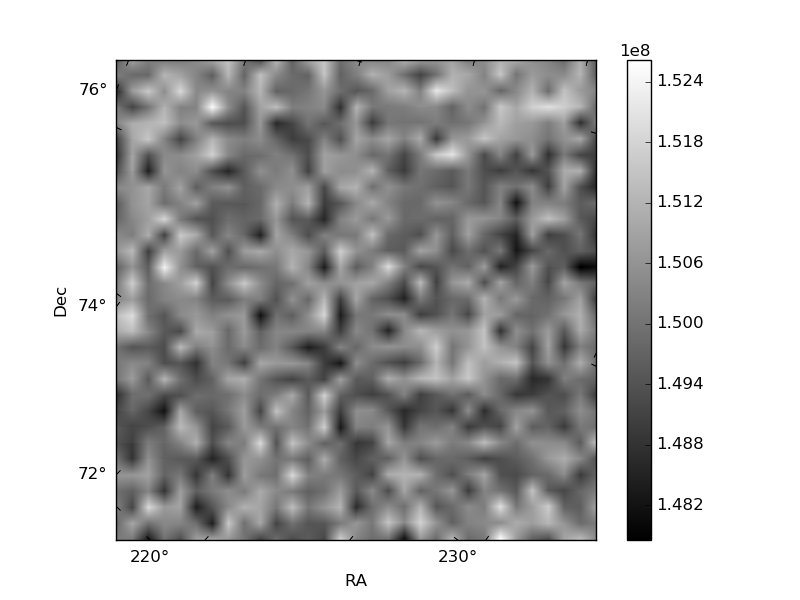
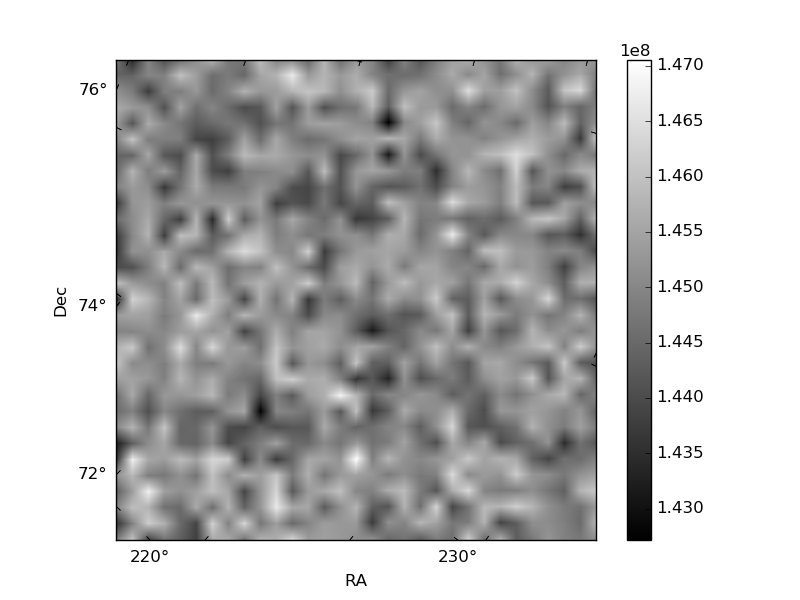
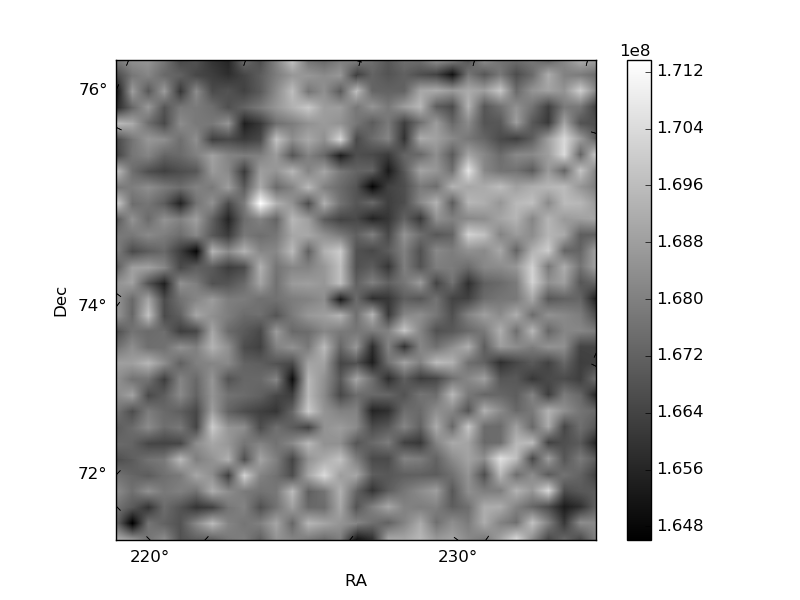
Histogram calculated using DETX and DETY for each event in the final _common_clean file
| Quadrant A | 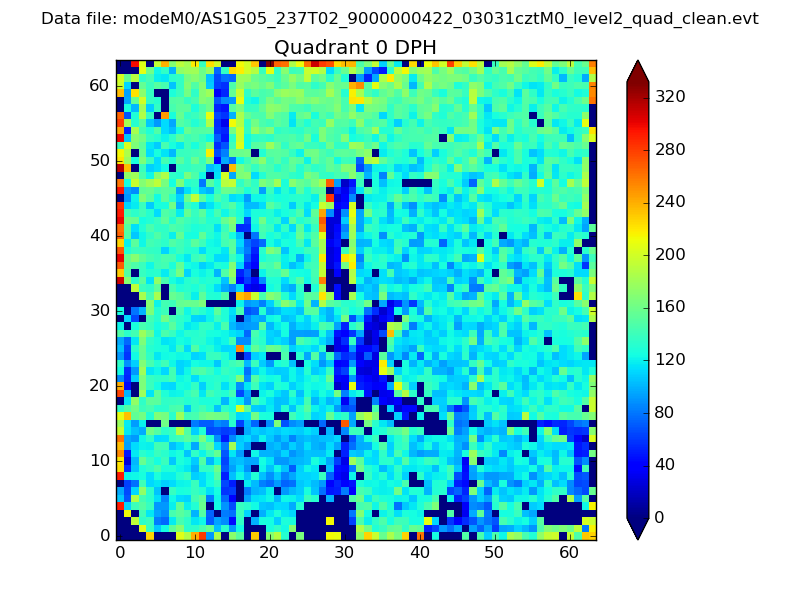 |
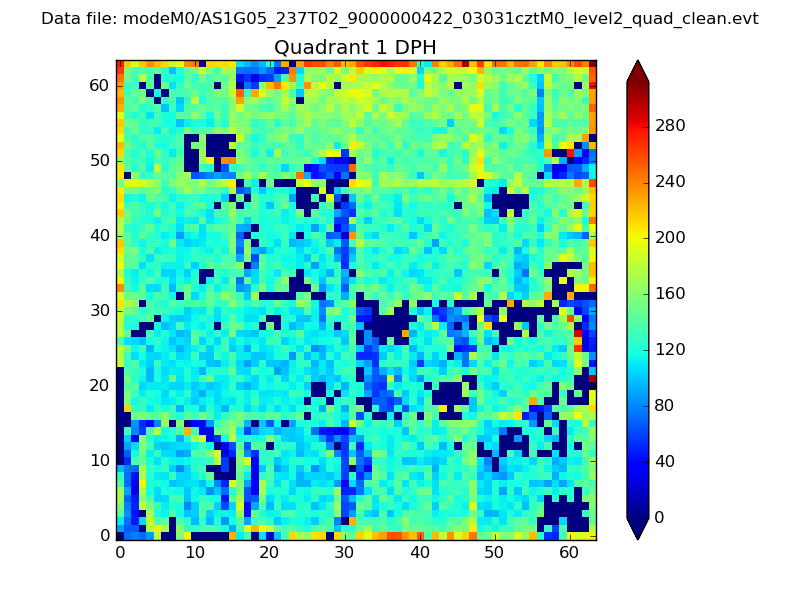 |
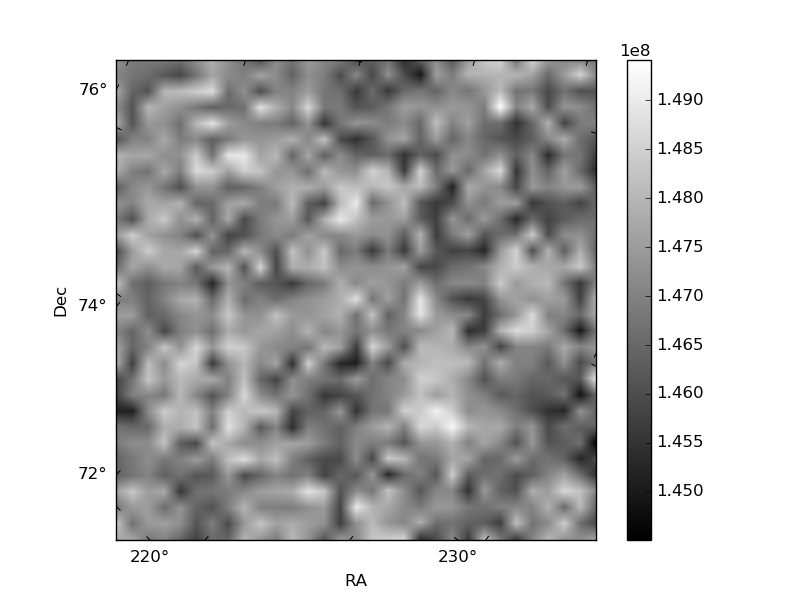
Quadrant B |
|---|---|---|---|
| Quadrant D | 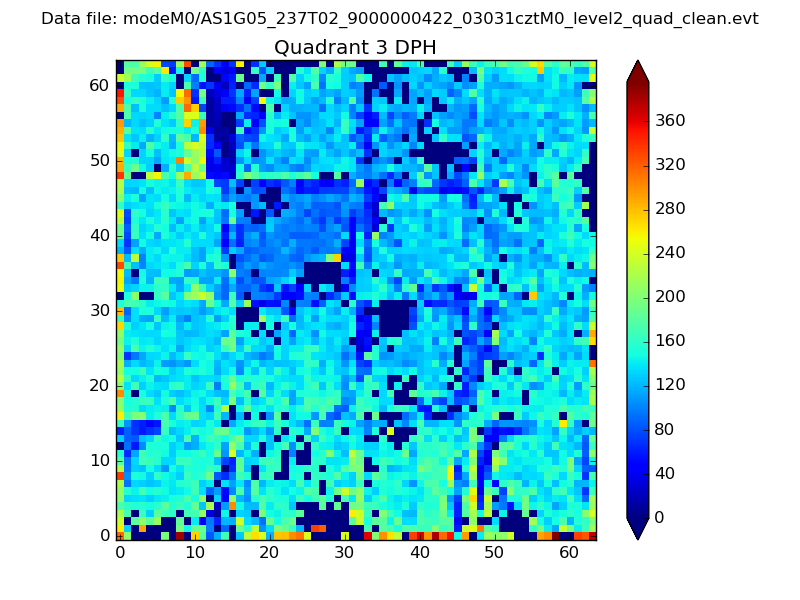 |
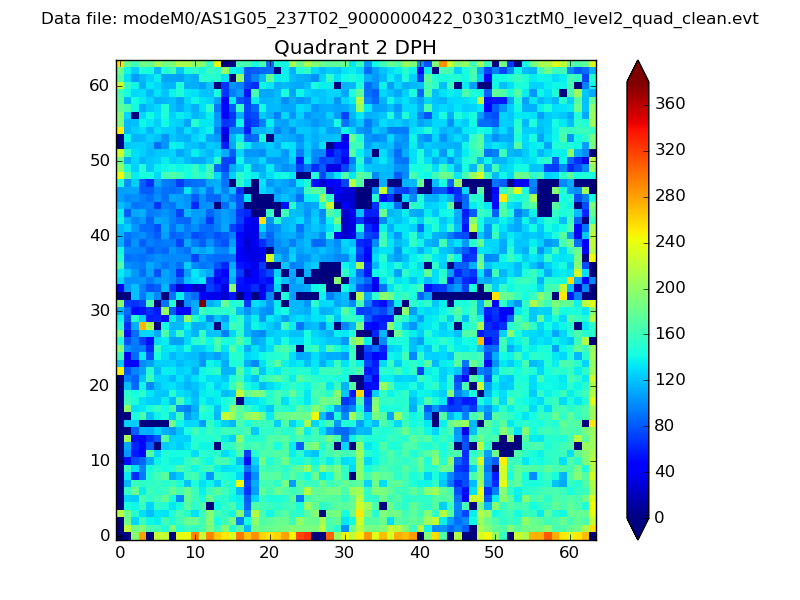 |
Quadrant C |
| Plot type | Count rate plots | Images |
|---|---|---|
| Comparison with Poisson distribution Blue bars denote a histogram of data divided into 1 sec bins. Red curve is a Poisson curve with rate = median count rate of data. |
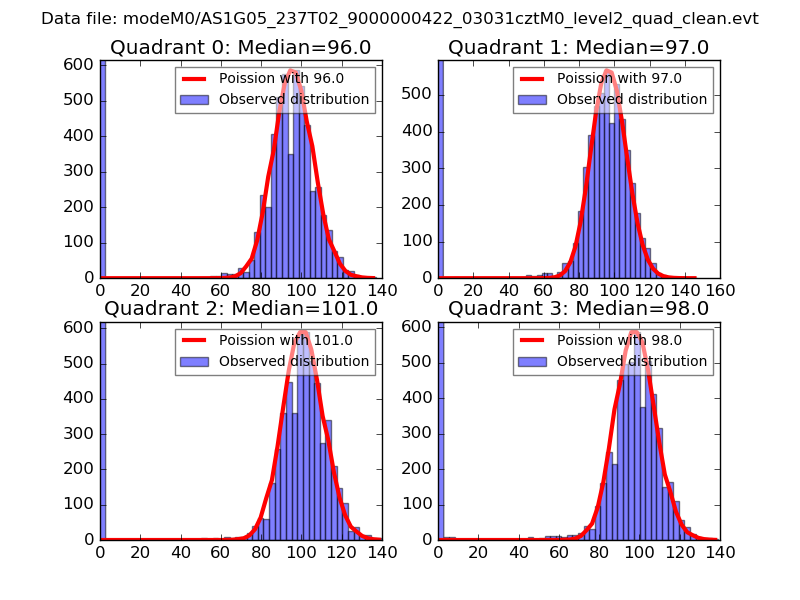 |
 |
| Quadrant-wise count rates Data is divided into 100 sec bins |
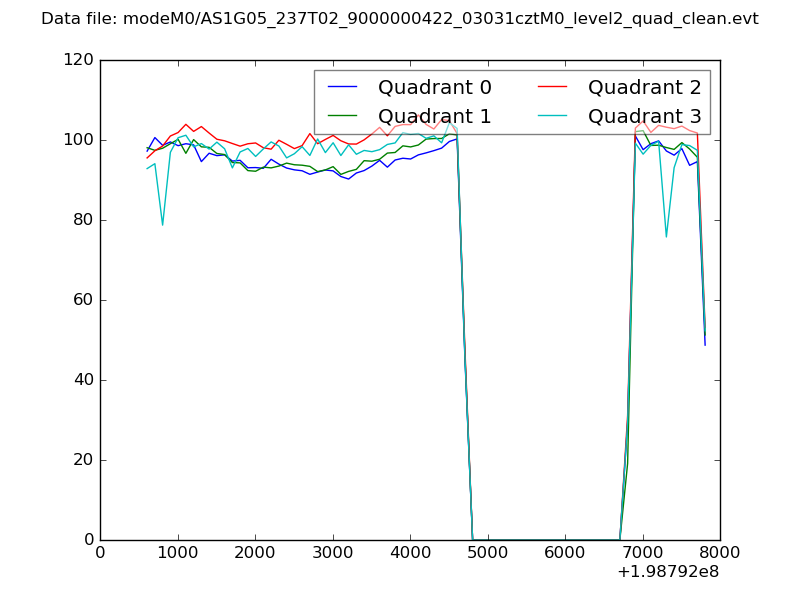 |
|
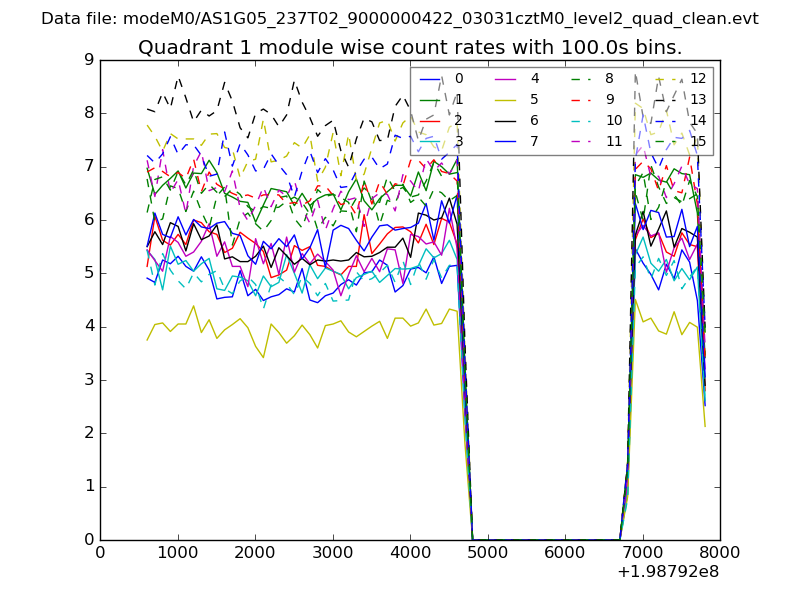
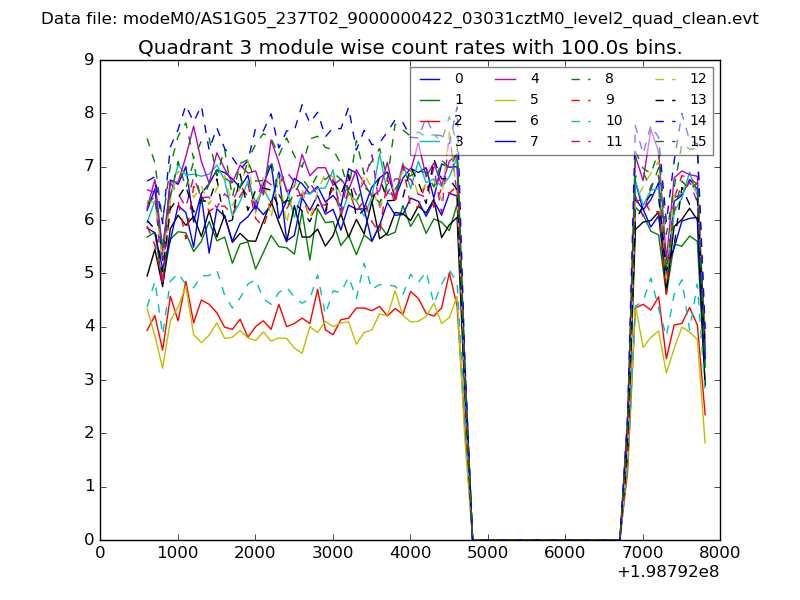
| Module-wise count rates for Quadrant A Data is divided into 100 sec bins |
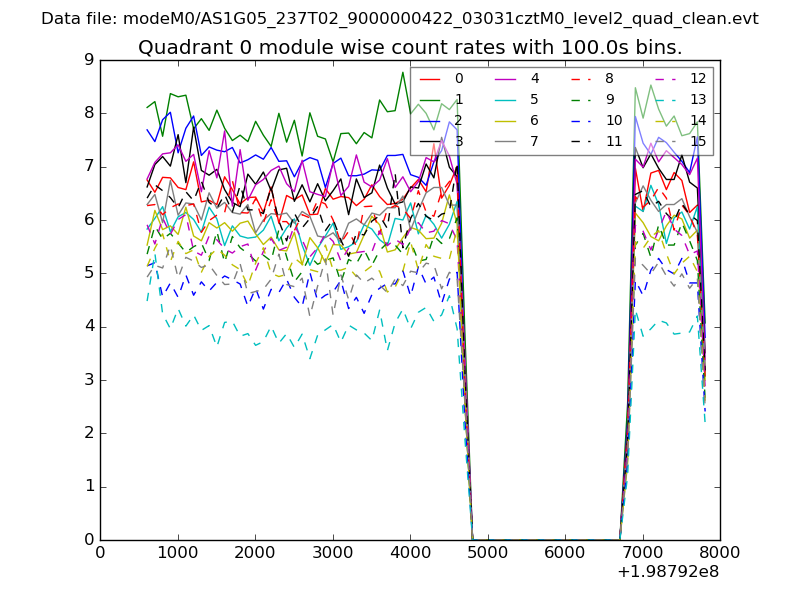 |
 |
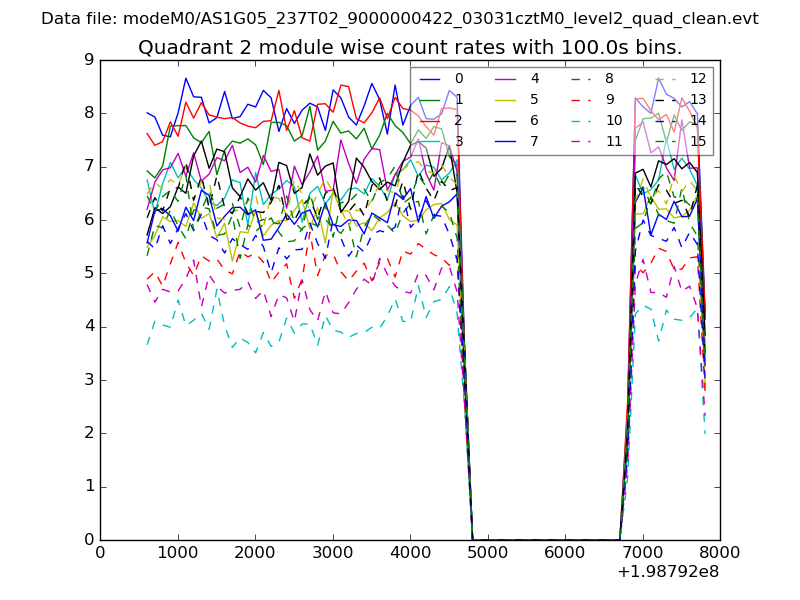
| Module-wise count rates for Quadrant B Data is divided into 100 sec bins |
 |
 |
| Module-wise count rates for Quadrant C Data is divided into 100 sec bins |
 |
 |
| Module-wise count rates for Quadrant D Data is divided into 100 sec bins |
 |
 |
| Parameter | Plot |
|---|---|
| CZT HV Monitor | 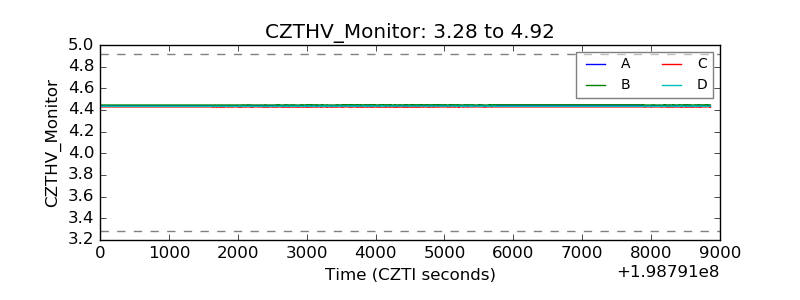 |
| D_VDD | 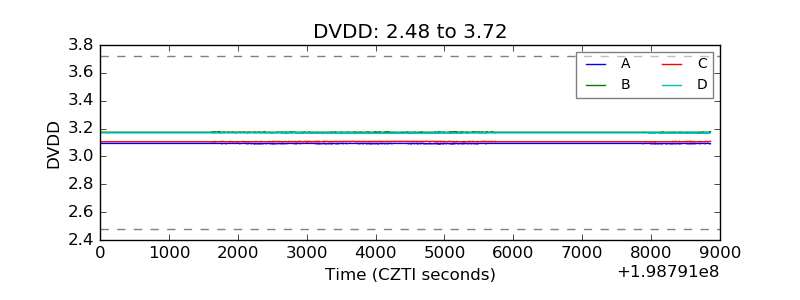 |
| Temperature 1 | 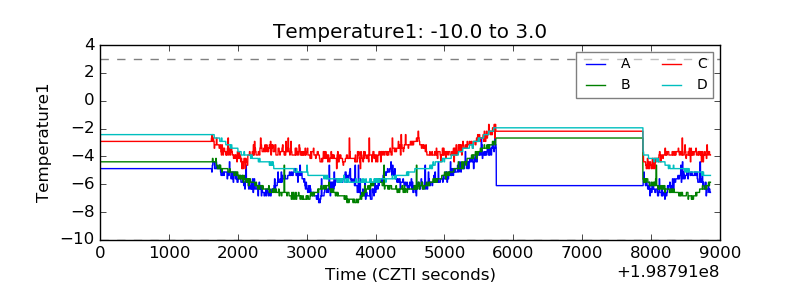 |
| Veto HV Monitor | 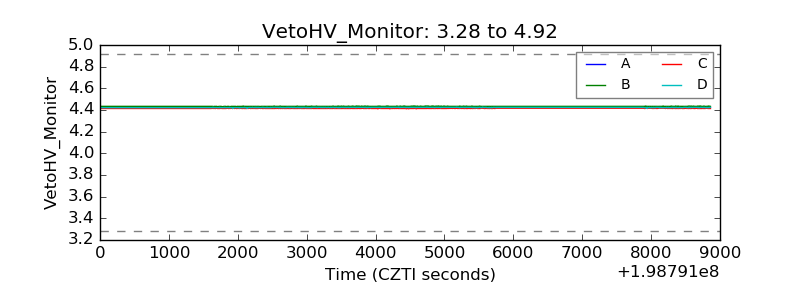 |
| Veto LLD | 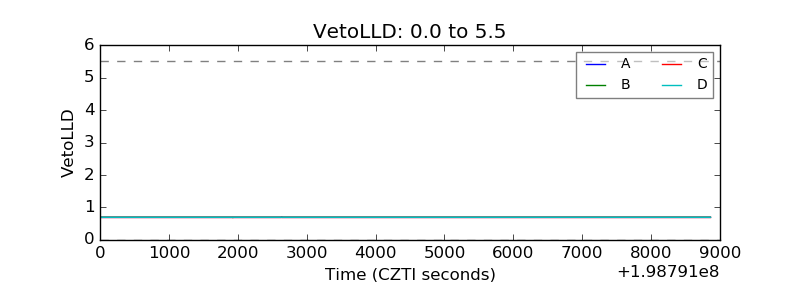 |
| Alpha Counter | 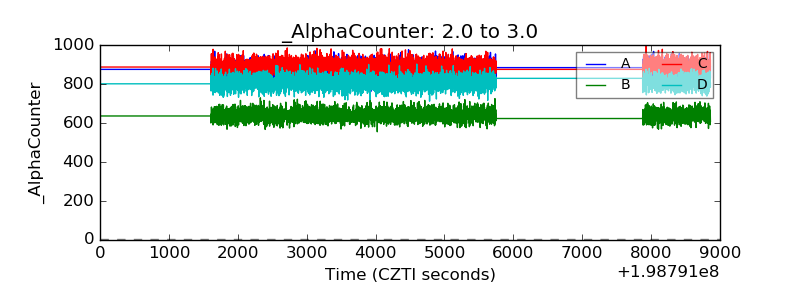 |
| _CPM_Rate | 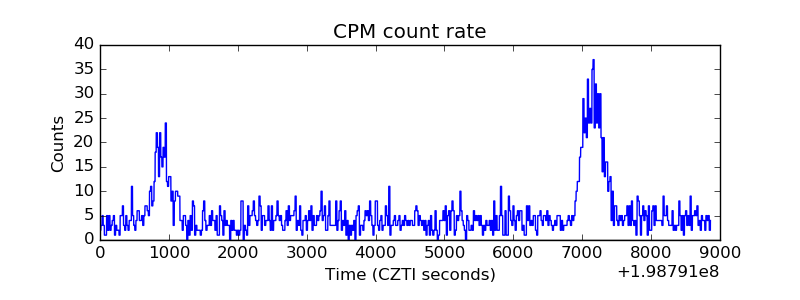 |
| CZT Counter | 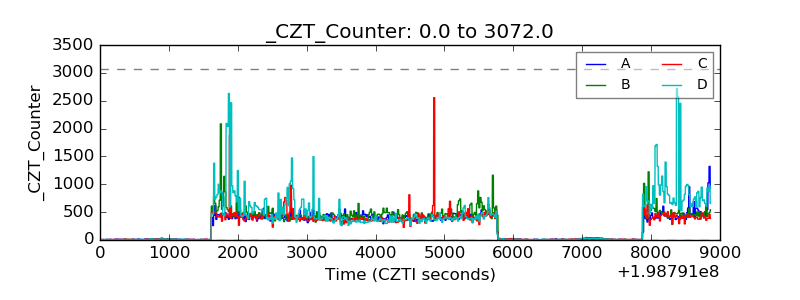 |
| +2.5 Volts monitor |  |
| +5 Volts monitor |  |
| _ROLL_ROT | 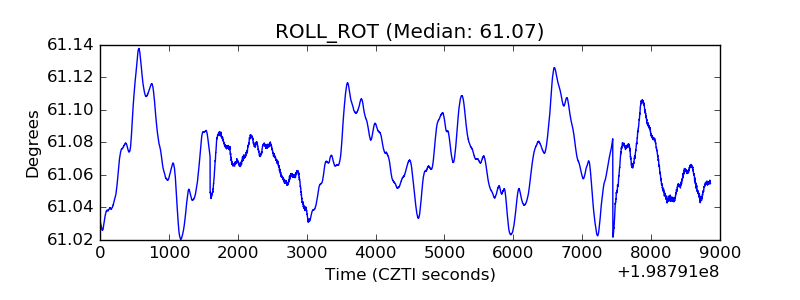 |
| _Roll_DEC | 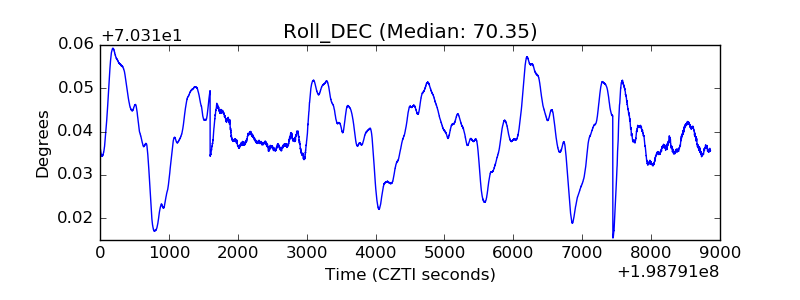 |
| _Roll_RA | 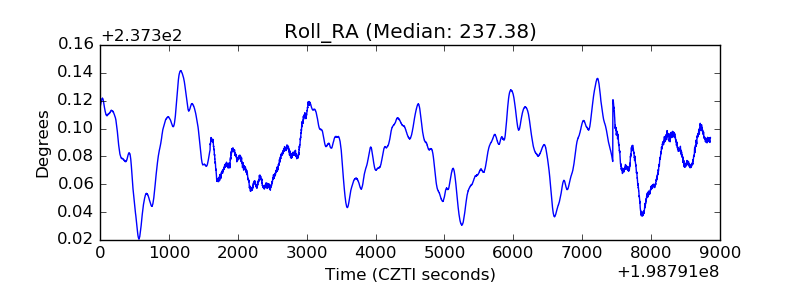 |
| Veto Counter | 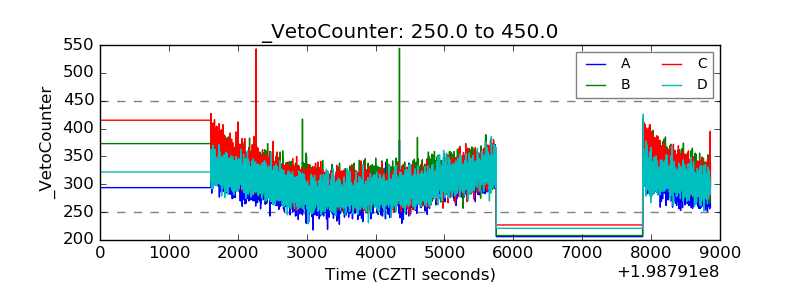 |