| Param | Original file | Final file |
|---|---|---|
| Filename | modeM0/AS1G05_237T02_9000000422_03033cztM0_level2.evt | modeM0/AS1G05_237T02_9000000422_03033cztM0_level2_quad_clean.evt |
| Size (bytes) | 636,667,200 | 141,445,440 |
| Size | 607.2 MB | 134.9 MB |
| Events in quadrant A | 4,594,541 | 886,177 |
| Events in quadrant B | 4,810,372 | 898,746 |
| Events in quadrant C | 3,983,245 | 940,123 |
| Events in quadrant D | 5,255,606 | 906,627 |
| Mode SS | |||
|---|---|---|---|
| Quadrant | BADHDUFLAG | Total packets | Discarded packets |
| A | 0 | 192 | 0 |
| B | 0 | 192 | 0 |
| C | 0 | 192 | 0 |
| D | 0 | 192 | 0 |
| Mode M9 | |||
|---|---|---|---|
| Quadrant | BADHDUFLAG | Total packets | Discarded packets |
| A | 0 | 62 | 0 |
| B | 0 | 62 | 0 |
| C | 0 | 62 | 0 |
| D | 0 | 63 | 0 |
| Mode M0 | |||
|---|---|---|---|
| Quadrant | BADHDUFLAG | Total packets | Discarded packets |
| A | 0 | 20642 | 4 |
| B | 0 | 21006 | 3 |
| C | 0 | 19363 | 3 |
| D | 0 | 23200 | 3 |
| Quadrant | Total seconds | Saturated seconds | Saturation percentage |
|---|---|---|---|
| A | 9405 | 16 | 0.170122% |
| B | 9405 | 46 | 0.489102% |
| C | 9405 | 13 | 0.138224% |
| D | 9405 | 203 | 2.158426% |
Noise dominated data is calculated using 1-second bins in cleaned event files. If a bin has >2000 counts, and if more than 50% of those come from <1% of pixels, then it is considered to be noise-dominated and hence unusable.
| Quadrant | # 1 sec bins | Bins with >0 counts | Bins with >2000 counts | High rate bins dominated by noise | Noise dominated (total time) | Noise dominated (detector-on time) | Marked lightcurve |
|---|---|---|---|---|---|---|---|
| A | 13654 | 9407 | 6 | 6 | 0.04% | 0.06% | 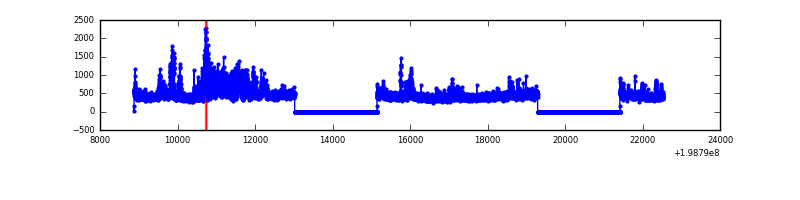 |
| B | 13654 | 9407 | 21 | 21 | 0.15% | 0.22% | 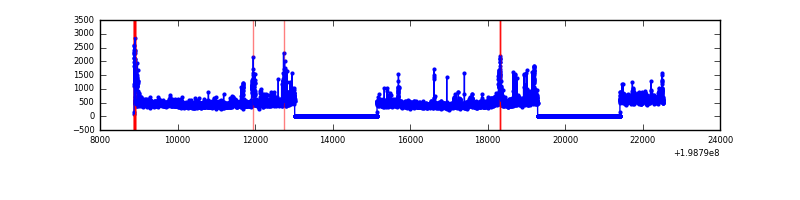 |
| C | 13654 | 9407 | 8 | 8 | 0.06% | 0.09% | 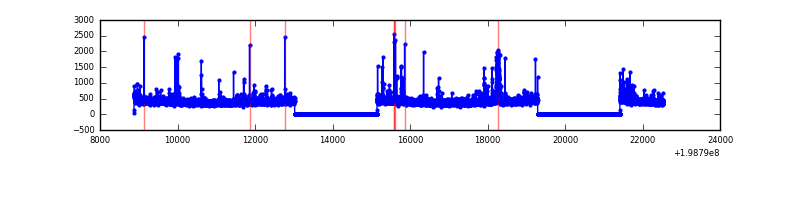 |
| D | 13654 | 9407 | 210 | 210 | 1.54% | 2.23% | 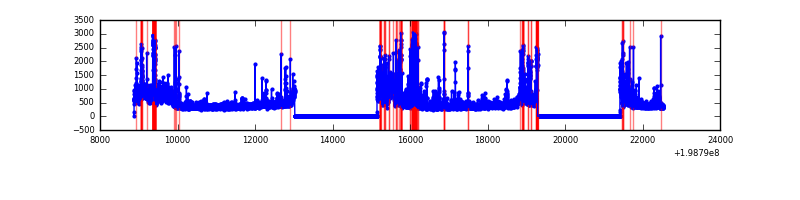 |
Top three noisy pixels from each quadrant. If the there are fewer than three noisy pixels in the level2.evt file, extra rows are filled as -1
| Pixel properties | Quadrant properties | ||||||
|---|---|---|---|---|---|---|---|
| Quadrant | DetID | PixID | Counts | Sigma | Mean | Median | Sigma |
| A | 0 | 50 | 848955 | 4345.91 | 955 | 934 | 195.1 |
| A | 14 | 249 | 24694 | 121.76 | 955 | 934 | 195.1 |
| A | 13 | 251 | 19301 | 94.13 | 955 | 934 | 195.1 |
| B | 15 | 204 | 624868 | 3325.57 | 977 | 954 | 187.6 |
| B | 0 | 230 | 215520 | 1143.67 | 977 | 954 | 187.6 |
| B | 2 | 249 | 75506 | 397.37 | 977 | 954 | 187.6 |
| C | 6 | 80 | 127780 | 584.4 | 942 | 946 | 217.0 |
| C | 0 | 219 | 91723 | 418.26 | 942 | 946 | 217.0 |
| C | 1 | 16 | 18551 | 81.12 | 942 | 946 | 217.0 |
| D | 13 | 114 | 868648 | 3872.11 | 919 | 894 | 224.1 |
| D | 7 | 80 | 317336 | 1412.03 | 919 | 894 | 224.1 |
| D | 2 | 152 | 175445 | 778.89 | 919 | 894 | 224.1 |
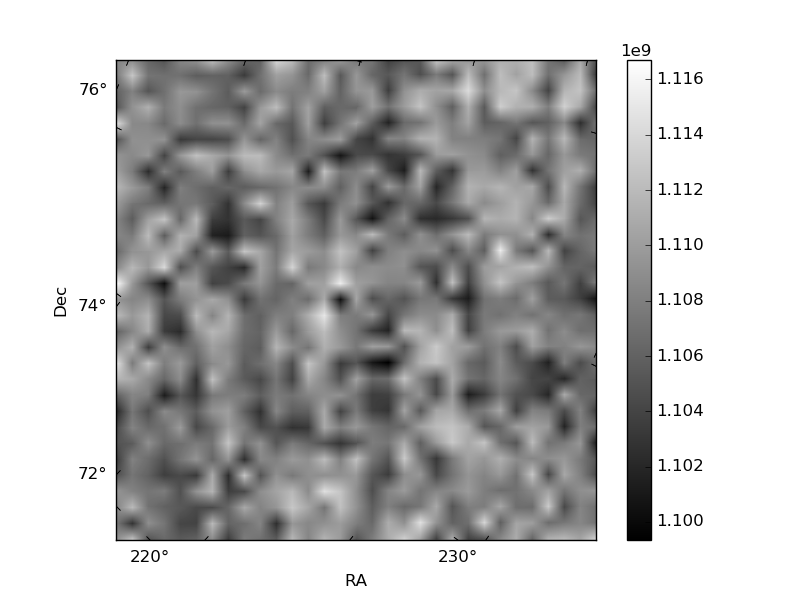
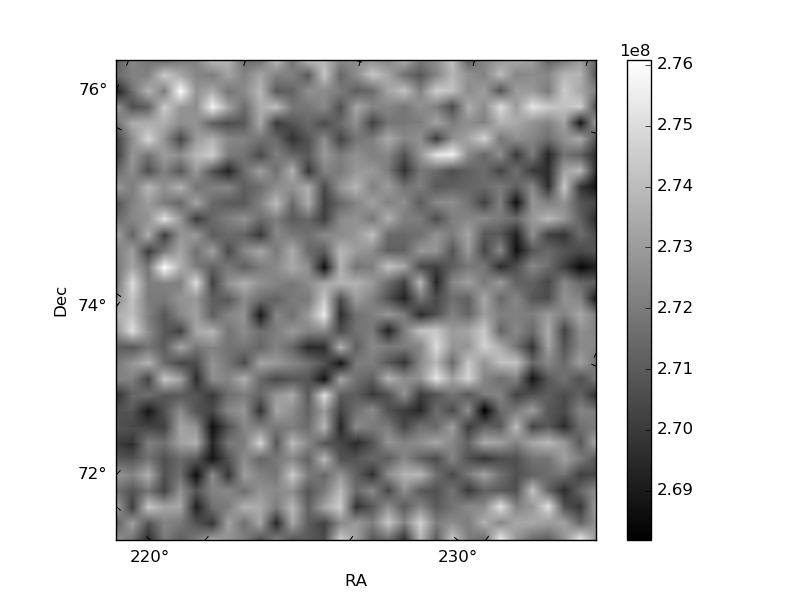
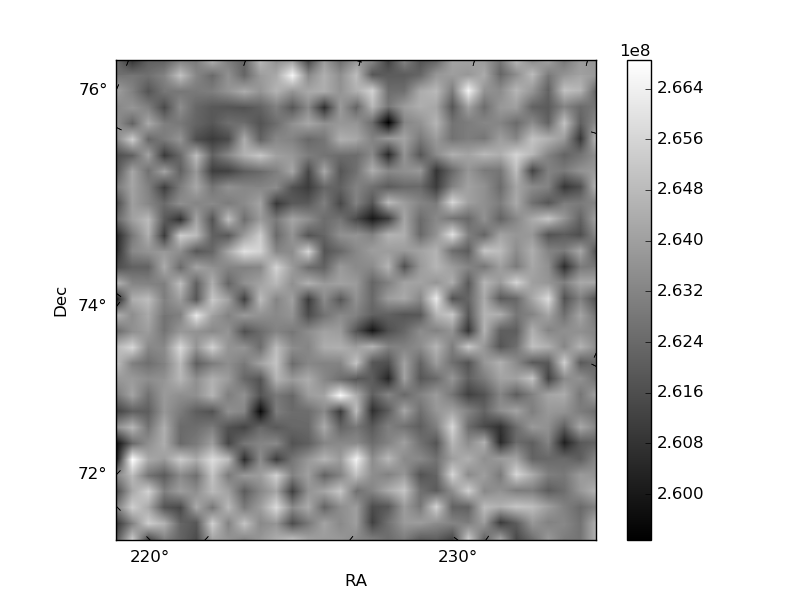
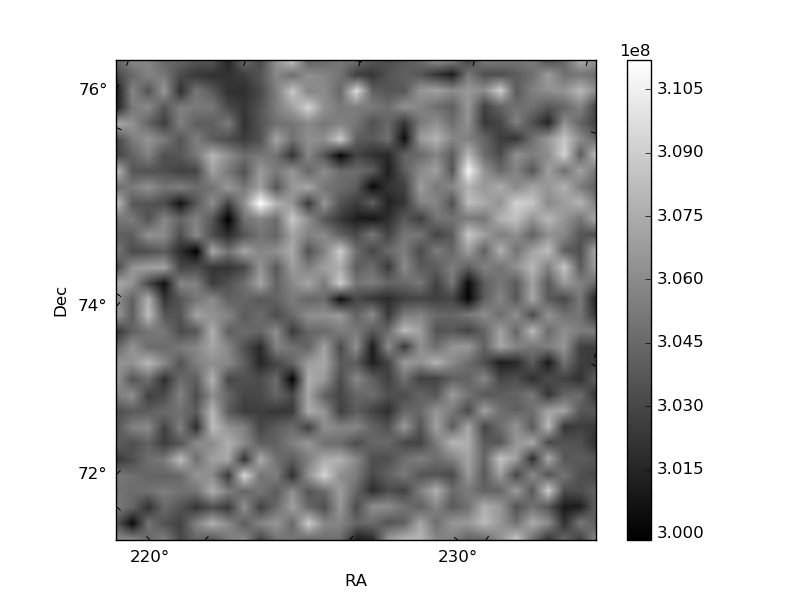
Histogram calculated using DETX and DETY for each event in the final _common_clean file
| Quadrant A | 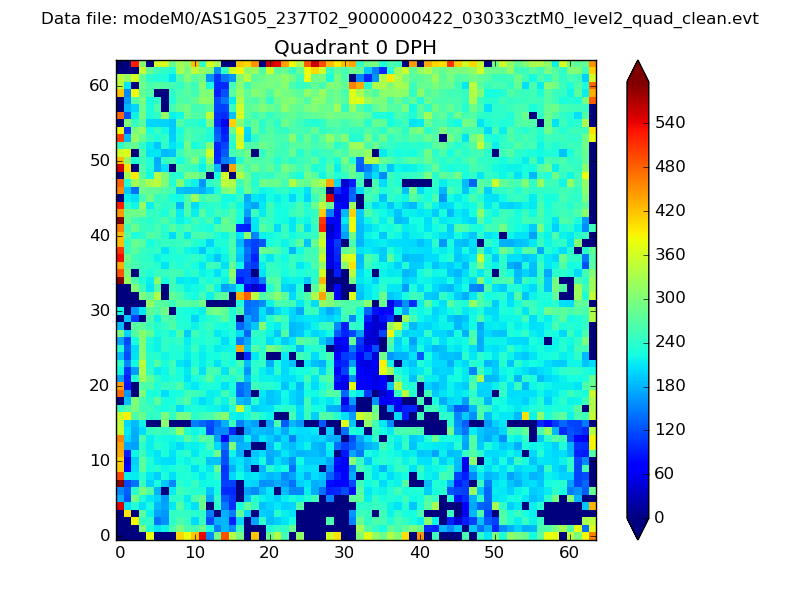 |
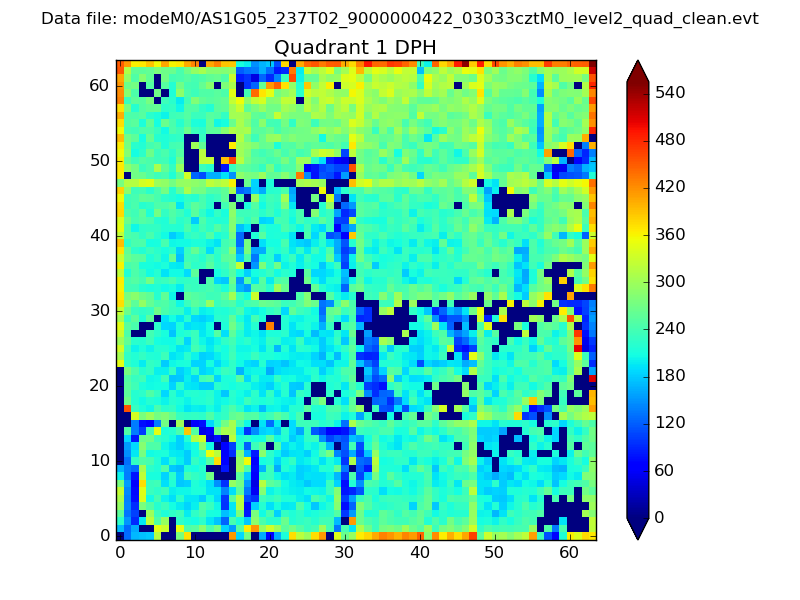 |
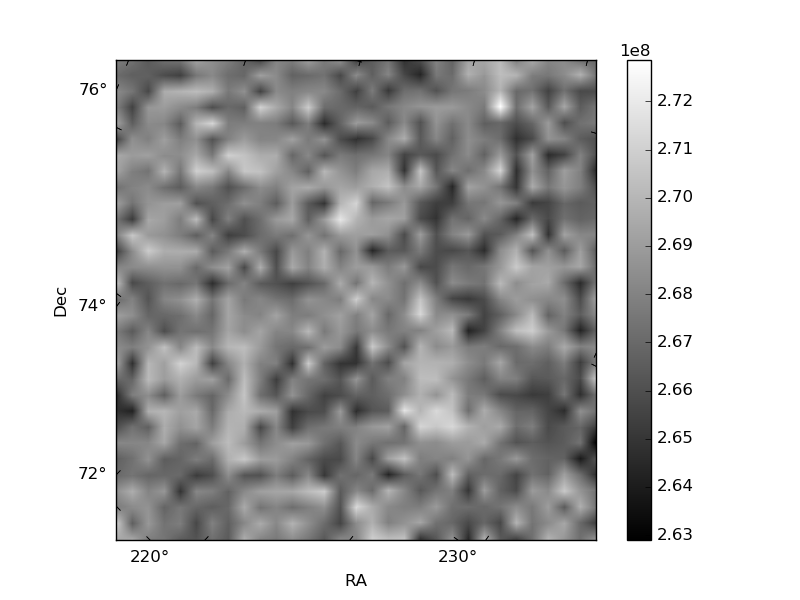
Quadrant B |
|---|---|---|---|
| Quadrant D | 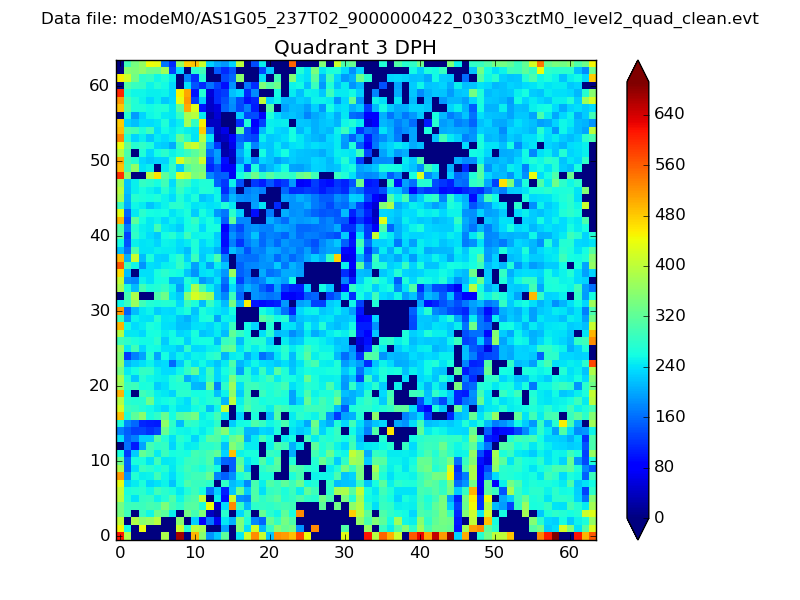 |
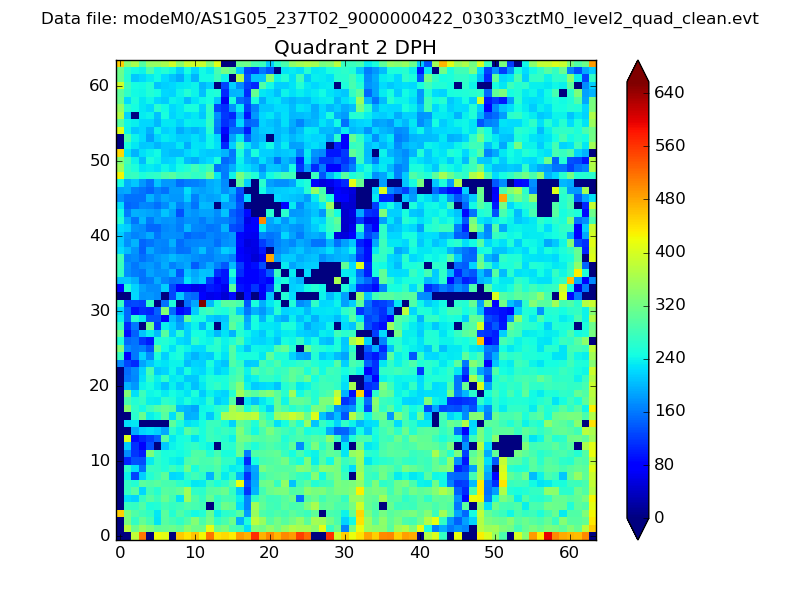 |
Quadrant C |
| Plot type | Count rate plots | Images |
|---|---|---|
| Comparison with Poisson distribution Blue bars denote a histogram of data divided into 1 sec bins. Red curve is a Poisson curve with rate = median count rate of data. |
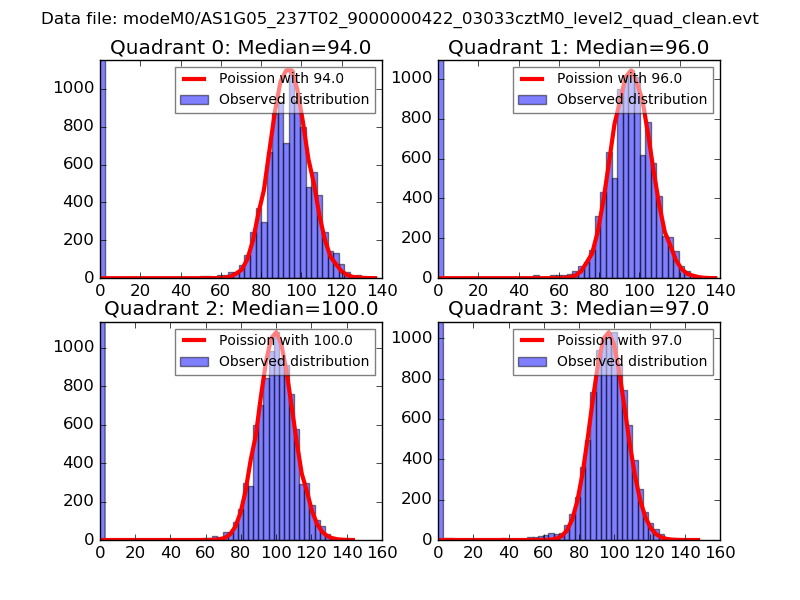 |
 |
| Quadrant-wise count rates Data is divided into 100 sec bins |
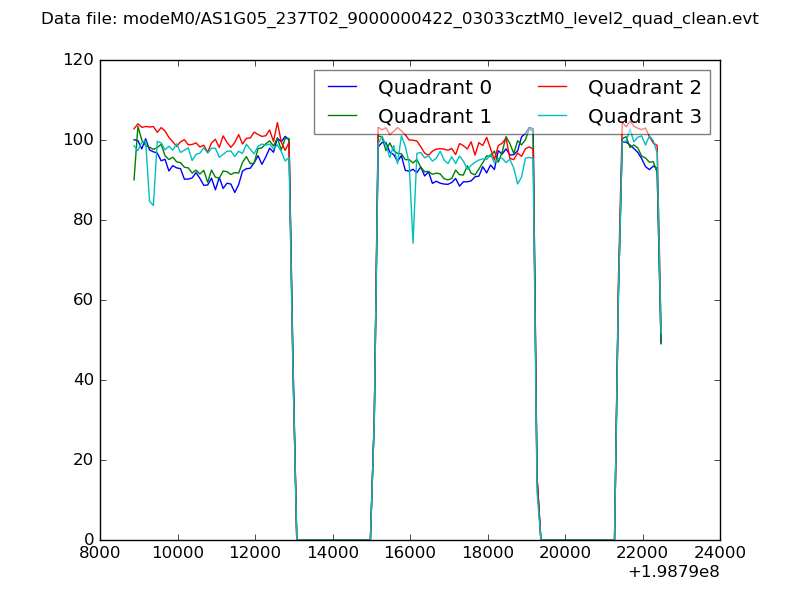 |
|
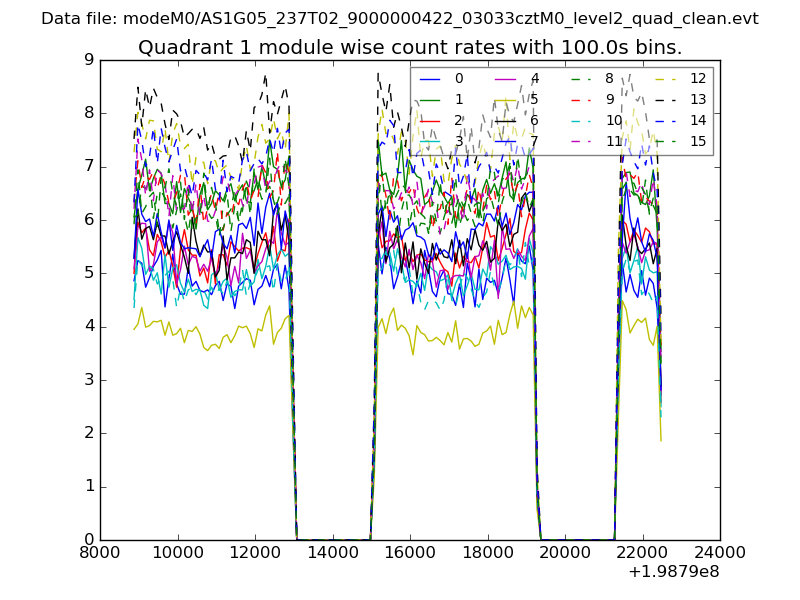
| Module-wise count rates for Quadrant A Data is divided into 100 sec bins |
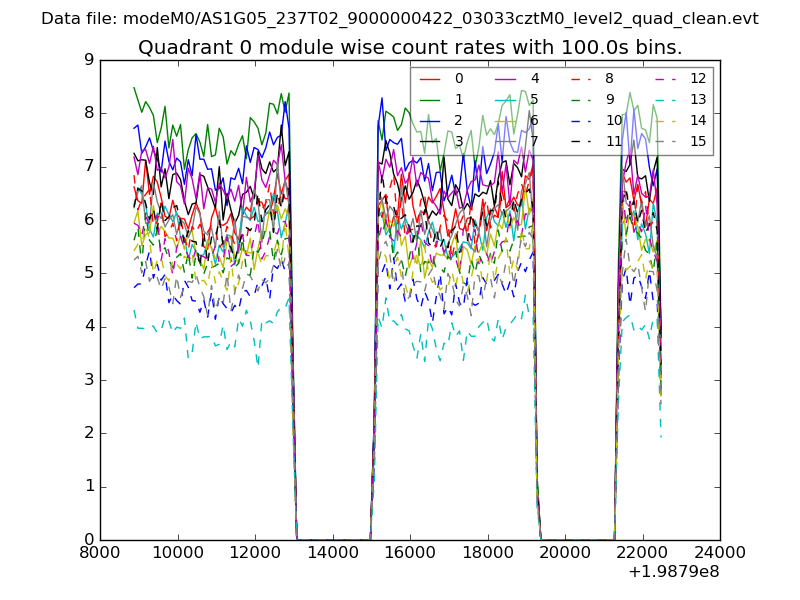 |
 |
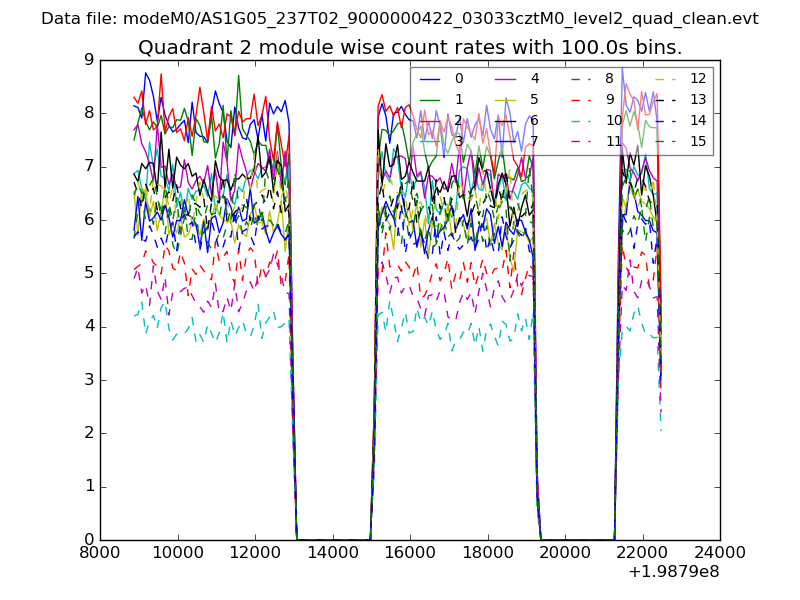
| Module-wise count rates for Quadrant B Data is divided into 100 sec bins |
 |
 |
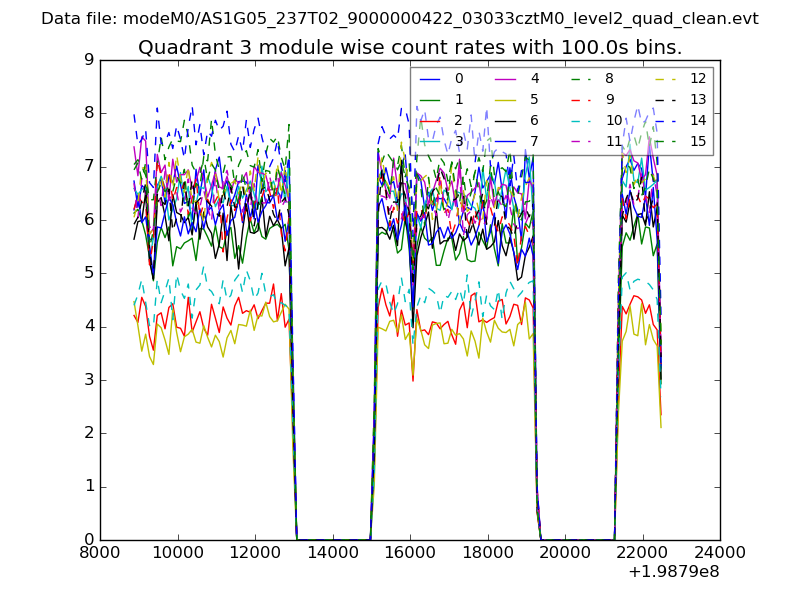
| Module-wise count rates for Quadrant C Data is divided into 100 sec bins |
 |
 |
| Module-wise count rates for Quadrant D Data is divided into 100 sec bins |
 |
 |
| Parameter | Plot |
|---|---|
| CZT HV Monitor | 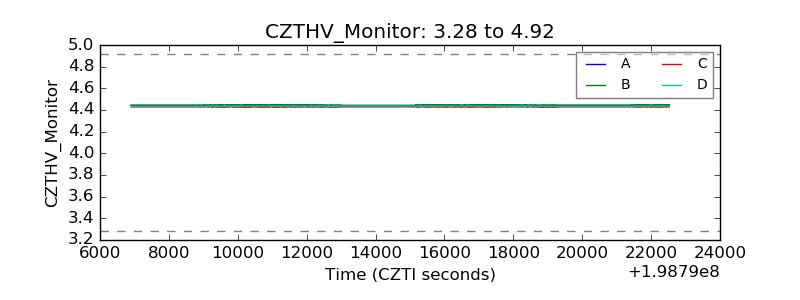 |
| D_VDD | 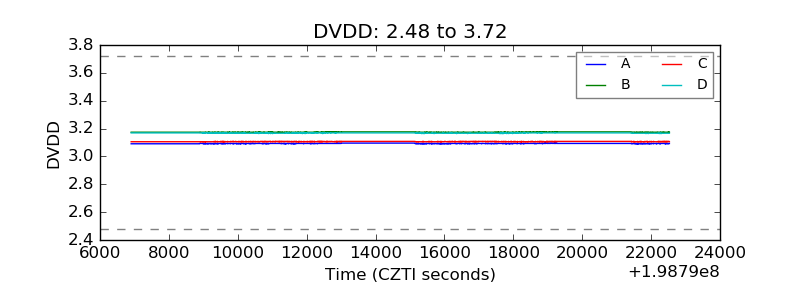 |
| Temperature 1 | 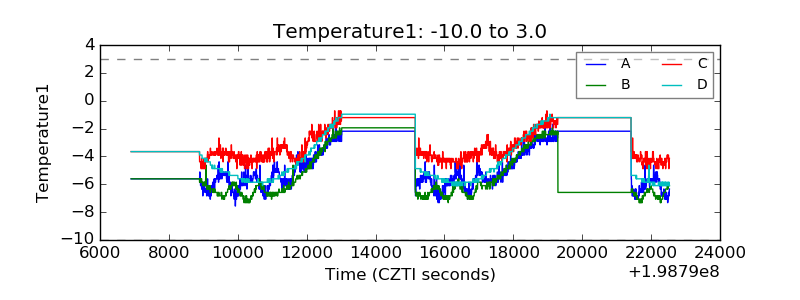 |
| Veto HV Monitor | 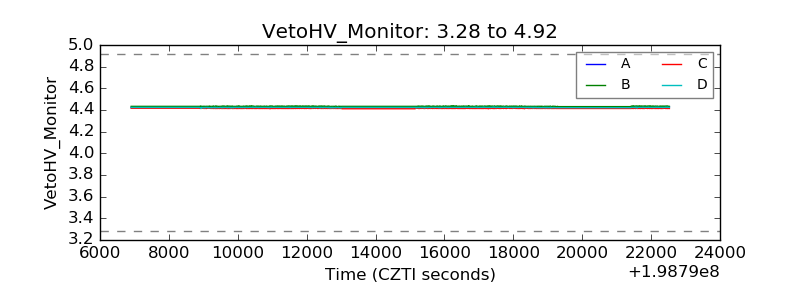 |
| Veto LLD | 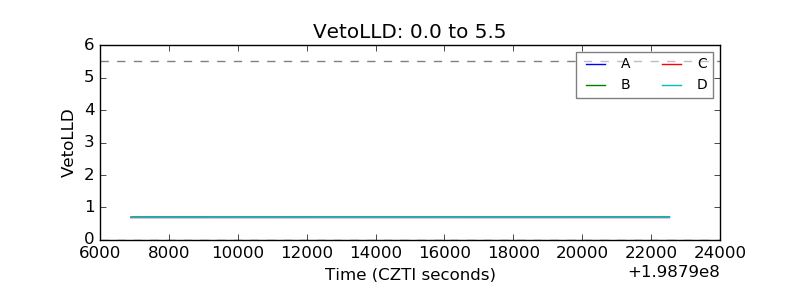 |
| Alpha Counter | 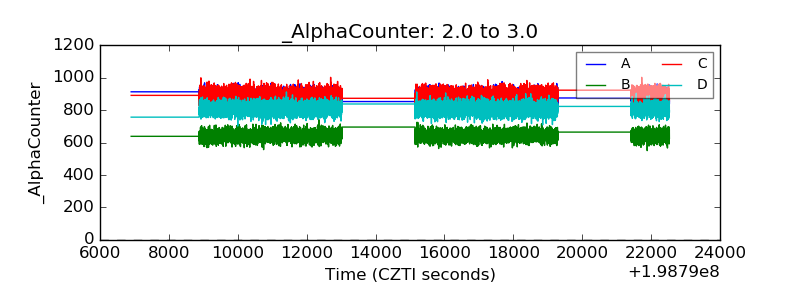 |
| _CPM_Rate | 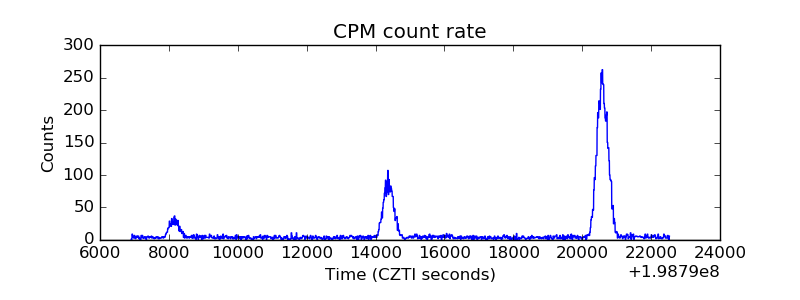 |
| CZT Counter | 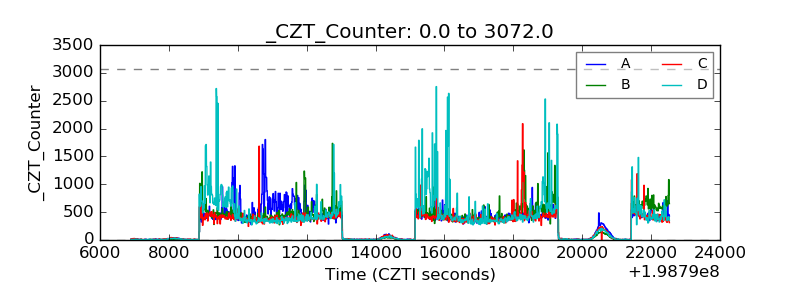 |
| +2.5 Volts monitor | 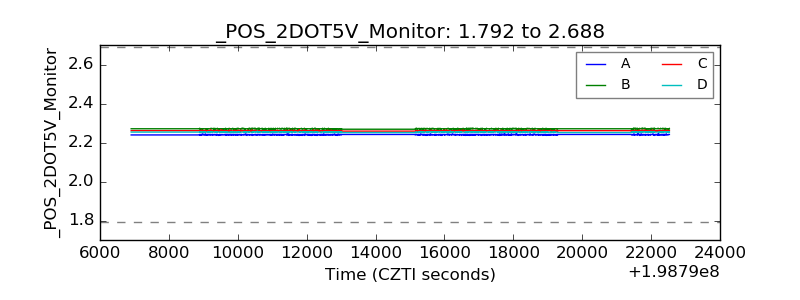 |
| +5 Volts monitor |  |
| _ROLL_ROT | 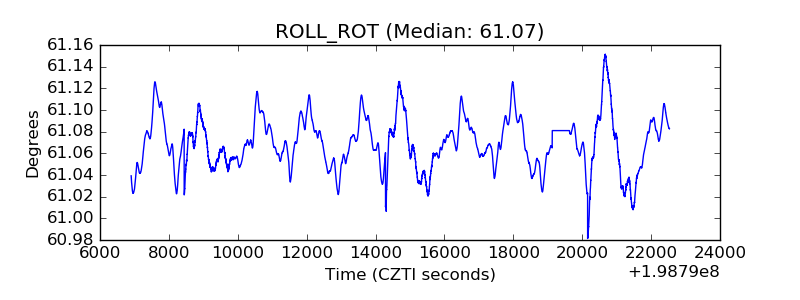 |
| _Roll_DEC | 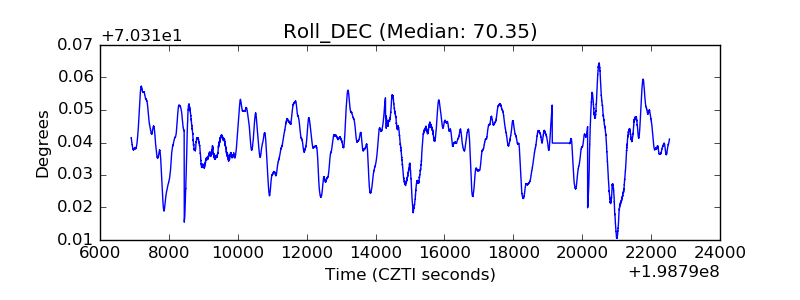 |
| _Roll_RA | 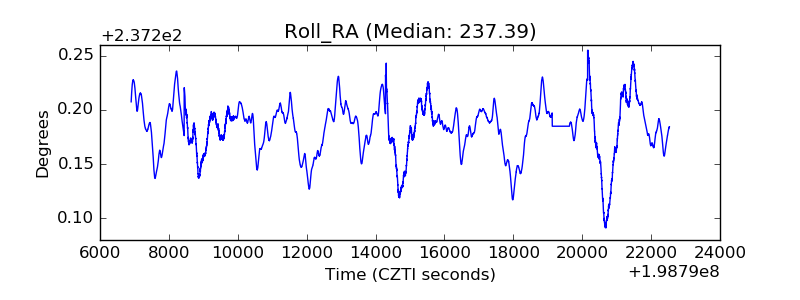 |
| Veto Counter |  |