| Param | Original file | Final file |
|---|---|---|
| Filename | modeM0/AS1G05_237T02_9000000422_03034cztM0_level2.evt | modeM0/AS1G05_237T02_9000000422_03034cztM0_level2_quad_clean.evt |
| Size (bytes) | 352,036,800 | 80,040,960 |
| Size | 335.7 MB | 76.3 MB |
| Events in quadrant A | 2,243,634 | 505,293 |
| Events in quadrant B | 3,083,598 | 508,592 |
| Events in quadrant C | 2,206,429 | 526,756 |
| Events in quadrant D | 2,766,583 | 511,886 |
| Mode SS | |||
|---|---|---|---|
| Quadrant | BADHDUFLAG | Total packets | Discarded packets |
| A | 0 | 108 | 0 |
| B | 0 | 108 | 0 |
| C | 0 | 108 | 0 |
| D | 0 | 108 | 0 |
| Mode M9 | |||
|---|---|---|---|
| Quadrant | BADHDUFLAG | Total packets | Discarded packets |
| A | 0 | 42 | 0 |
| B | 0 | 42 | 0 |
| C | 0 | 42 | 0 |
| D | 0 | 43 | 0 |
| Mode M0 | |||
|---|---|---|---|
| Quadrant | BADHDUFLAG | Total packets | Discarded packets |
| A | 0 | 10772 | 3 |
| B | 0 | 12840 | 2 |
| C | 0 | 10801 | 2 |
| D | 0 | 12369 | 2 |
| Quadrant | Total seconds | Saturated seconds | Saturation percentage |
|---|---|---|---|
| A | 5303 | 7 | 0.132001% |
| B | 5303 | 17 | 0.320573% |
| C | 5303 | 6 | 0.113144% |
| D | 5303 | 59 | 1.112578% |
Noise dominated data is calculated using 1-second bins in cleaned event files. If a bin has >2000 counts, and if more than 50% of those come from <1% of pixels, then it is considered to be noise-dominated and hence unusable.
| Quadrant | # 1 sec bins | Bins with >0 counts | Bins with >2000 counts | High rate bins dominated by noise | Noise dominated (total time) | Noise dominated (detector-on time) | Marked lightcurve |
|---|---|---|---|---|---|---|---|
| A | 7489 | 5304 | 2 | 2 | 0.03% | 0.04% | 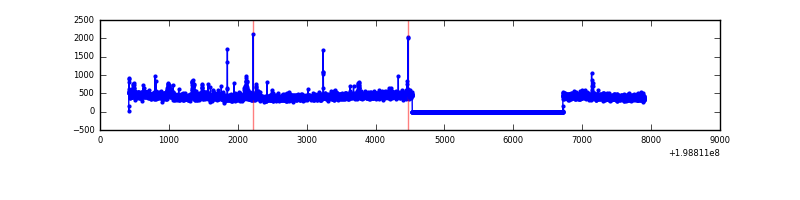 |
| B | 7489 | 5304 | 7 | 7 | 0.09% | 0.13% | 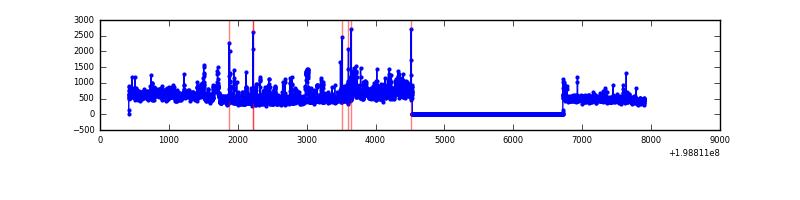 |
| C | 7489 | 5304 | 5 | 5 | 0.07% | 0.09% | 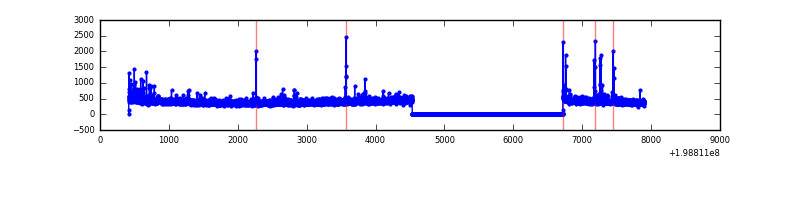 |
| D | 7489 | 5304 | 57 | 57 | 0.76% | 1.07% | 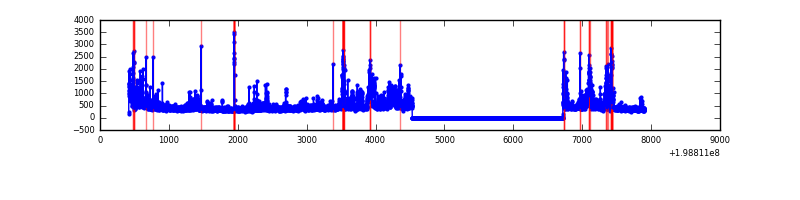 |
Top three noisy pixels from each quadrant. If the there are fewer than three noisy pixels in the level2.evt file, extra rows are filled as -1
| Pixel properties | Quadrant properties | ||||||
|---|---|---|---|---|---|---|---|
| Quadrant | DetID | PixID | Counts | Sigma | Mean | Median | Sigma |
| A | 0 | 50 | 89866 | 799.73 | 545 | 534 | 111.7 |
| A | 14 | 249 | 30148 | 265.11 | 545 | 534 | 111.7 |
| A | 3 | 1 | 7881 | 65.77 | 545 | 534 | 111.7 |
| B | 0 | 230 | 458110 | 4240.26 | 557 | 543 | 107.9 |
| B | 15 | 204 | 349970 | 3238.13 | 557 | 543 | 107.9 |
| B | 2 | 249 | 28180 | 256.11 | 557 | 543 | 107.9 |
| C | 6 | 80 | 80596 | 647.46 | 532 | 534 | 123.7 |
| C | 1 | 16 | 11684 | 90.17 | 532 | 534 | 123.7 |
| C | 15 | 208 | 8462 | 64.11 | 532 | 534 | 123.7 |
| D | 13 | 114 | 247656 | 1971.38 | 526 | 513 | 125.4 |
| D | 7 | 80 | 205521 | 1635.28 | 526 | 513 | 125.4 |
| D | 10 | 213 | 134305 | 1067.21 | 526 | 513 | 125.4 |
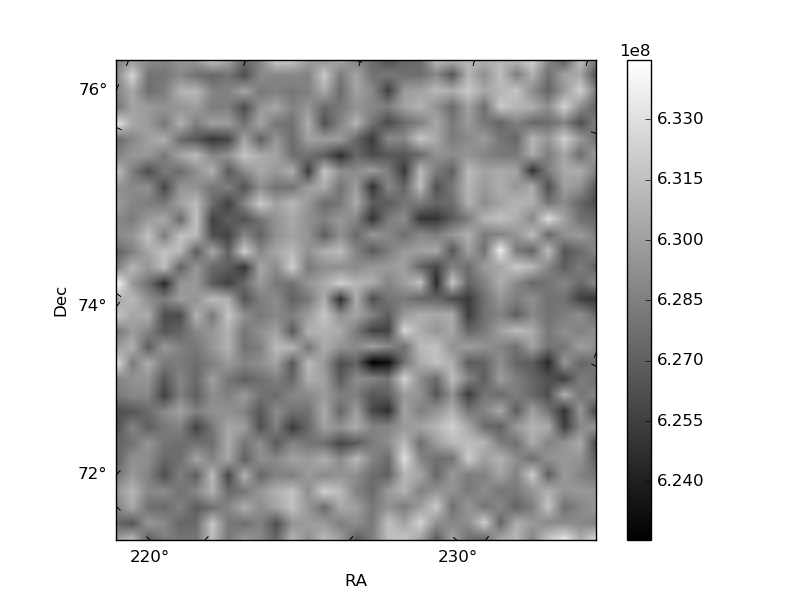
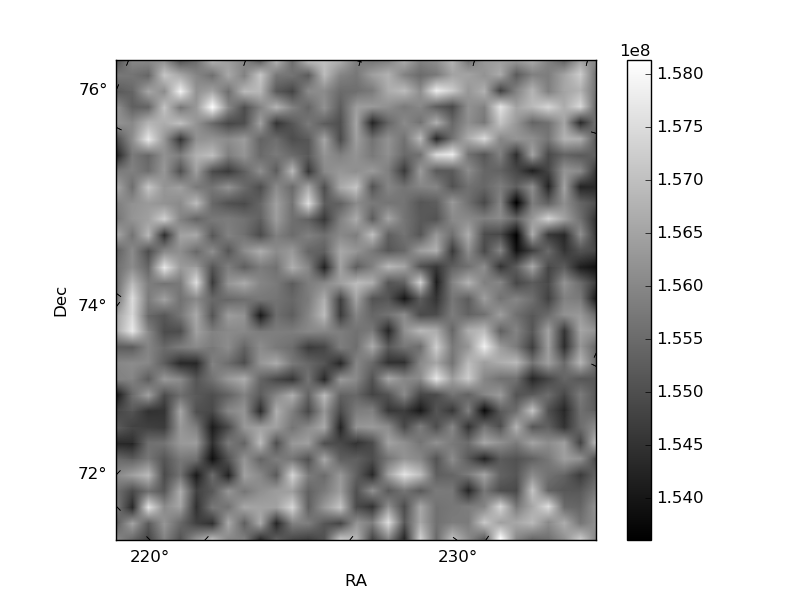
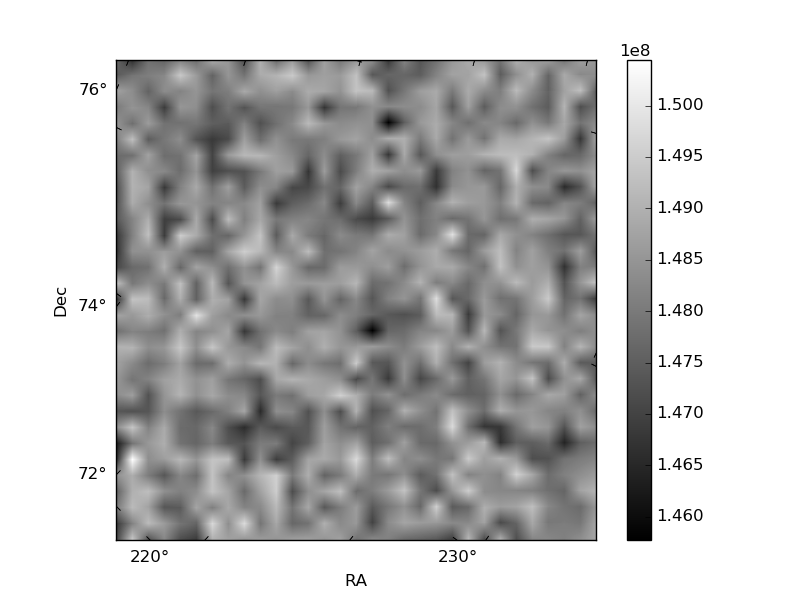
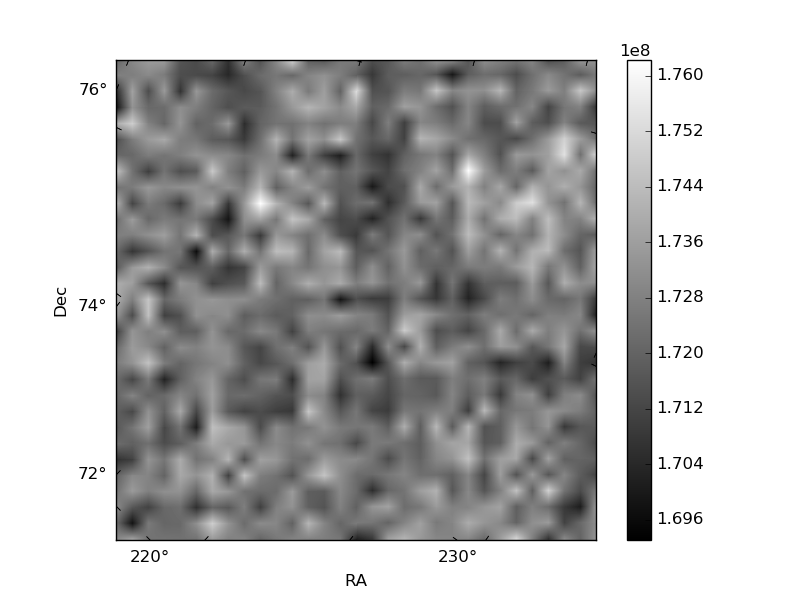
Histogram calculated using DETX and DETY for each event in the final _common_clean file
| Quadrant A | 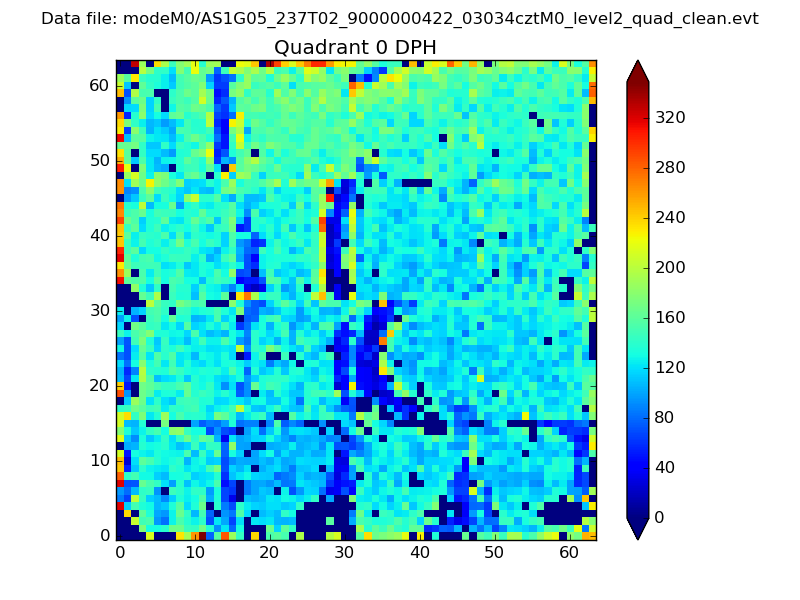 |
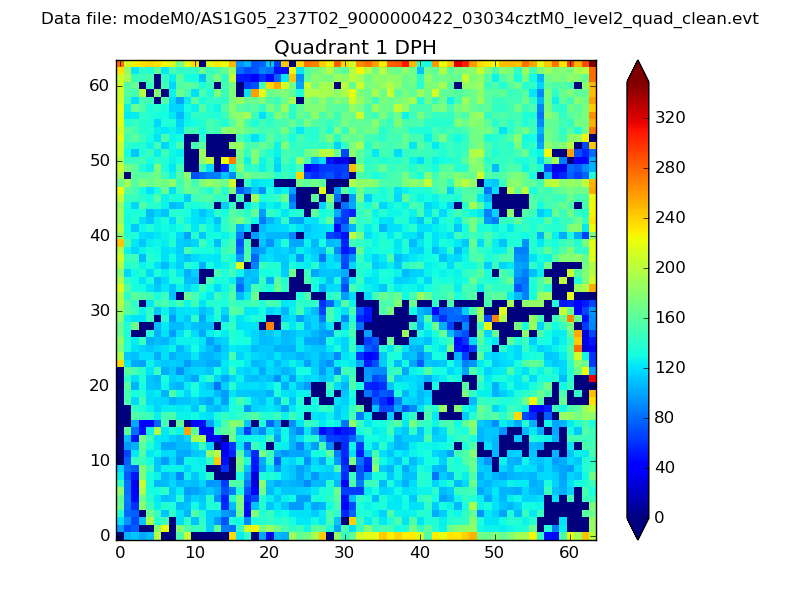 |
Quadrant B |
|---|---|---|---|
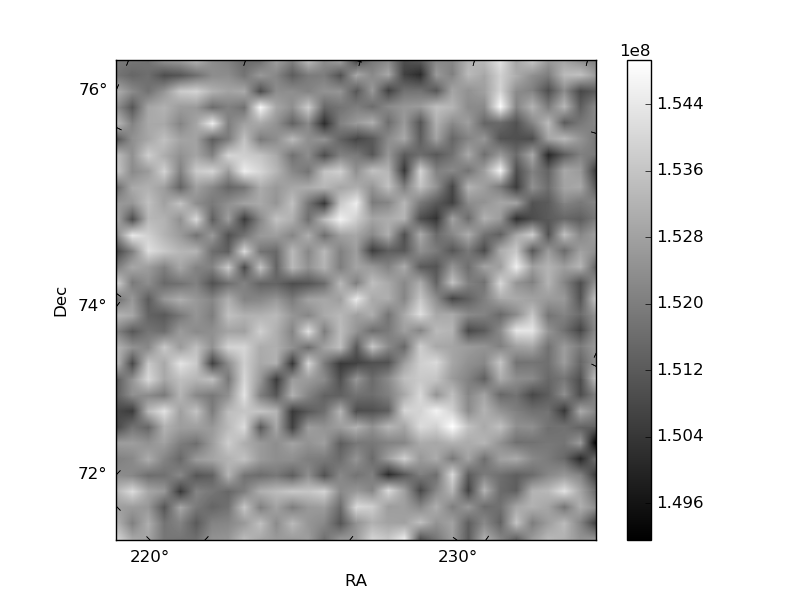
| Quadrant D | 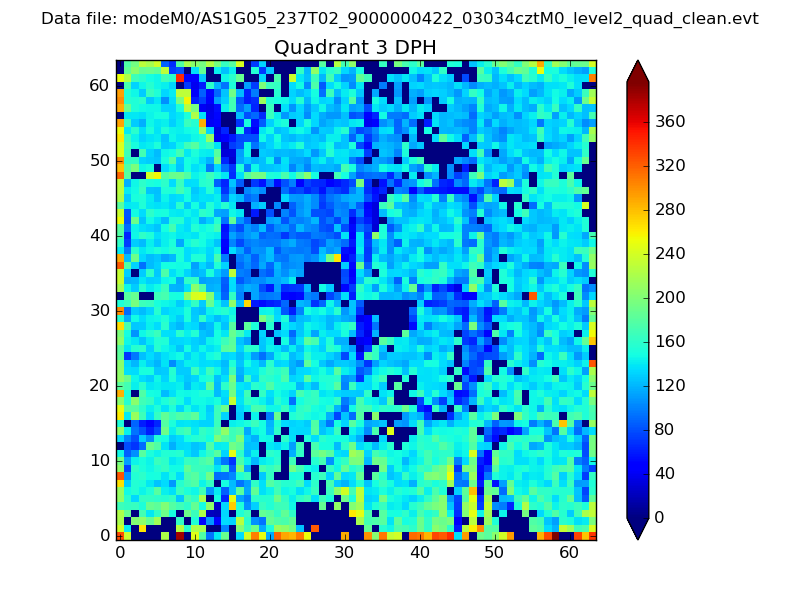 |
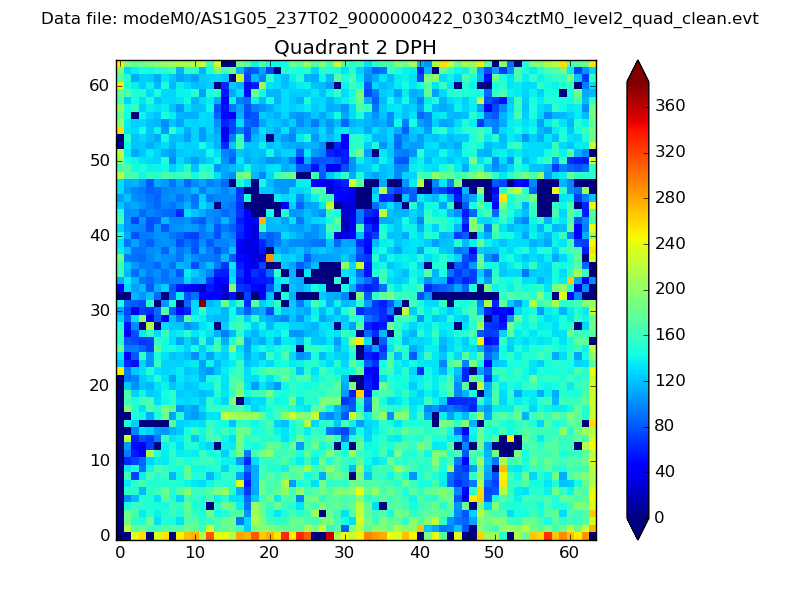 |
Quadrant C |
| Plot type | Count rate plots | Images |
|---|---|---|
| Comparison with Poisson distribution Blue bars denote a histogram of data divided into 1 sec bins. Red curve is a Poisson curve with rate = median count rate of data. |
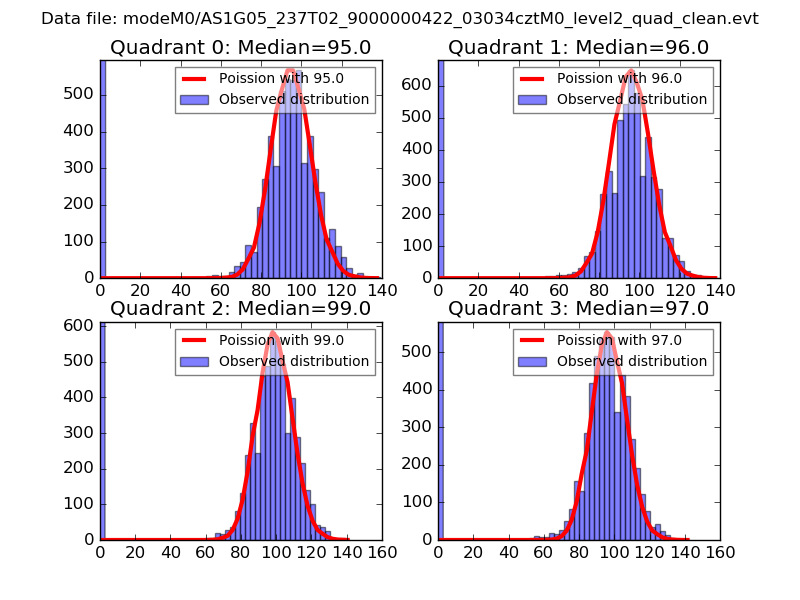 |
 |
| Quadrant-wise count rates Data is divided into 100 sec bins |
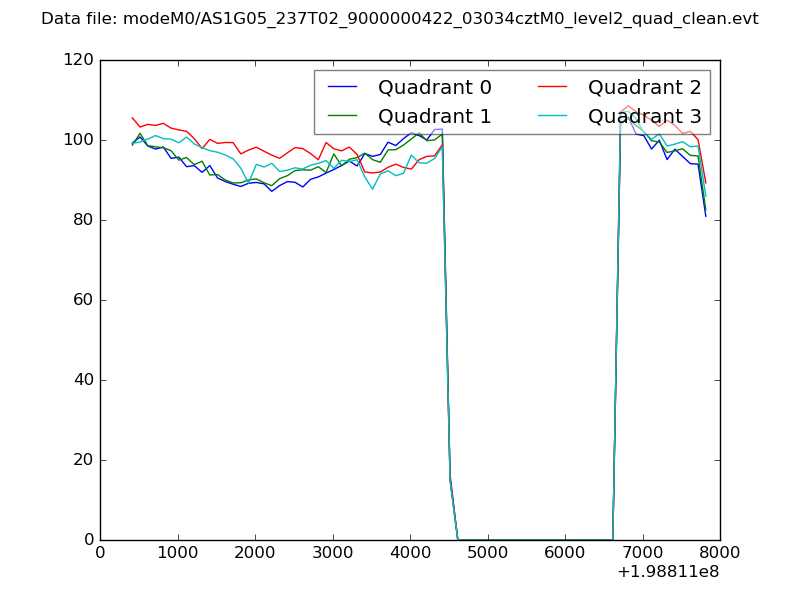 |
|
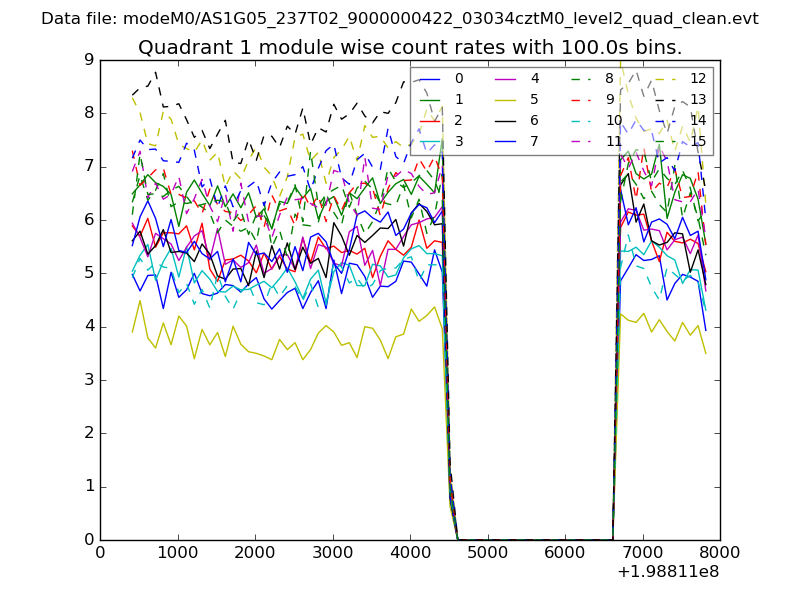
| Module-wise count rates for Quadrant A Data is divided into 100 sec bins |
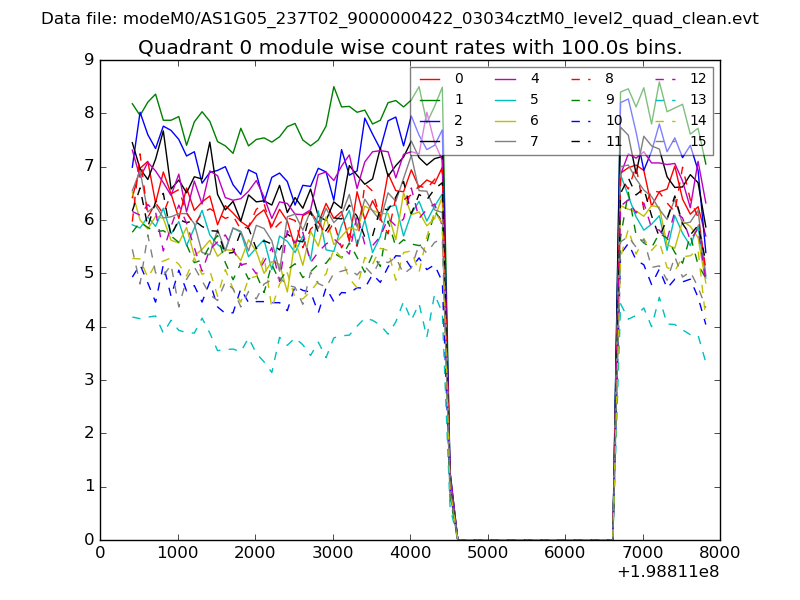 |
 |
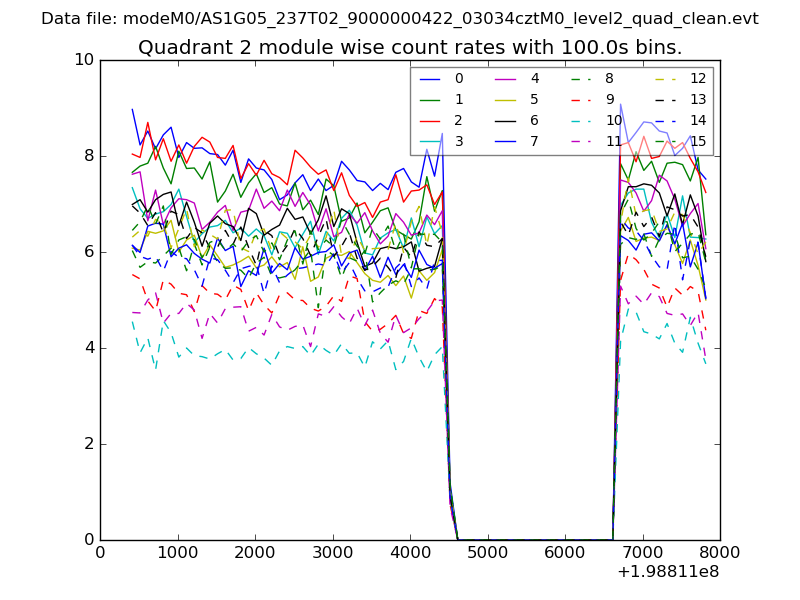
| Module-wise count rates for Quadrant B Data is divided into 100 sec bins |
 |
 |
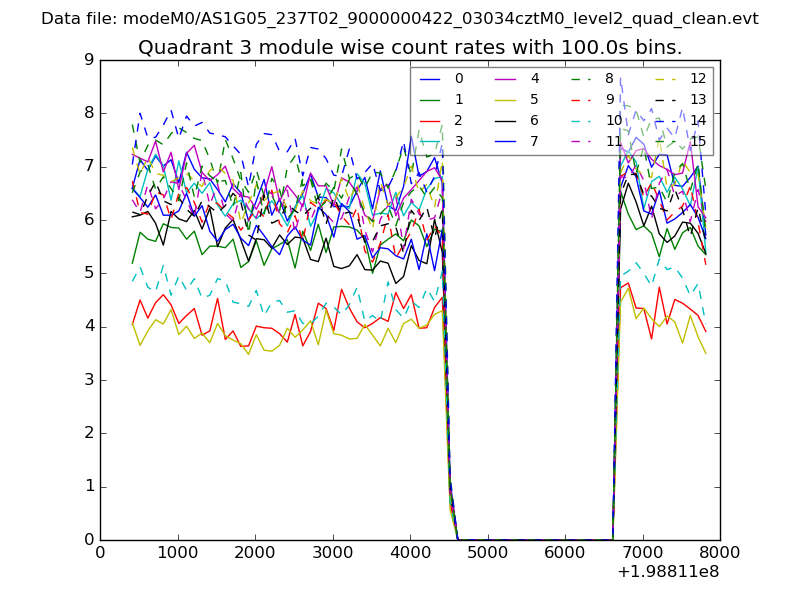
| Module-wise count rates for Quadrant C Data is divided into 100 sec bins |
 |
 |
| Module-wise count rates for Quadrant D Data is divided into 100 sec bins |
 |
 |
| Parameter | Plot |
|---|---|
| CZT HV Monitor | 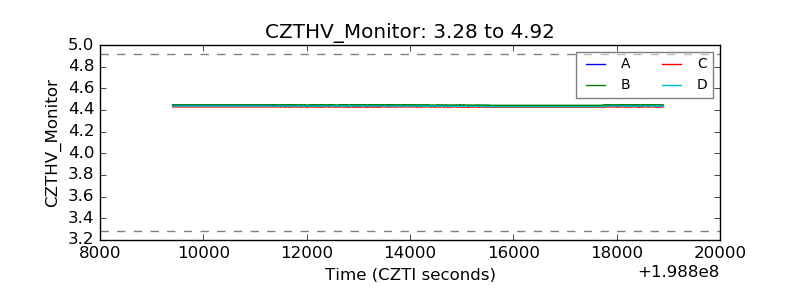 |
| D_VDD | 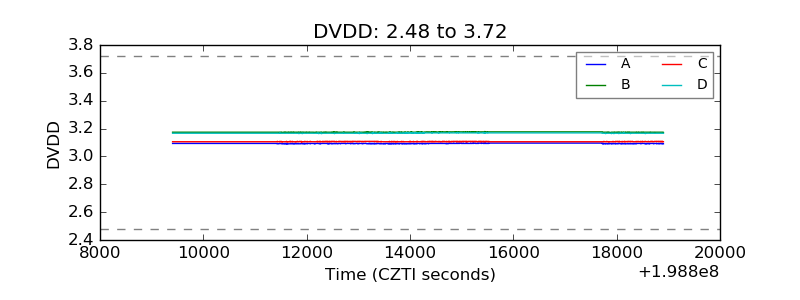 |
| Temperature 1 | 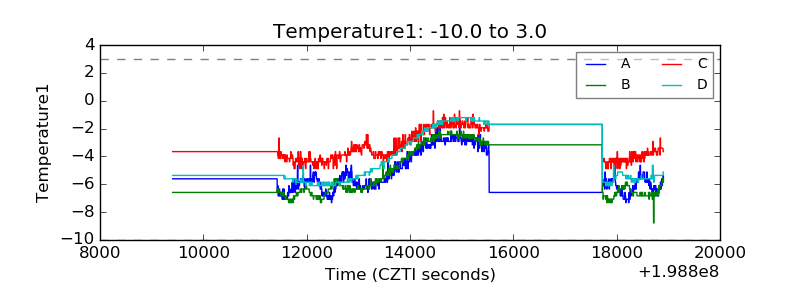 |
| Veto HV Monitor | 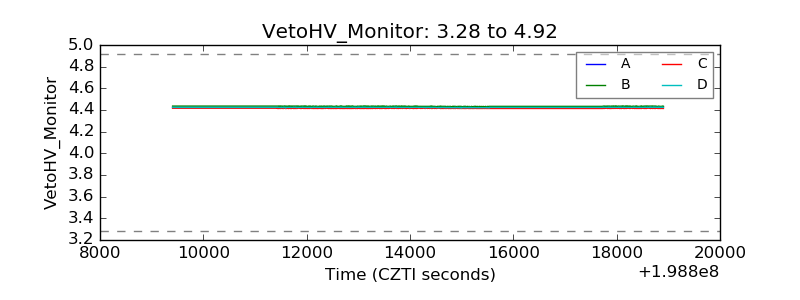 |
| Veto LLD | 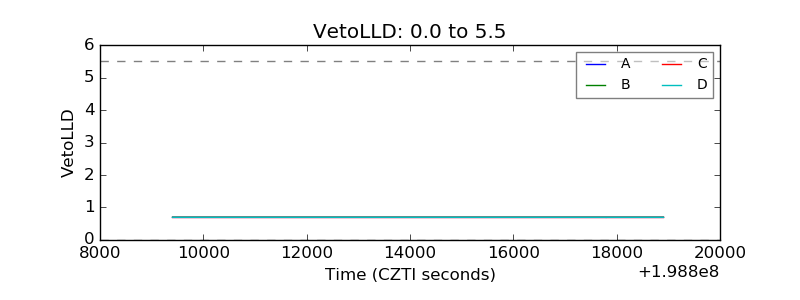 |
| Alpha Counter | 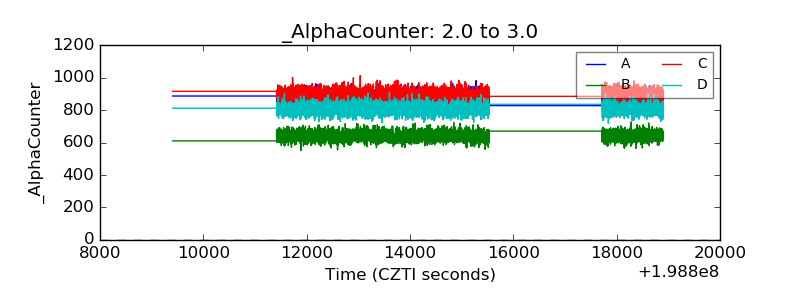 |
| _CPM_Rate | 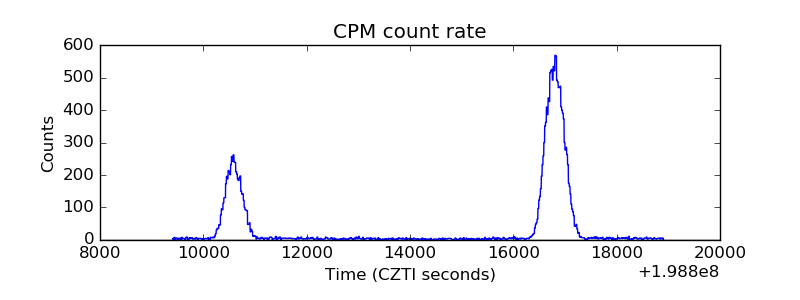 |
| CZT Counter | 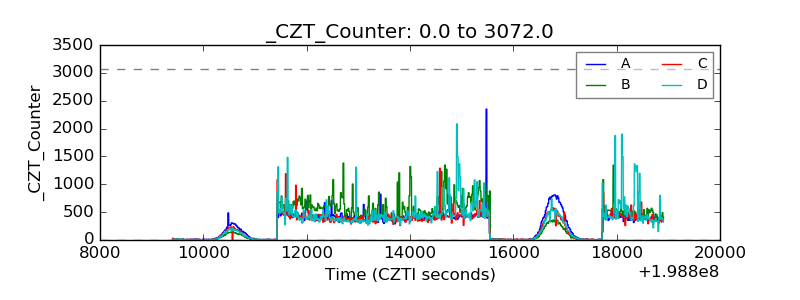 |
| +2.5 Volts monitor | 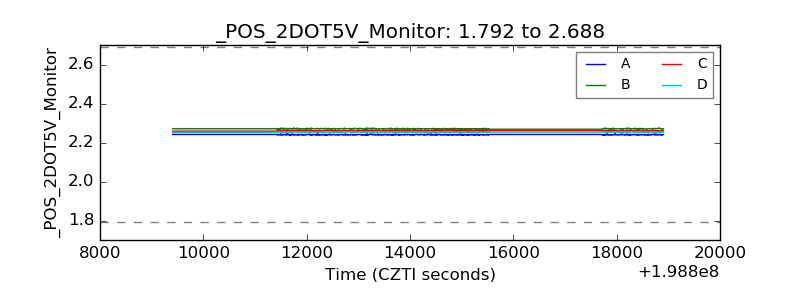 |
| +5 Volts monitor | 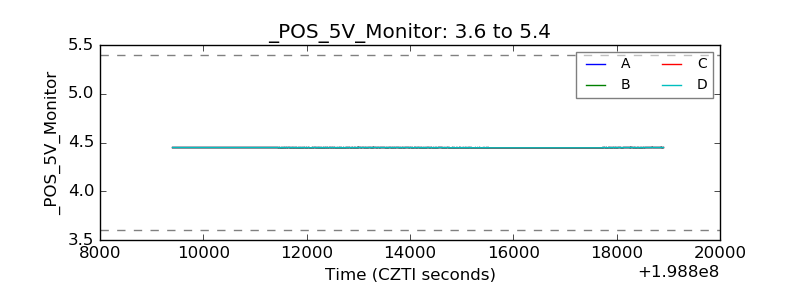 |
| _ROLL_ROT | 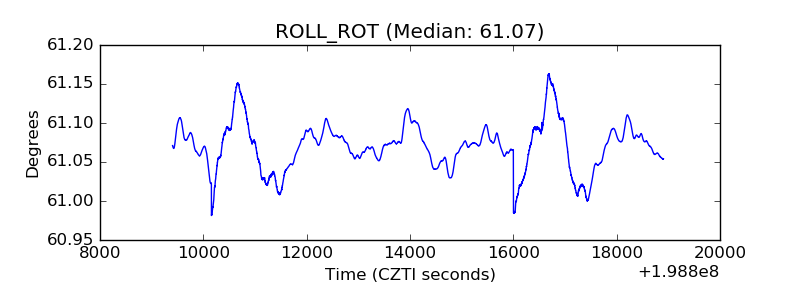 |
| _Roll_DEC | 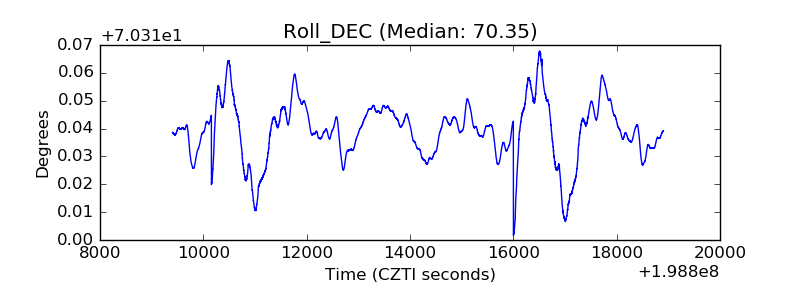 |
| _Roll_RA | 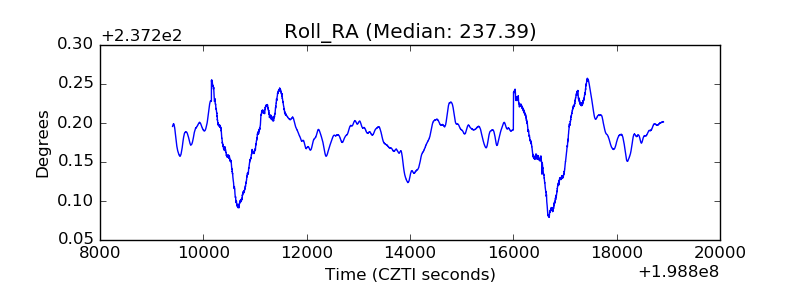 |
| Veto Counter | 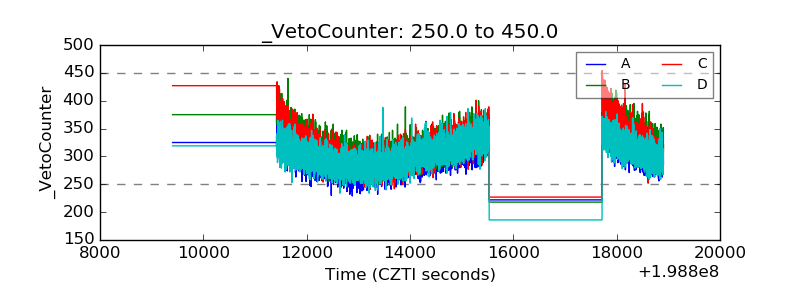 |