| Param | Original file | Final file |
|---|---|---|
| Filename | modeM0/AS1G05_237T02_9000000422_03038cztM0_level2.evt | modeM0/AS1G05_237T02_9000000422_03038cztM0_level2_quad_clean.evt |
| Size (bytes) | 417,732,480 | 82,990,080 |
| Size | 398.4 MB | 79.1 MB |
| Events in quadrant A | 2,270,673 | 545,713 |
| Events in quadrant B | 2,812,016 | 551,275 |
| Events in quadrant C | 4,283,320 | 527,964 |
| Events in quadrant D | 2,941,625 | 533,890 |
| Mode SS | |||
|---|---|---|---|
| Quadrant | BADHDUFLAG | Total packets | Discarded packets |
| A | 0 | 102 | 0 |
| B | 0 | 102 | 0 |
| C | 0 | 102 | 0 |
| D | 0 | 102 | 0 |
| Mode M9 | |||
|---|---|---|---|
| Quadrant | BADHDUFLAG | Total packets | Discarded packets |
| A | 0 | 30 | 0 |
| B | 0 | 30 | 0 |
| C | 0 | 30 | 0 |
| D | 0 | 31 | 0 |
| Mode M0 | |||
|---|---|---|---|
| Quadrant | BADHDUFLAG | Total packets | Discarded packets |
| A | 0 | 10219 | 3 |
| B | 0 | 11533 | 2 |
| C | 0 | 16165 | 2 |
| D | 0 | 12226 | 2 |
| Quadrant | Total seconds | Saturated seconds | Saturation percentage |
|---|---|---|---|
| A | 5059 | 11 | 0.217434% |
| B | 5059 | 14 | 0.276735% |
| C | 5059 | 299 | 5.910259% |
| D | 5059 | 32 | 0.632536% |
Noise dominated data is calculated using 1-second bins in cleaned event files. If a bin has >2000 counts, and if more than 50% of those come from <1% of pixels, then it is considered to be noise-dominated and hence unusable.
| Quadrant | # 1 sec bins | Bins with >0 counts | Bins with >2000 counts | High rate bins dominated by noise | Noise dominated (total time) | Noise dominated (detector-on time) | Marked lightcurve |
|---|---|---|---|---|---|---|---|
| A | 7215 | 5060 | 3 | 3 | 0.04% | 0.06% | 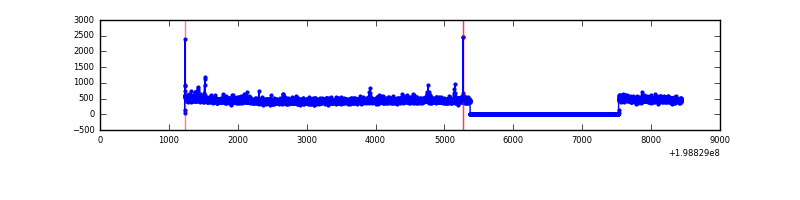 |
| B | 7215 | 5060 | 6 | 6 | 0.08% | 0.12% | 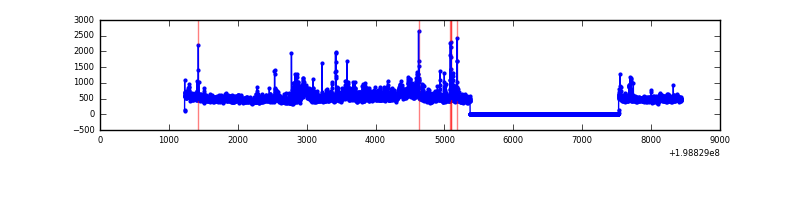 |
| C | 7215 | 5060 | 292 | 292 | 4.05% | 5.77% | 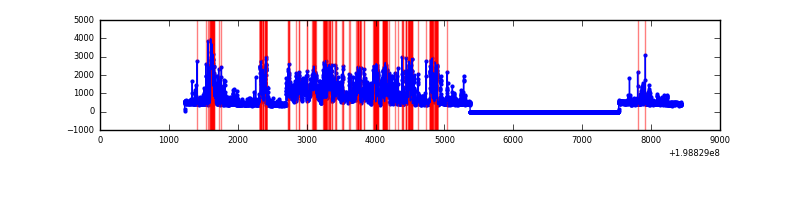 |
| D | 7215 | 5060 | 25 | 25 | 0.35% | 0.49% | 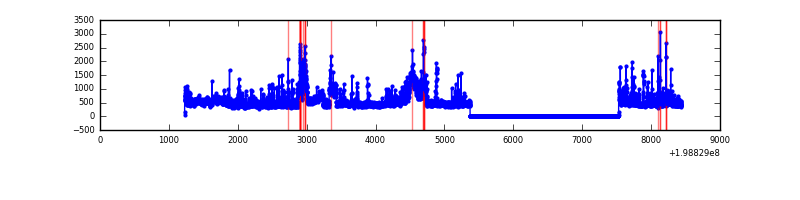 |
Top three noisy pixels from each quadrant. If the there are fewer than three noisy pixels in the level2.evt file, extra rows are filled as -1
| Pixel properties | Quadrant properties | ||||||
|---|---|---|---|---|---|---|---|
| Quadrant | DetID | PixID | Counts | Sigma | Mean | Median | Sigma |
| A | 0 | 50 | 21987 | 185.89 | 571 | 560 | 115.3 |
| A | 13 | 251 | 19007 | 160.04 | 571 | 560 | 115.3 |
| A | 14 | 249 | 13724 | 114.2 | 571 | 560 | 115.3 |
| B | 15 | 204 | 360388 | 3317.32 | 573 | 562 | 108.5 |
| B | 2 | 249 | 72260 | 661.0 | 573 | 562 | 108.5 |
| B | 0 | 230 | 71967 | 658.3 | 573 | 562 | 108.5 |
| C | 1 | 192 | 1997165 | 16251.87 | 535 | 536 | 122.9 |
| C | 12 | 206 | 68178 | 550.58 | 535 | 536 | 122.9 |
| C | 6 | 80 | 60074 | 484.62 | 535 | 536 | 122.9 |
| D | 13 | 114 | 371389 | 2844.93 | 548 | 534 | 130.4 |
| D | 2 | 152 | 146023 | 1116.09 | 548 | 534 | 130.4 |
| D | 7 | 80 | 134007 | 1023.91 | 548 | 534 | 130.4 |
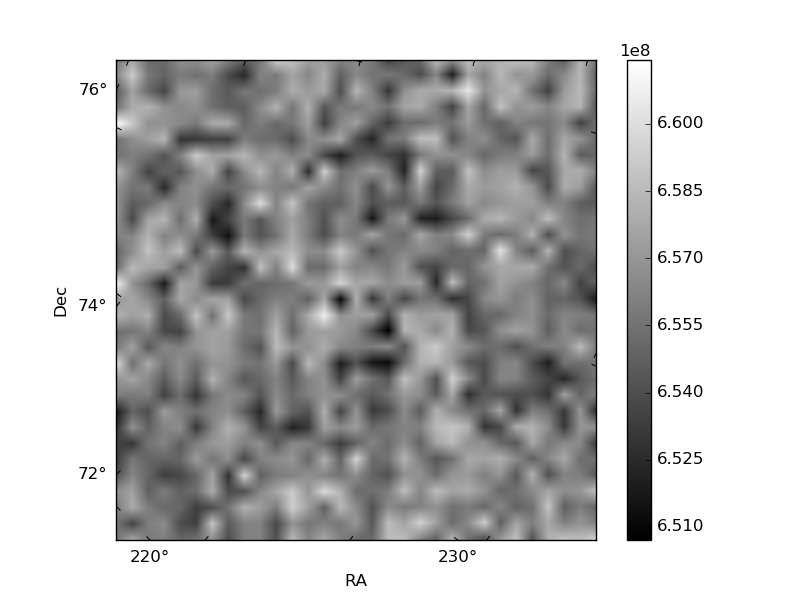
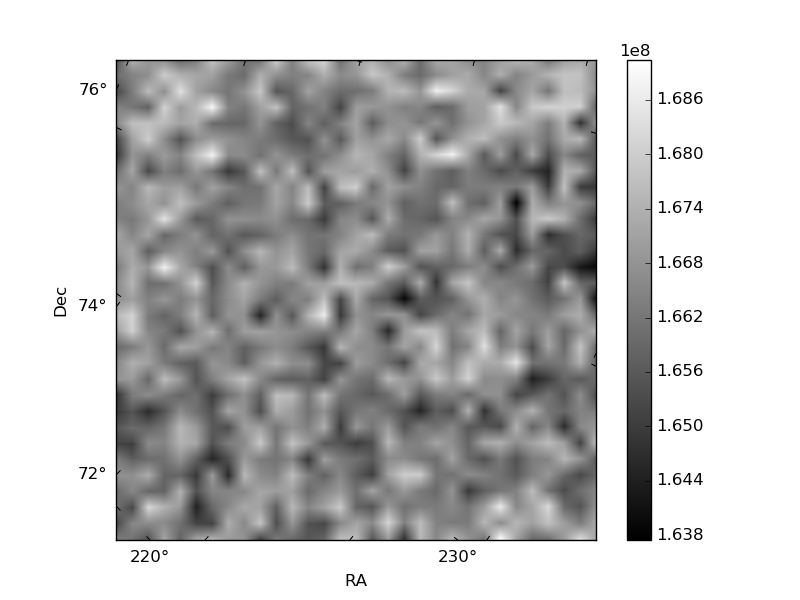
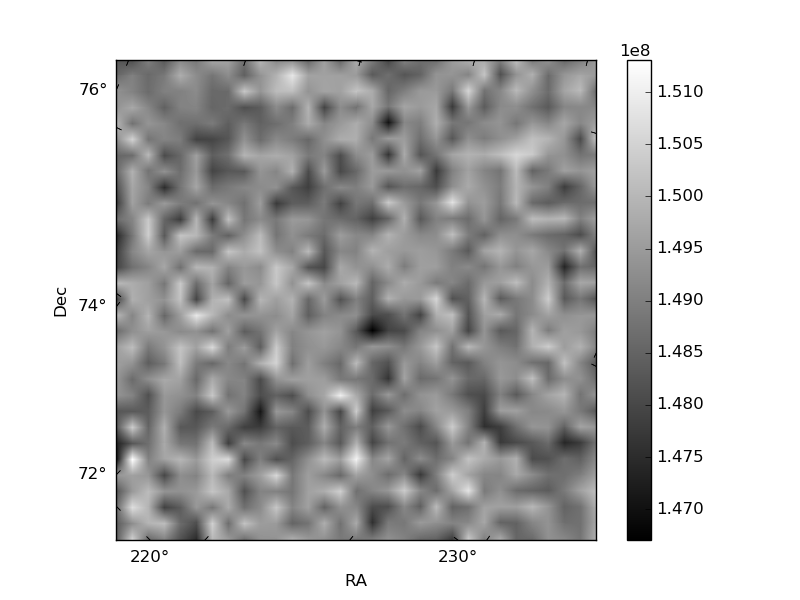
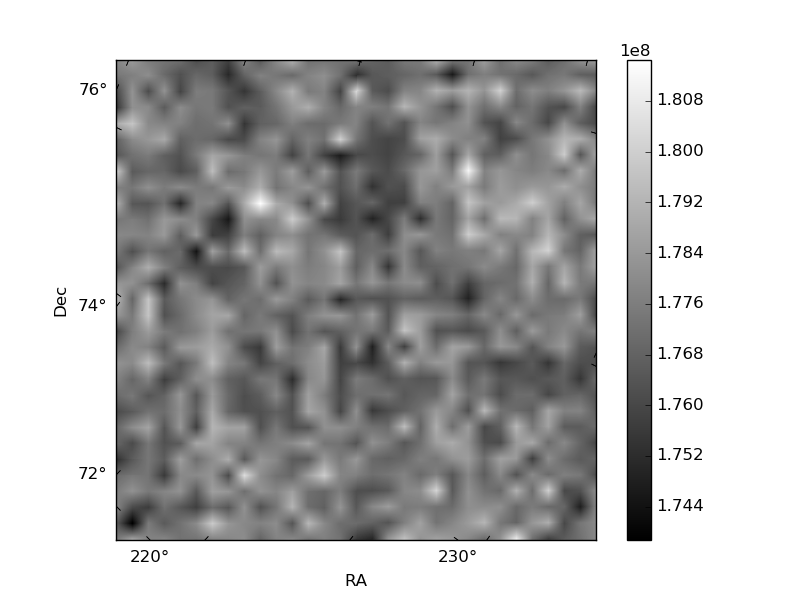
Histogram calculated using DETX and DETY for each event in the final _common_clean file
| Quadrant A | 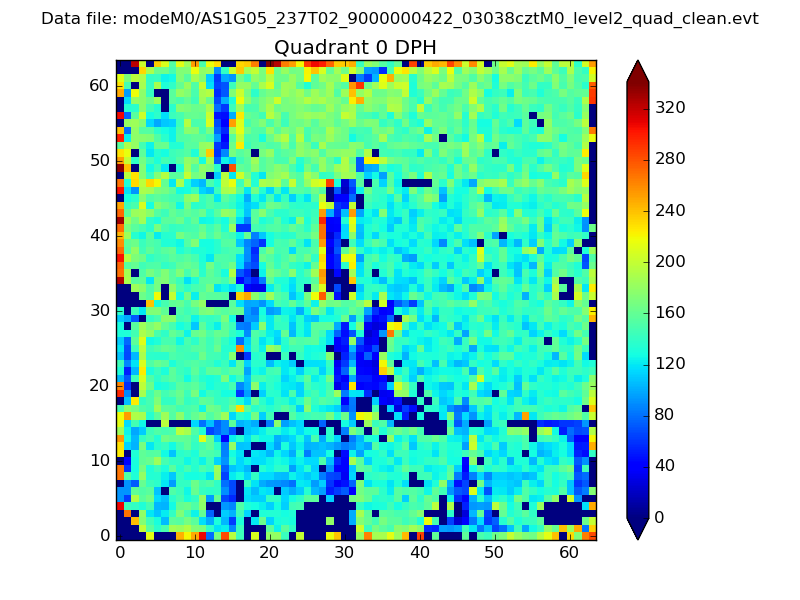 |
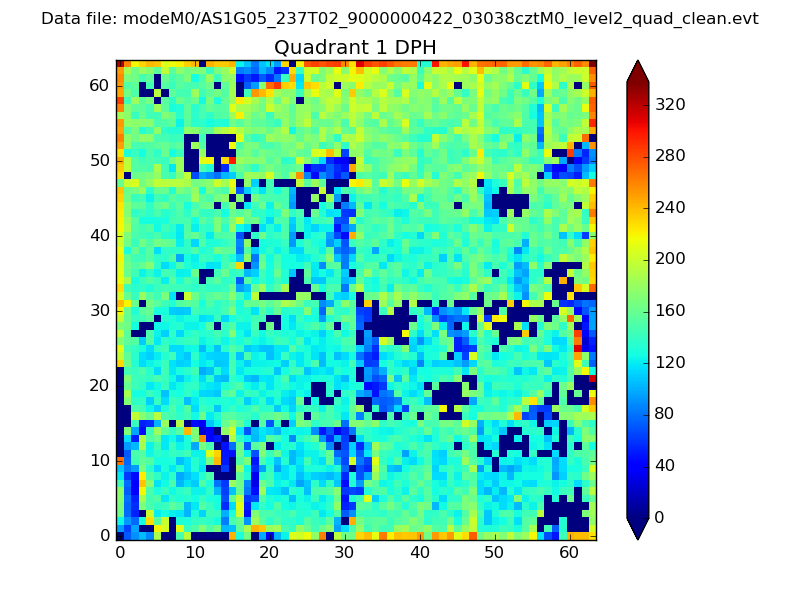 |
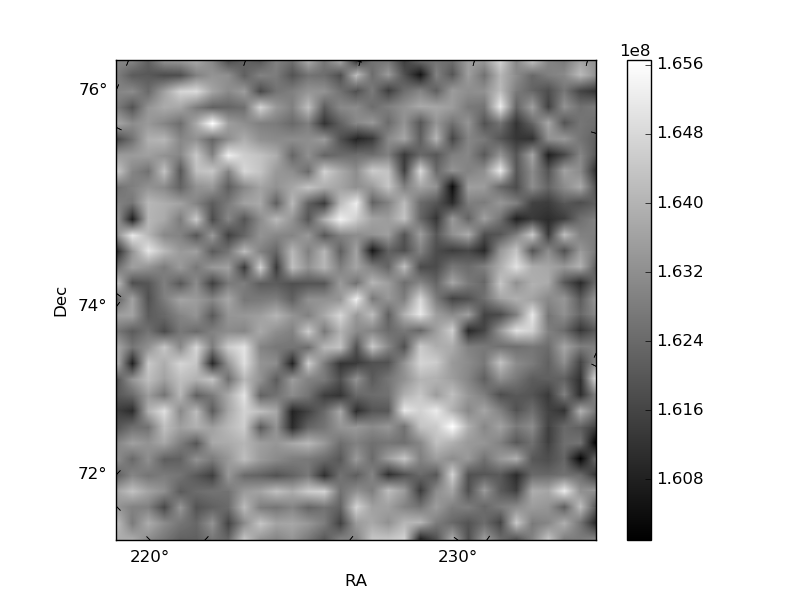
Quadrant B |
|---|---|---|---|
| Quadrant D | 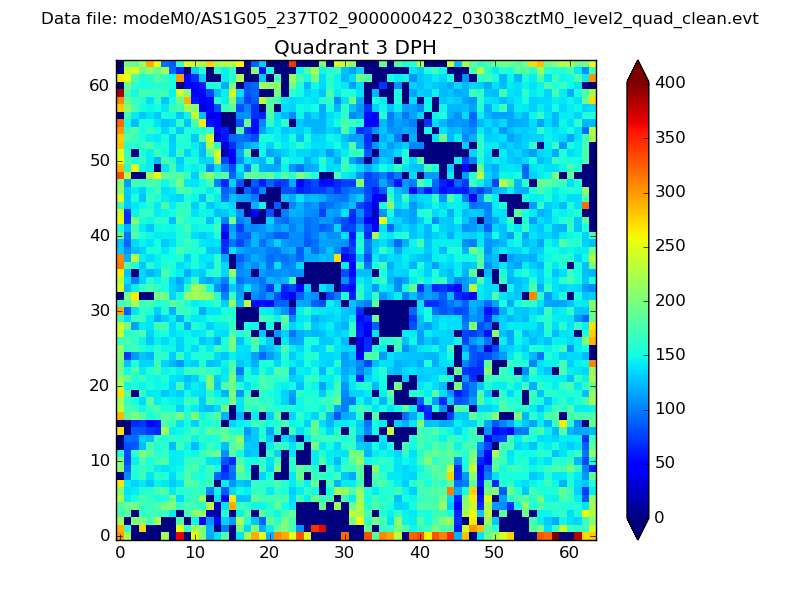 |
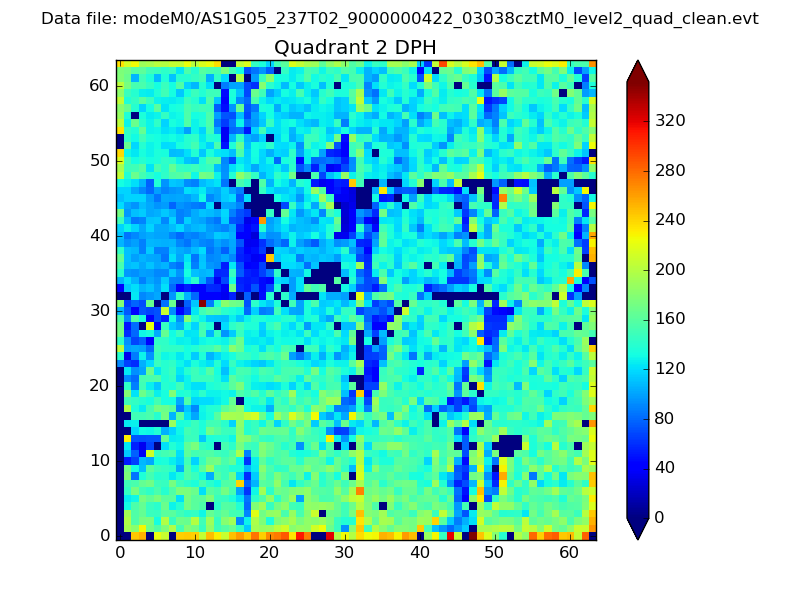 |
Quadrant C |
| Plot type | Count rate plots | Images |
|---|---|---|
| Comparison with Poisson distribution Blue bars denote a histogram of data divided into 1 sec bins. Red curve is a Poisson curve with rate = median count rate of data. |
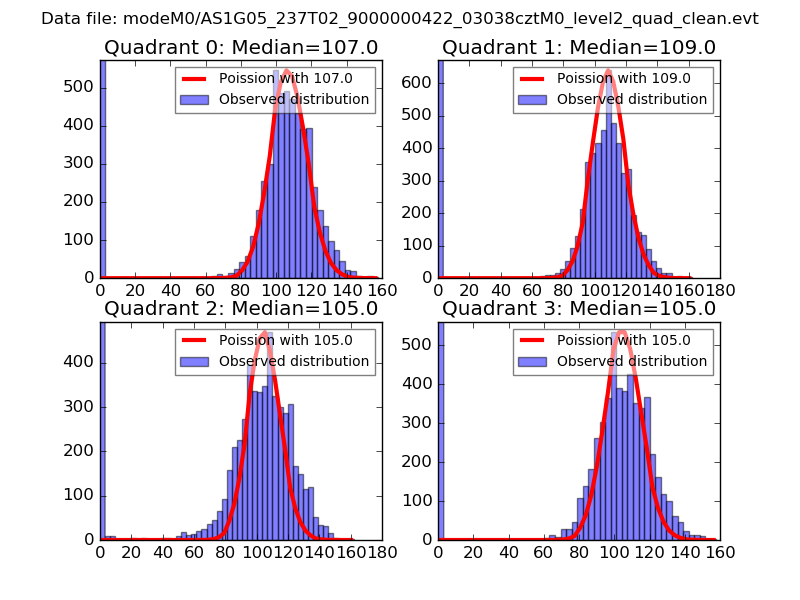 |
 |
| Quadrant-wise count rates Data is divided into 100 sec bins |
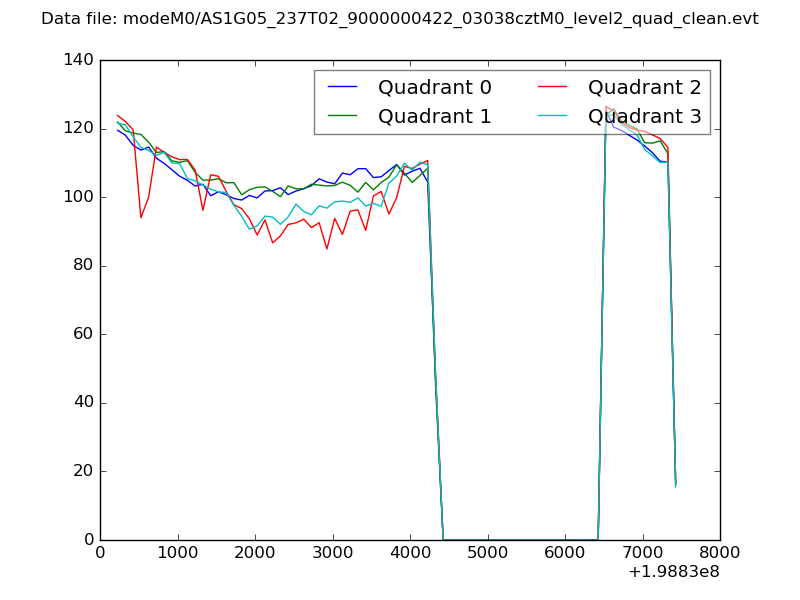 |
|
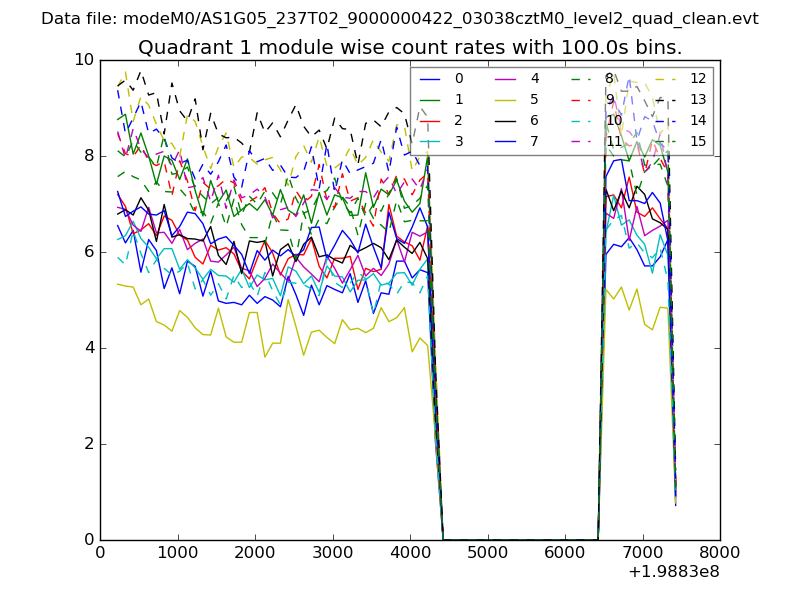
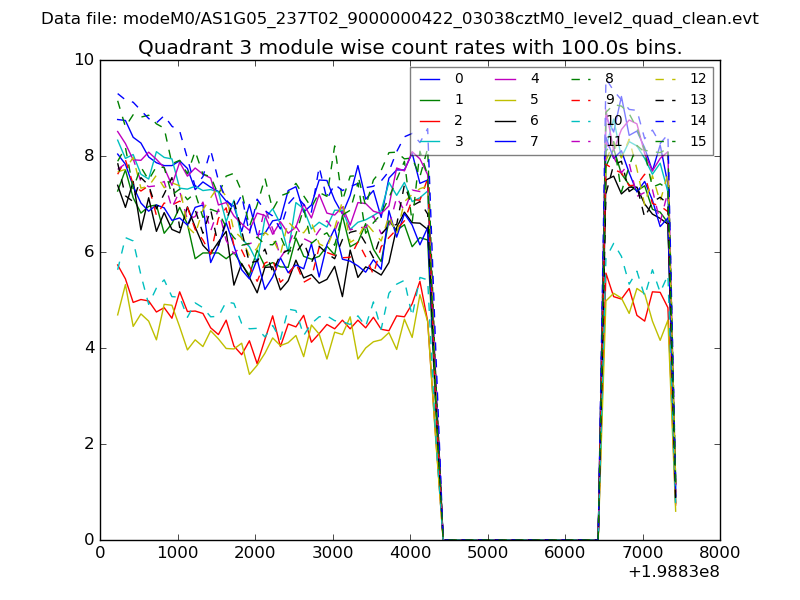
| Module-wise count rates for Quadrant A Data is divided into 100 sec bins |
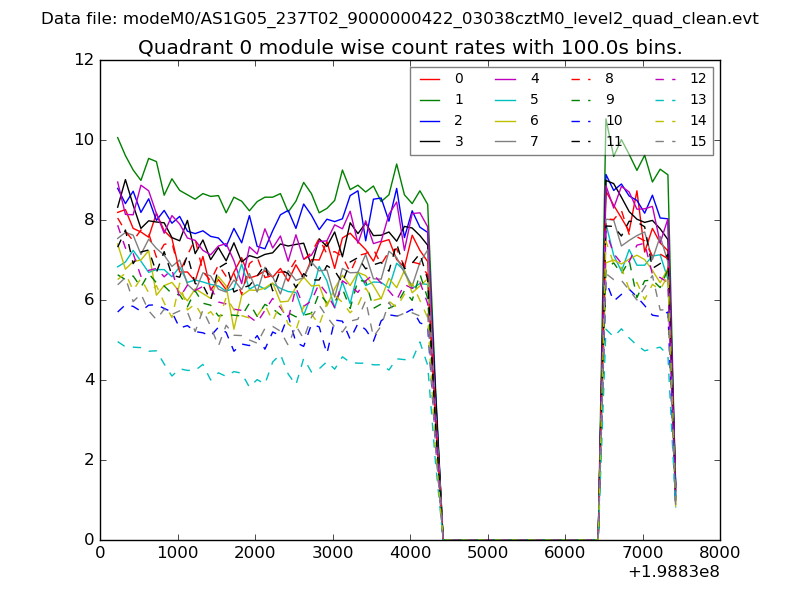 |
 |
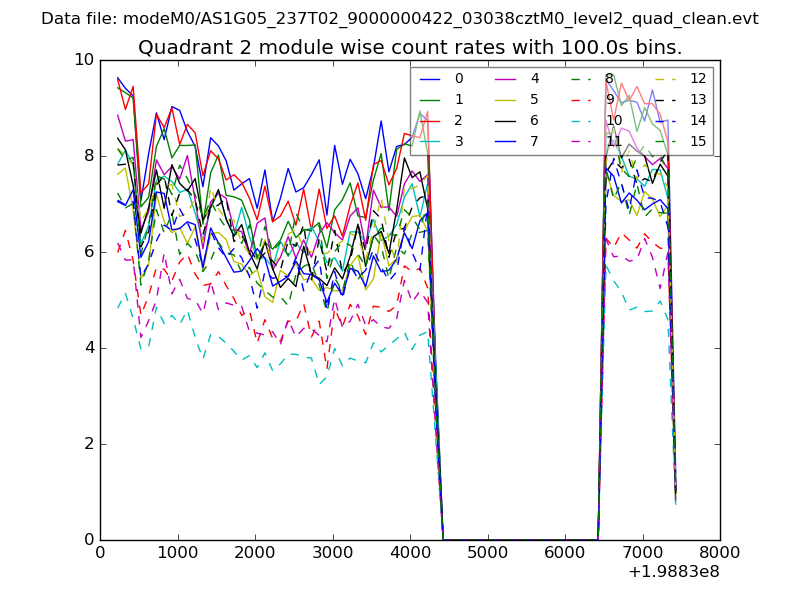
| Module-wise count rates for Quadrant B Data is divided into 100 sec bins |
 |
 |
| Module-wise count rates for Quadrant C Data is divided into 100 sec bins |
 |
 |
| Module-wise count rates for Quadrant D Data is divided into 100 sec bins |
 |
 |
| Parameter | Plot |
|---|---|
| CZT HV Monitor | 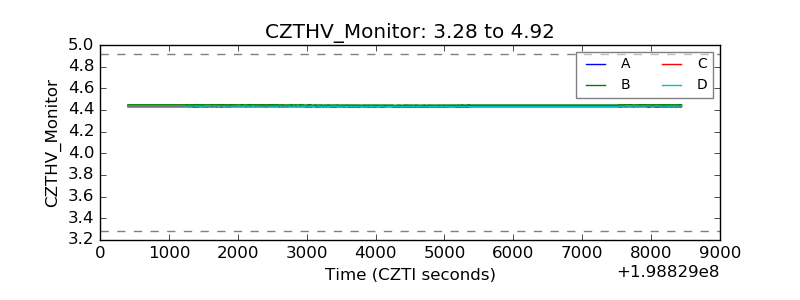 |
| D_VDD | 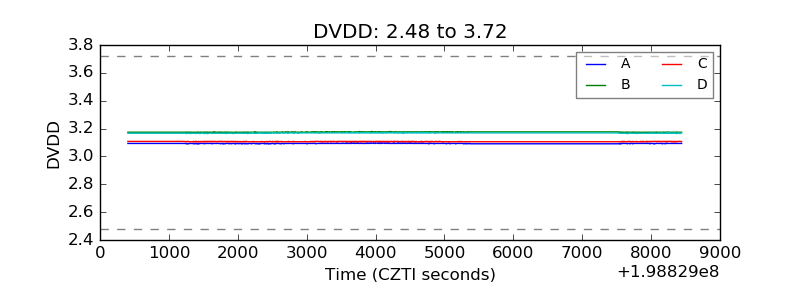 |
| Temperature 1 | 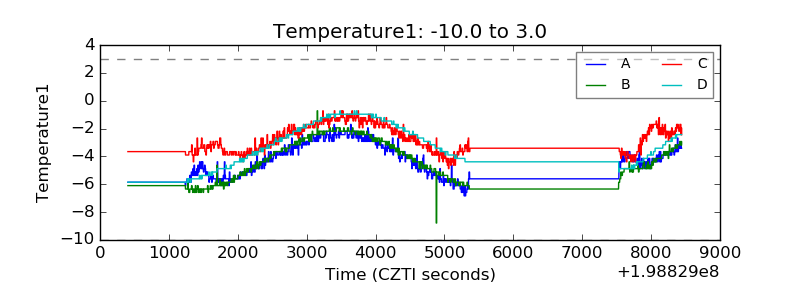 |
| Veto HV Monitor | 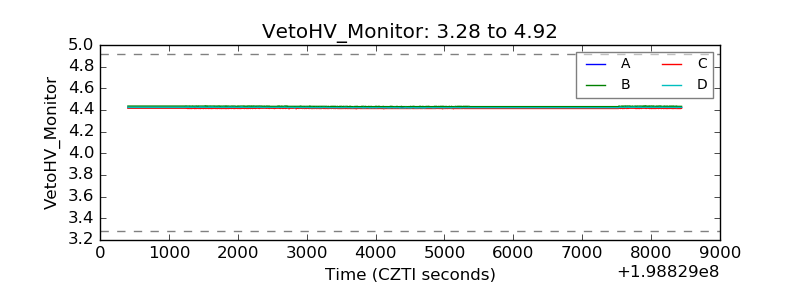 |
| Veto LLD | 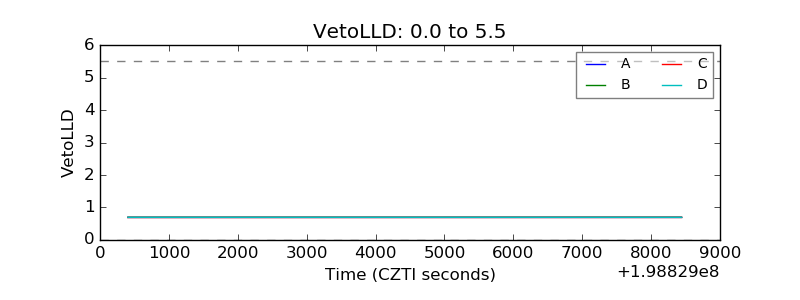 |
| Alpha Counter | 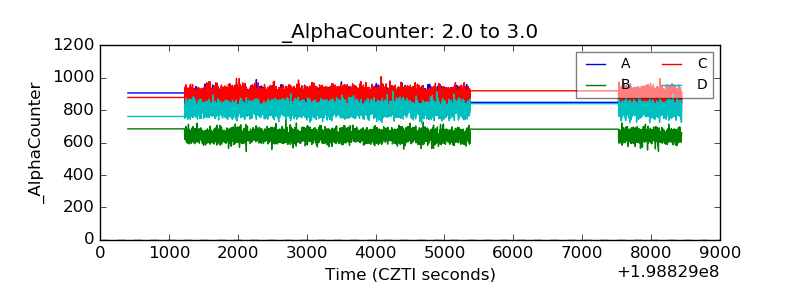 |
| _CPM_Rate | 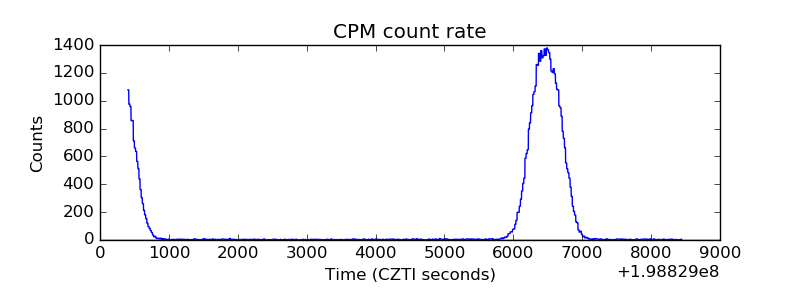 |
| CZT Counter | 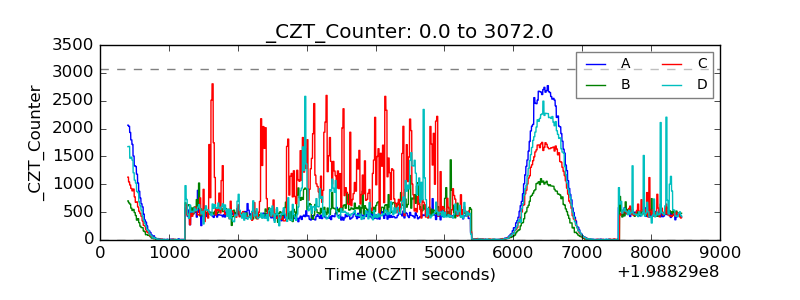 |
| +2.5 Volts monitor |  |
| +5 Volts monitor |  |
| _ROLL_ROT | 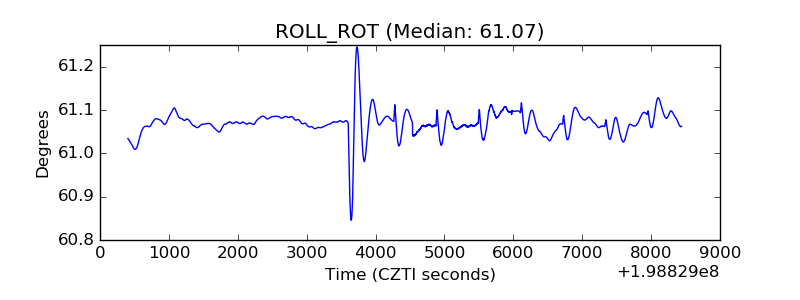 |
| _Roll_DEC | 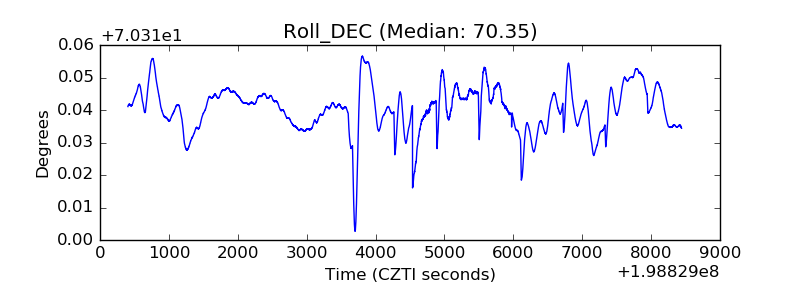 |
| _Roll_RA | 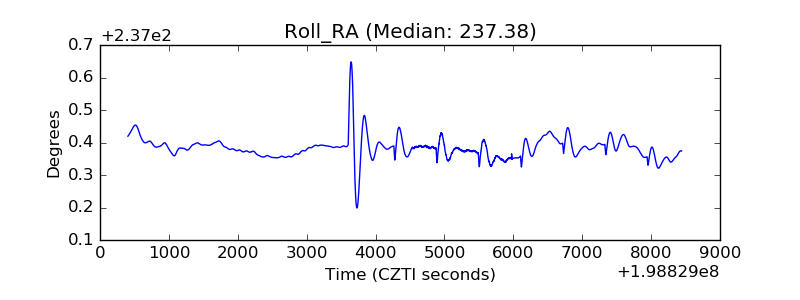 |
| Veto Counter | 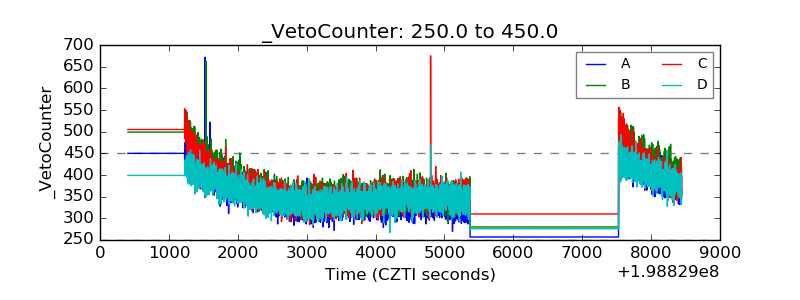 |