| Param | Original file | Final file |
|---|---|---|
| Filename | modeM0/AS1G05_237T02_9000000422_03039cztM0_level2.evt | modeM0/AS1G05_237T02_9000000422_03039cztM0_level2_quad_clean.evt |
| Size (bytes) | 338,529,600 | 81,760,320 |
| Size | 322.8 MB | 78.0 MB |
| Events in quadrant A | 2,207,489 | 538,362 |
| Events in quadrant B | 2,755,920 | 539,280 |
| Events in quadrant C | 2,391,445 | 532,763 |
| Events in quadrant D | 2,563,829 | 522,004 |
| Mode SS | |||
|---|---|---|---|
| Quadrant | BADHDUFLAG | Total packets | Discarded packets |
| A | 0 | 102 | 0 |
| B | 0 | 102 | 0 |
| C | 0 | 102 | 0 |
| D | 0 | 102 | 0 |
| Mode M9 | |||
|---|---|---|---|
| Quadrant | BADHDUFLAG | Total packets | Discarded packets |
| A | 0 | 21 | 0 |
| B | 0 | 21 | 0 |
| C | 0 | 21 | 0 |
| D | 0 | 21 | 0 |
| Mode M0 | |||
|---|---|---|---|
| Quadrant | BADHDUFLAG | Total packets | Discarded packets |
| A | 0 | 9842 | 2 |
| B | 0 | 11263 | 1 |
| C | 0 | 10522 | 1 |
| D | 0 | 11013 | 1 |
| Quadrant | Total seconds | Saturated seconds | Saturation percentage |
|---|---|---|---|
| A | 4889 | 4 | 0.081816% |
| B | 4889 | 19 | 0.388628% |
| C | 4889 | 24 | 0.490898% |
| D | 4889 | 27 | 0.552260% |
Noise dominated data is calculated using 1-second bins in cleaned event files. If a bin has >2000 counts, and if more than 50% of those come from <1% of pixels, then it is considered to be noise-dominated and hence unusable.
| Quadrant | # 1 sec bins | Bins with >0 counts | Bins with >2000 counts | High rate bins dominated by noise | Noise dominated (total time) | Noise dominated (detector-on time) | Marked lightcurve |
|---|---|---|---|---|---|---|---|
| A | 7045 | 4890 | 0 | 0 | 0.00% | 0.00% | 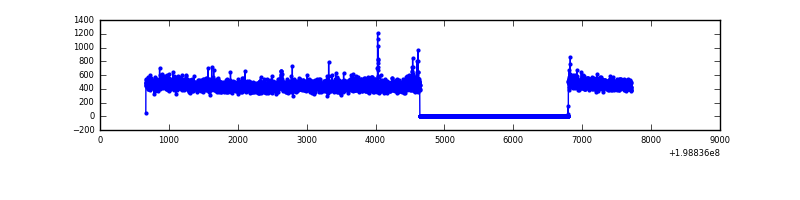 |
| B | 7045 | 4890 | 8 | 8 | 0.11% | 0.16% | 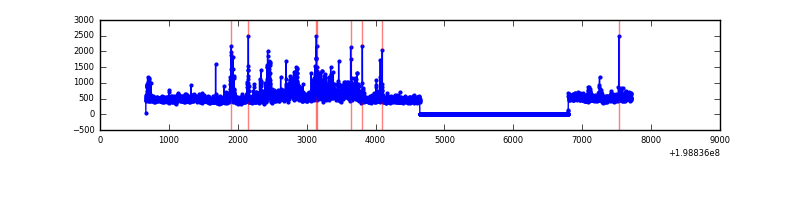 |
| C | 7045 | 4890 | 17 | 17 | 0.24% | 0.35% | 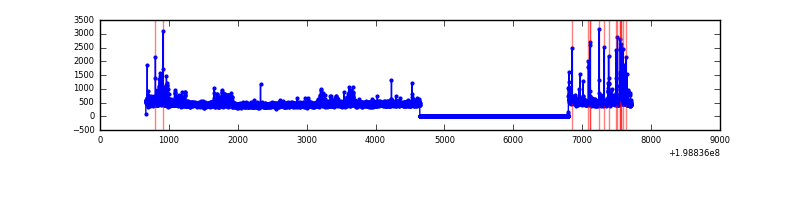 |
| D | 7045 | 4890 | 26 | 26 | 0.37% | 0.53% | 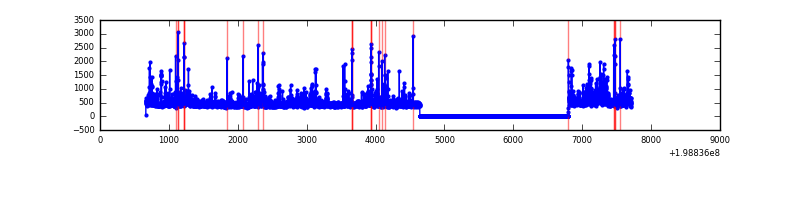 |
Top three noisy pixels from each quadrant. If the there are fewer than three noisy pixels in the level2.evt file, extra rows are filled as -1
| Pixel properties | Quadrant properties | ||||||
|---|---|---|---|---|---|---|---|
| Quadrant | DetID | PixID | Counts | Sigma | Mean | Median | Sigma |
| A | 13 | 251 | 16949 | 144.72 | 558 | 547 | 113.3 |
| A | 0 | 50 | 15547 | 132.35 | 558 | 547 | 113.3 |
| A | 12 | 247 | 12453 | 105.05 | 558 | 547 | 113.3 |
| B | 15 | 204 | 318476 | 3064.51 | 558 | 547 | 103.7 |
| B | 0 | 219 | 75992 | 727.21 | 558 | 547 | 103.7 |
| B | 6 | 36 | 69405 | 663.72 | 558 | 547 | 103.7 |
| C | 1 | 192 | 214582 | 1751.29 | 533 | 536 | 122.2 |
| C | 6 | 80 | 53645 | 434.53 | 533 | 536 | 122.2 |
| C | 1 | 16 | 15205 | 120.02 | 533 | 536 | 122.2 |
| D | 2 | 152 | 133946 | 1051.93 | 537 | 524 | 126.8 |
| D | 12 | 217 | 132054 | 1037.02 | 537 | 524 | 126.8 |
| D | 7 | 80 | 60929 | 476.25 | 537 | 524 | 126.8 |
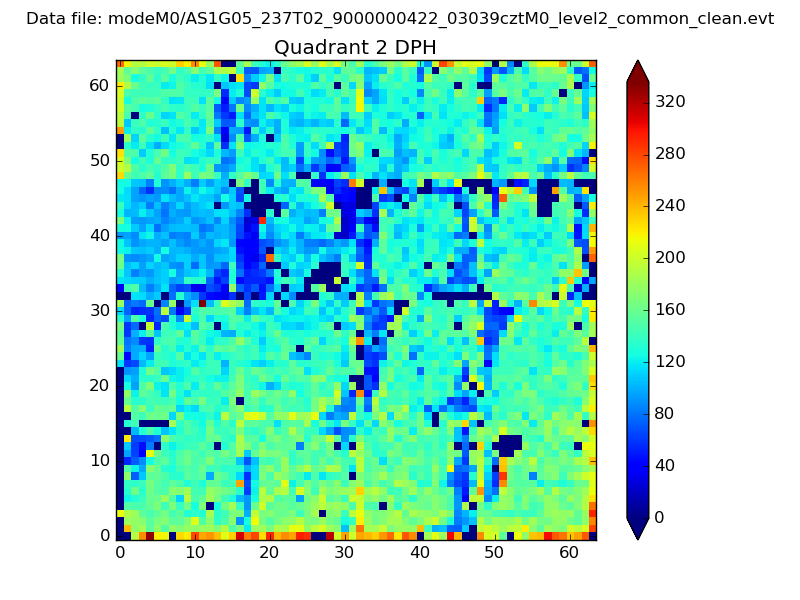
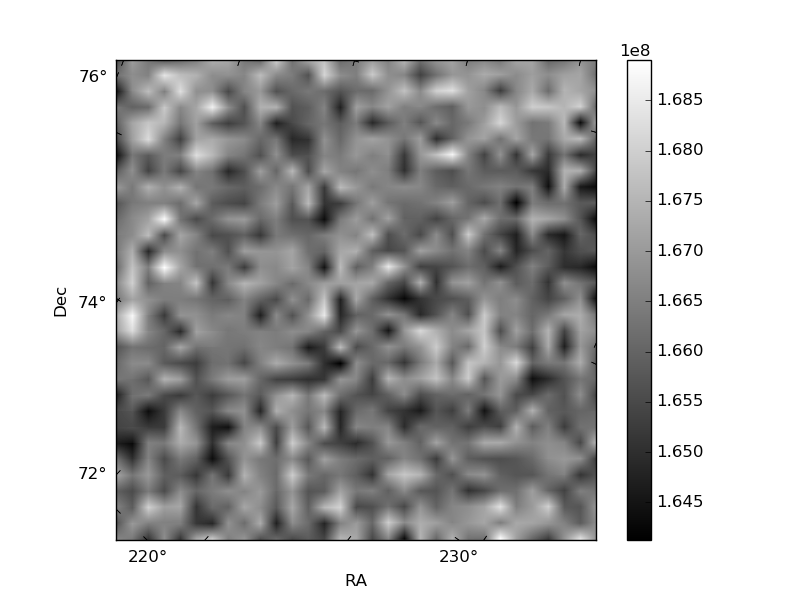
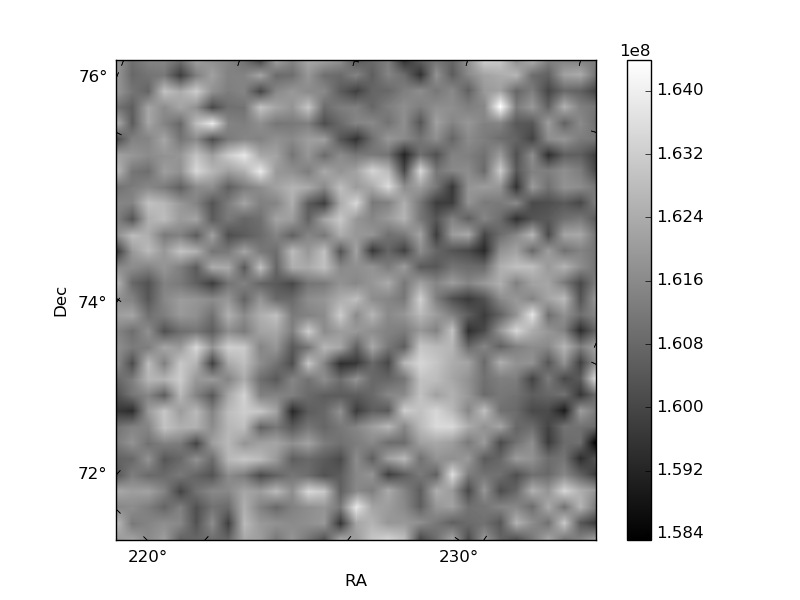
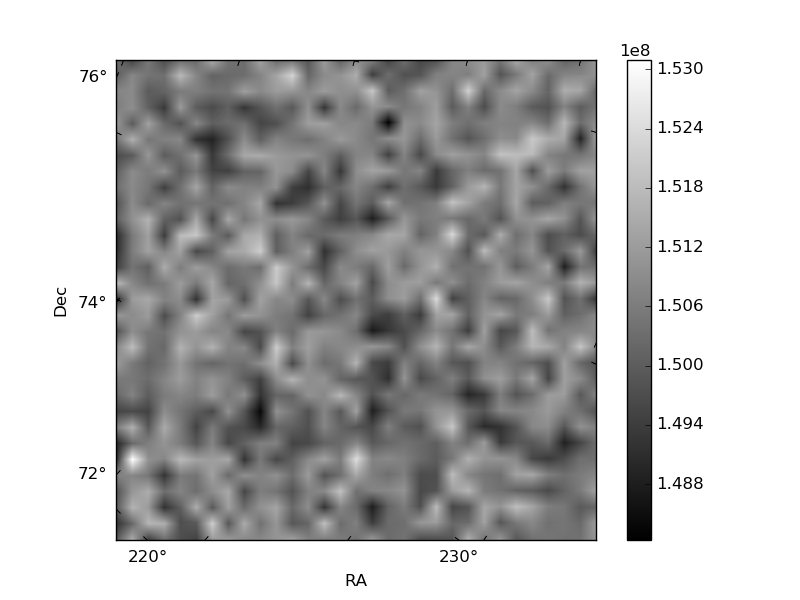
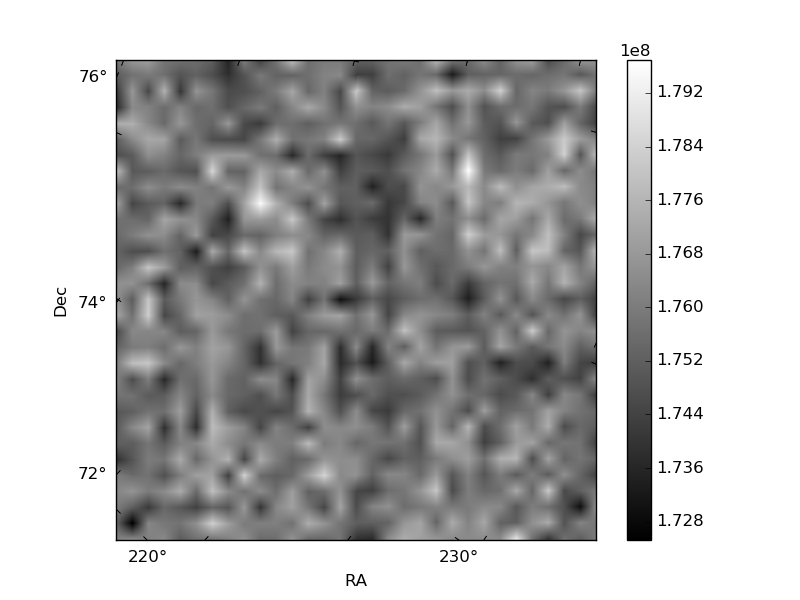
Histogram calculated using DETX and DETY for each event in the final _common_clean file
| Quadrant A | 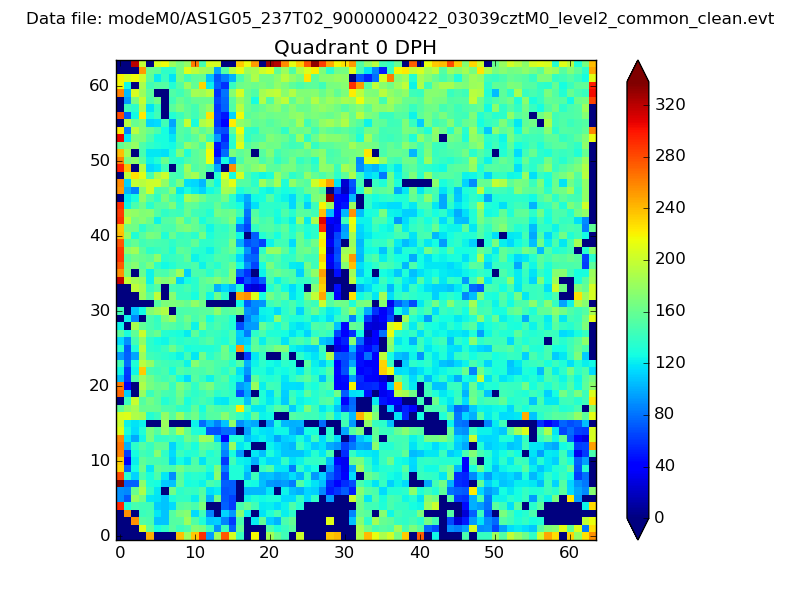 |
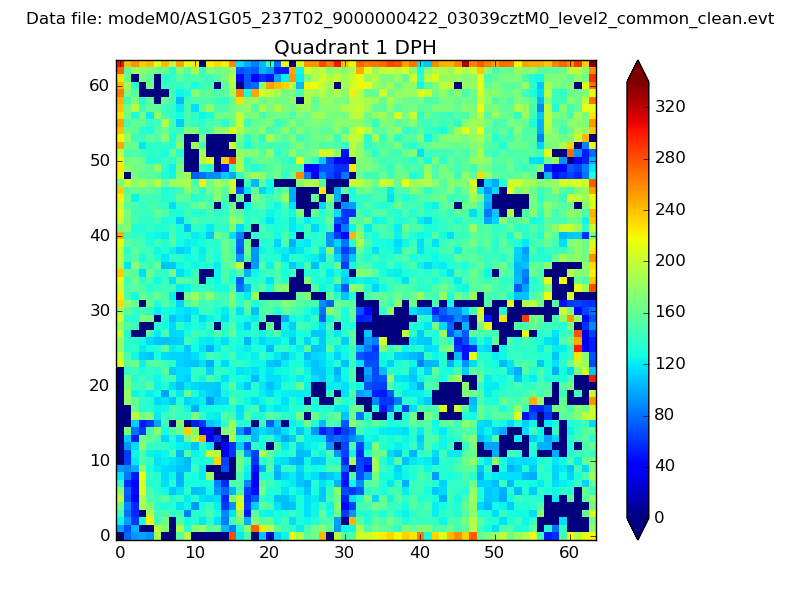 |
Quadrant B |
|---|---|---|---|
| Quadrant D | 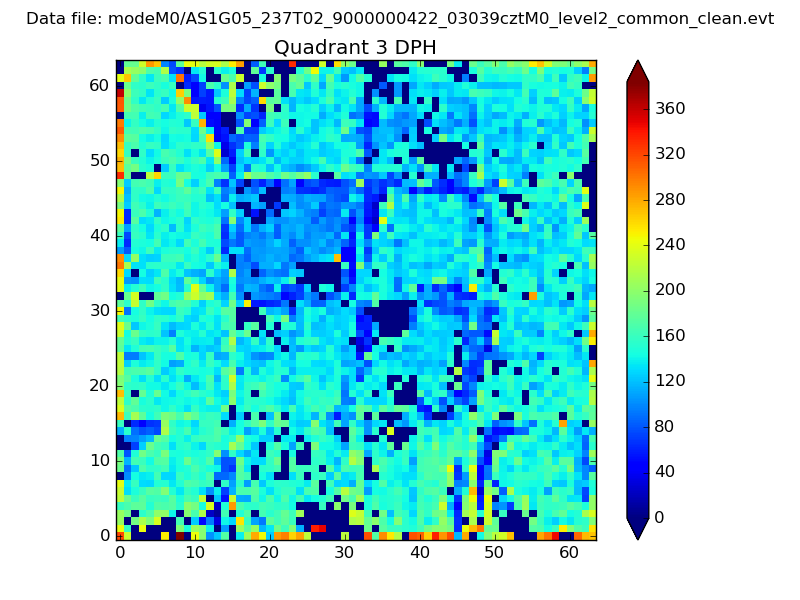 |
 |
Quadrant C |
| Plot type | Count rate plots | Images |
|---|---|---|
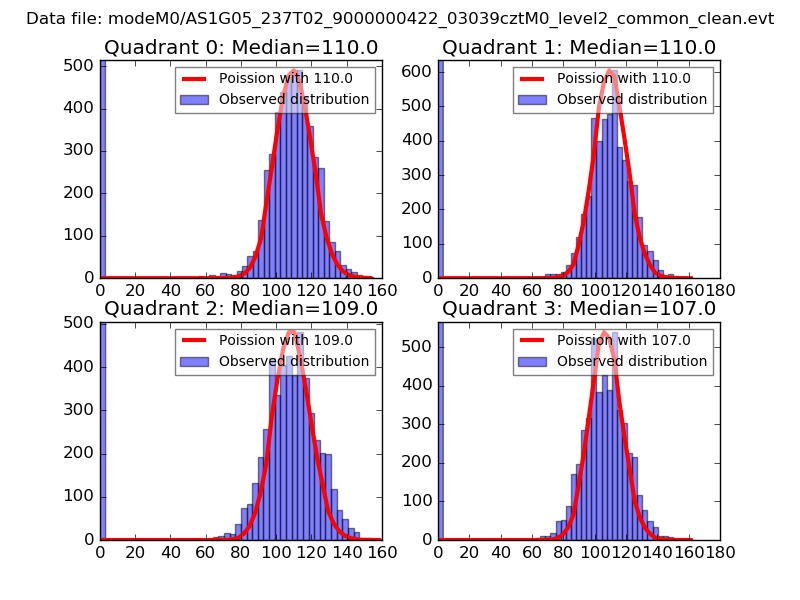
| Comparison with Poisson distribution Blue bars denote a histogram of data divided into 1 sec bins. Red curve is a Poisson curve with rate = median count rate of data. |
 |
 |
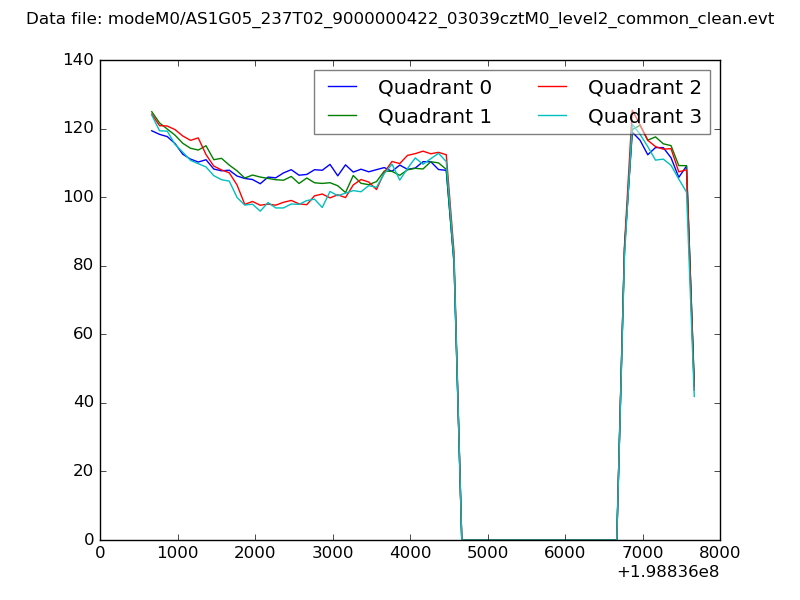
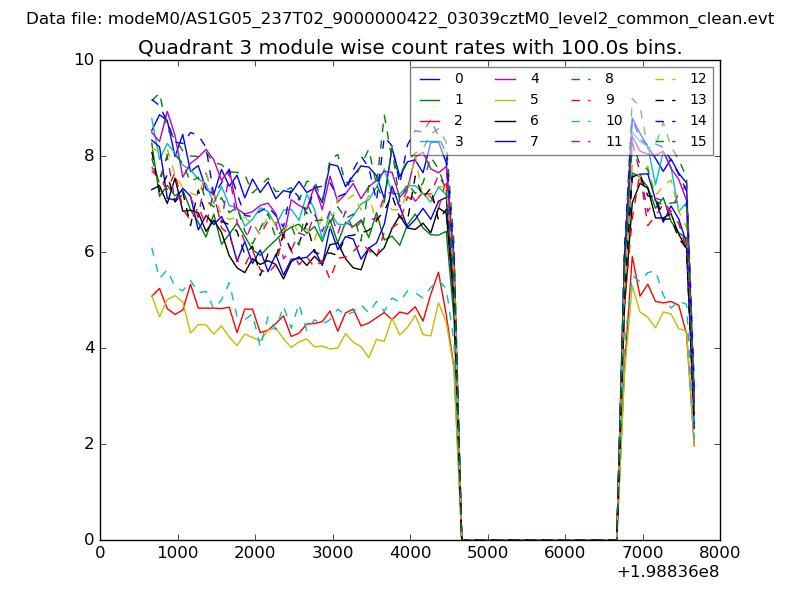
| Quadrant-wise count rates Data is divided into 100 sec bins |
 |
|
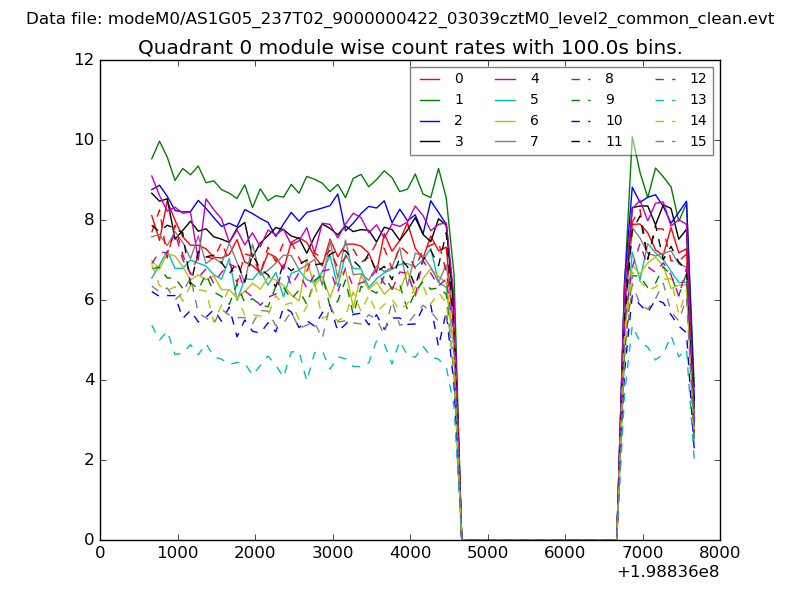
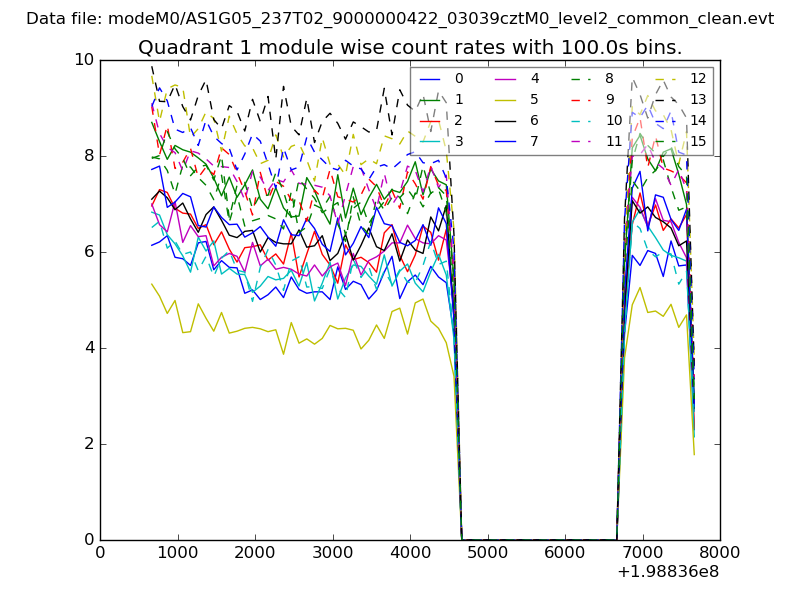
| Module-wise count rates for Quadrant A Data is divided into 100 sec bins |
 |
 |
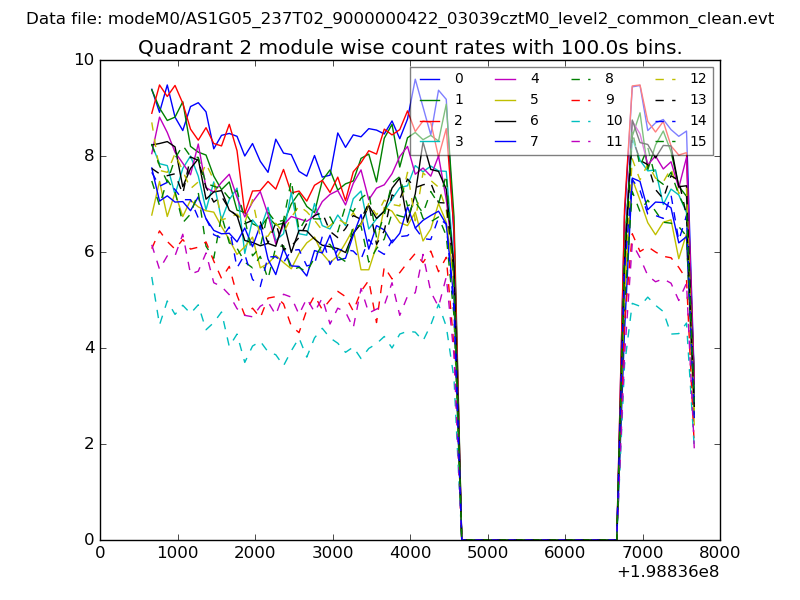
| Module-wise count rates for Quadrant B Data is divided into 100 sec bins |
 |
 |
| Module-wise count rates for Quadrant C Data is divided into 100 sec bins |
 |
 |
| Module-wise count rates for Quadrant D Data is divided into 100 sec bins |
 |
 |
| Parameter | Plot |
|---|---|
| CZT HV Monitor | 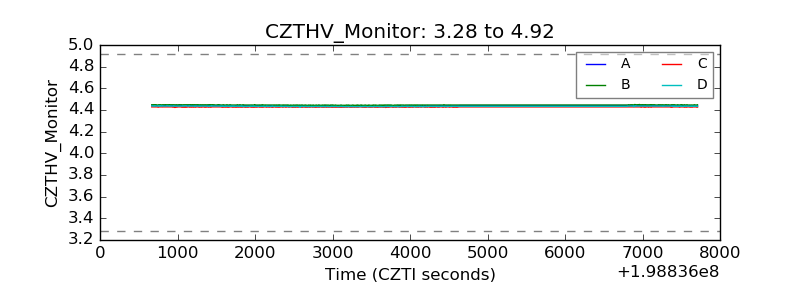 |
| D_VDD | 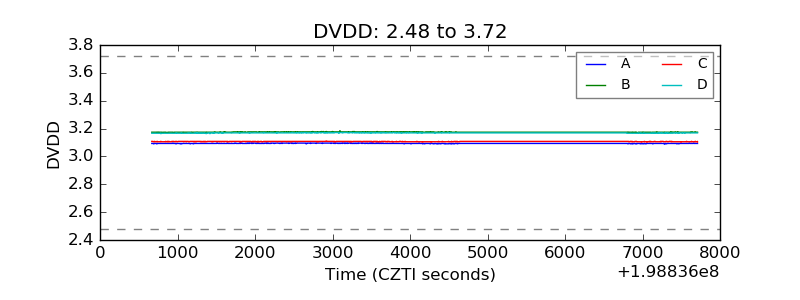 |
| Temperature 1 | 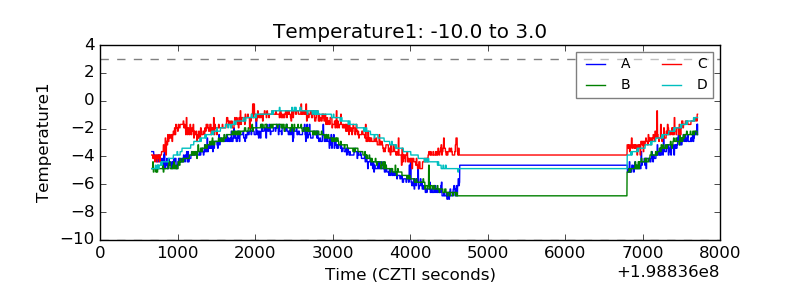 |
| Veto HV Monitor | 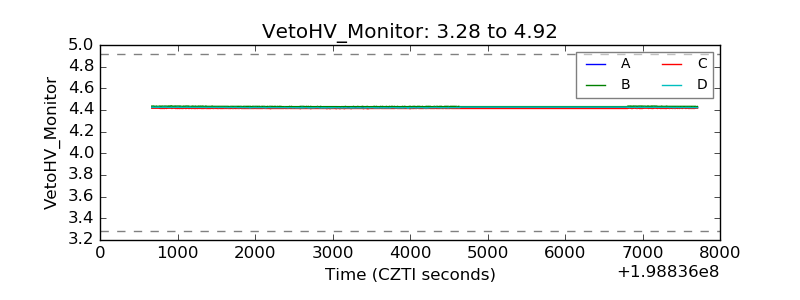 |
| Veto LLD | 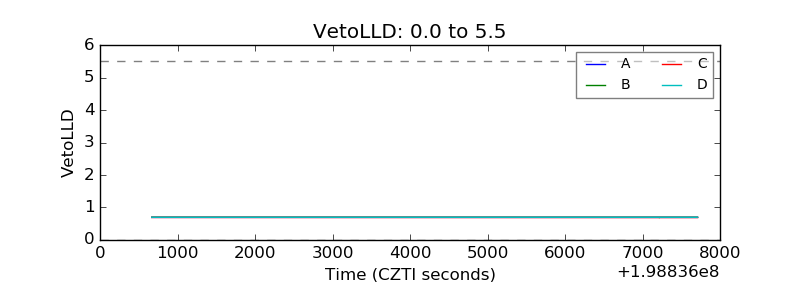 |
| Alpha Counter | 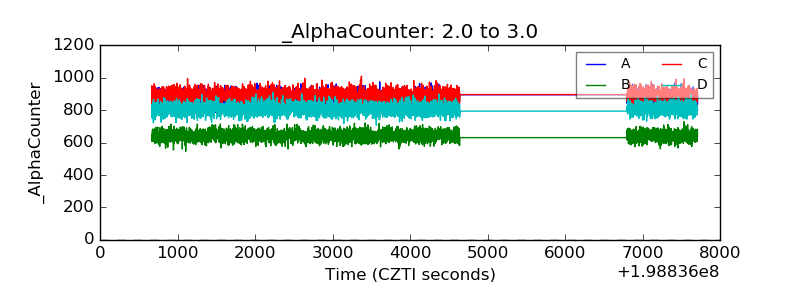 |
| _CPM_Rate | 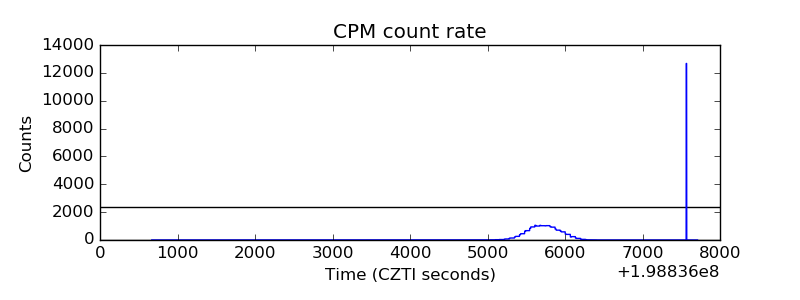 |
| CZT Counter | 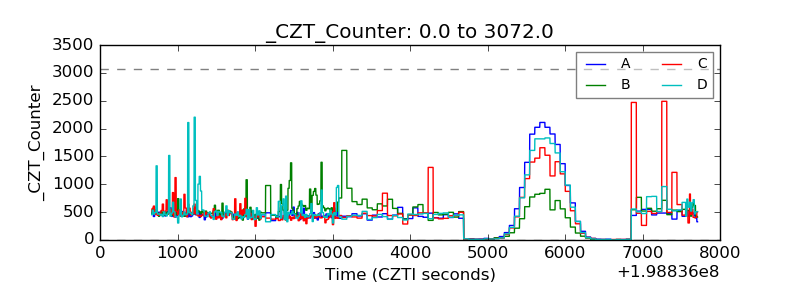 |
| +2.5 Volts monitor |  |
| +5 Volts monitor |  |
| Veto Counter | 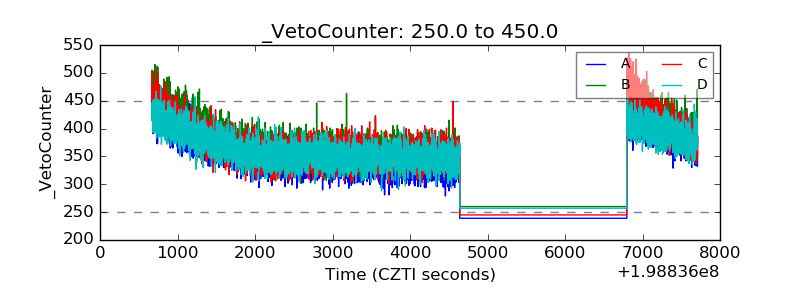 |