| Param | Original file | Final file |
|---|---|---|
| Filename | modeM0/AS1G05_237T02_9000000422_03041cztM0_level2.evt | modeM0/AS1G05_237T02_9000000422_03041cztM0_level2_quad_clean.evt |
| Size (bytes) | 417,528,000 | 82,385,280 |
| Size | 398.2 MB | 78.6 MB |
| Events in quadrant A | 2,288,211 | 548,684 |
| Events in quadrant B | 4,196,855 | 530,476 |
| Events in quadrant C | 3,021,798 | 517,836 |
| Events in quadrant D | 2,780,906 | 529,758 |
| Mode SS | |||
|---|---|---|---|
| Quadrant | BADHDUFLAG | Total packets | Discarded packets |
| A | 0 | 106 | 0 |
| B | 0 | 106 | 0 |
| C | 0 | 106 | 0 |
| D | 0 | 106 | 0 |
| Mode M9 | |||
|---|---|---|---|
| Quadrant | BADHDUFLAG | Total packets | Discarded packets |
| A | 0 | 22 | 0 |
| B | 0 | 22 | 0 |
| C | 0 | 22 | 0 |
| D | 0 | 23 | 0 |
| Mode M0 | |||
|---|---|---|---|
| Quadrant | BADHDUFLAG | Total packets | Discarded packets |
| A | 0 | 10592 | 3 |
| B | 0 | 16038 | 2 |
| C | 0 | 12832 | 2 |
| D | 0 | 12020 | 2 |
| Quadrant | Total seconds | Saturated seconds | Saturation percentage |
|---|---|---|---|
| A | 5253 | 7 | 0.133257% |
| B | 5253 | 352 | 6.700933% |
| C | 5253 | 358 | 6.815153% |
| D | 5253 | 59 | 1.123168% |
Noise dominated data is calculated using 1-second bins in cleaned event files. If a bin has >2000 counts, and if more than 50% of those come from <1% of pixels, then it is considered to be noise-dominated and hence unusable.
| Quadrant | # 1 sec bins | Bins with >0 counts | Bins with >2000 counts | High rate bins dominated by noise | Noise dominated (total time) | Noise dominated (detector-on time) | Marked lightcurve |
|---|---|---|---|---|---|---|---|
| A | 7409 | 5254 | 0 | 0 | 0.00% | 0.00% | 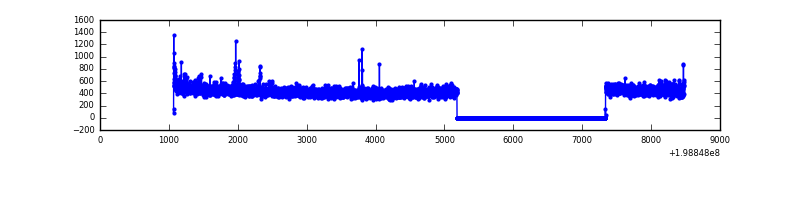 |
| B | 7409 | 5254 | 286 | 286 | 3.86% | 5.44% | 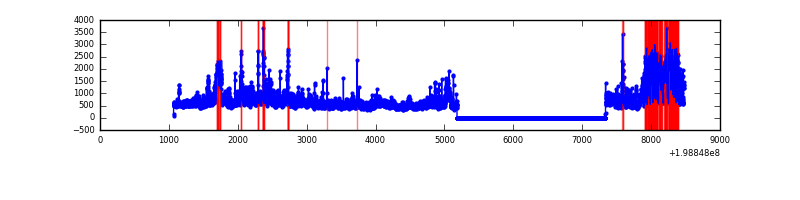 |
| C | 7409 | 5254 | 195 | 195 | 2.63% | 3.71% | 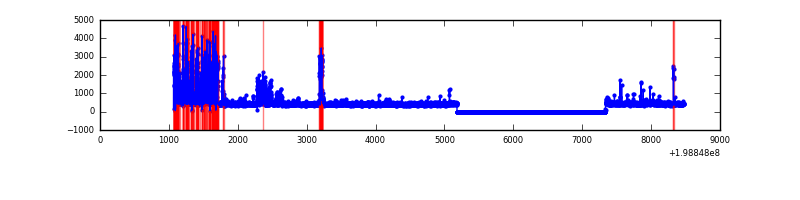 |
| D | 7409 | 5254 | 54 | 54 | 0.73% | 1.03% | 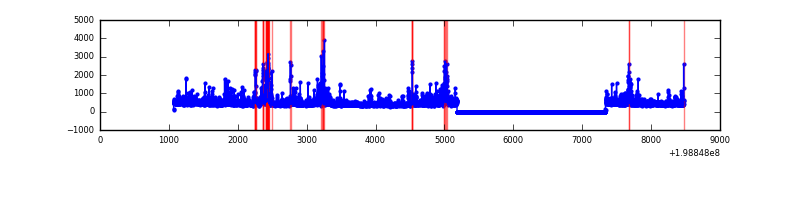 |
Top three noisy pixels from each quadrant. If the there are fewer than three noisy pixels in the level2.evt file, extra rows are filled as -1
| Pixel properties | Quadrant properties | ||||||
|---|---|---|---|---|---|---|---|
| Quadrant | DetID | PixID | Counts | Sigma | Mean | Median | Sigma |
| A | 12 | 247 | 31668 | 268.82 | 573 | 561 | 115.7 |
| A | 0 | 50 | 15140 | 125.99 | 573 | 561 | 115.7 |
| A | 13 | 251 | 8785 | 71.07 | 573 | 561 | 115.7 |
| B | 15 | 204 | 1362060 | 12573.89 | 568 | 555 | 108.3 |
| B | 2 | 249 | 165270 | 1521.19 | 568 | 555 | 108.3 |
| B | 0 | 230 | 160653 | 1478.55 | 568 | 555 | 108.3 |
| C | 1 | 192 | 730276 | 5907.82 | 535 | 537 | 123.5 |
| C | 6 | 80 | 156013 | 1258.7 | 535 | 537 | 123.5 |
| C | 1 | 16 | 12671 | 98.23 | 535 | 537 | 123.5 |
| D | 10 | 213 | 198110 | 1493.13 | 555 | 542 | 132.3 |
| D | 13 | 70 | 102229 | 768.51 | 555 | 542 | 132.3 |
| D | 2 | 152 | 86229 | 647.59 | 555 | 542 | 132.3 |
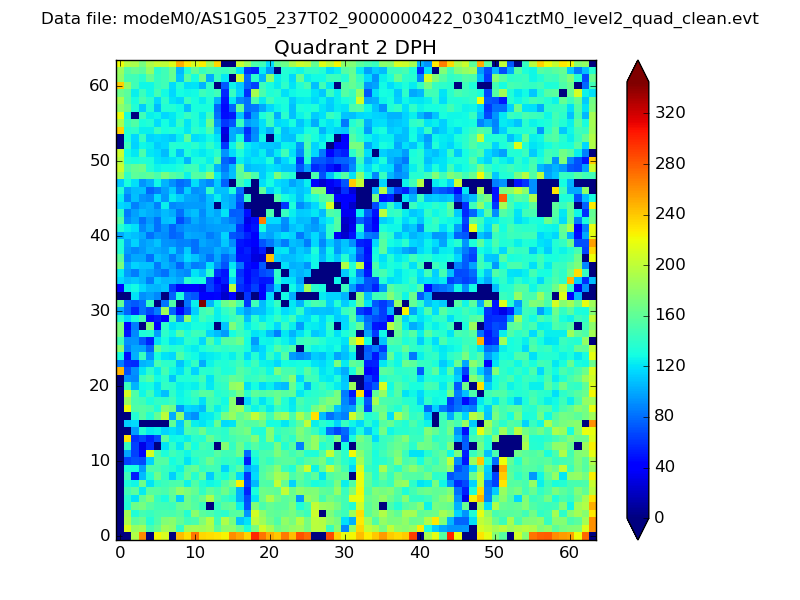
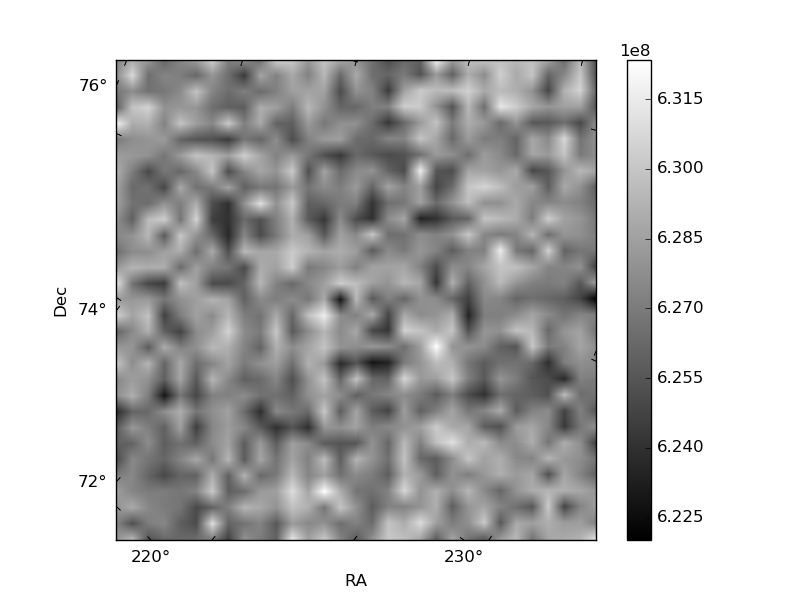
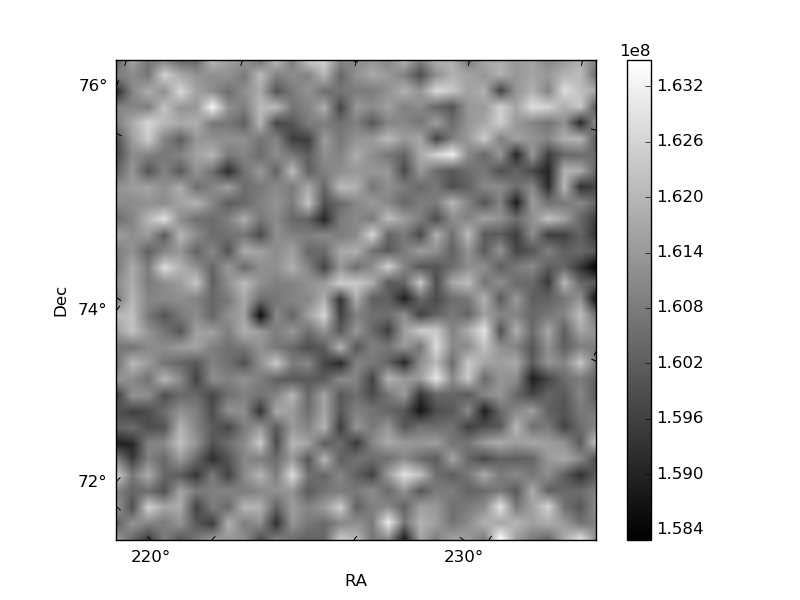
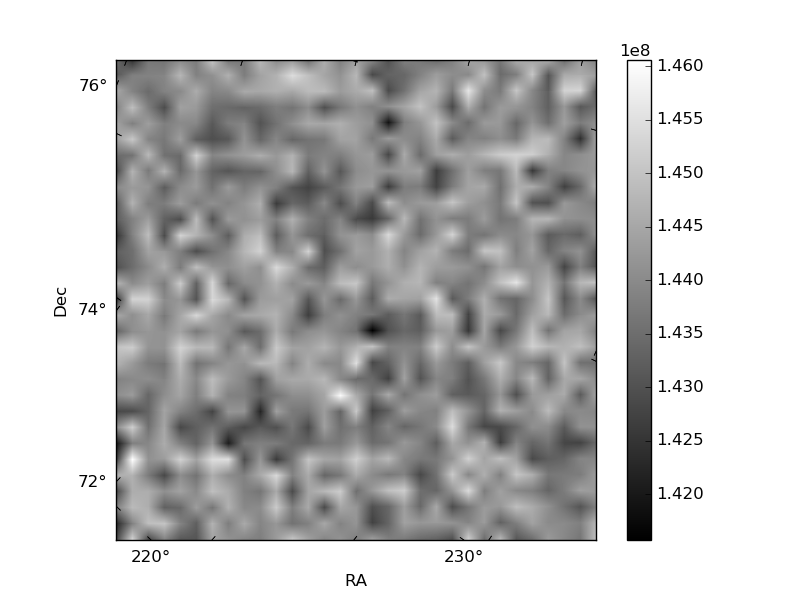
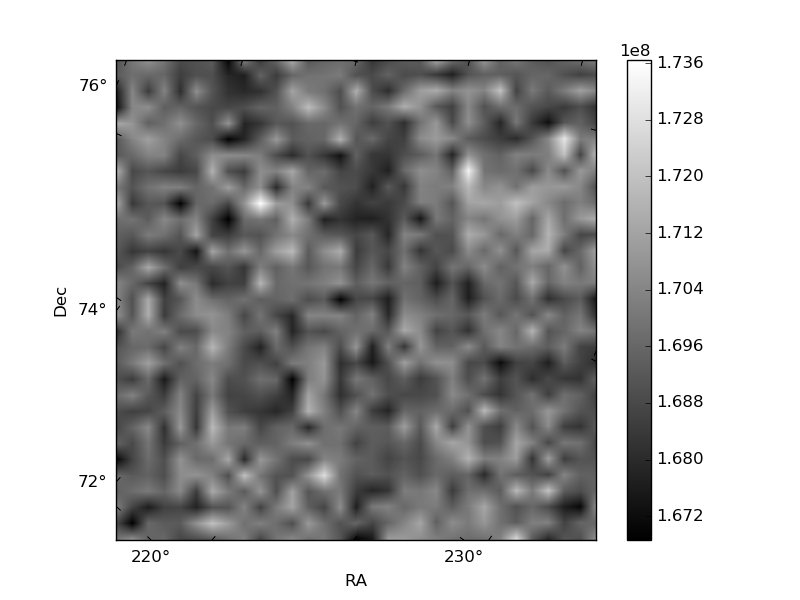
Histogram calculated using DETX and DETY for each event in the final _common_clean file
| Quadrant A | 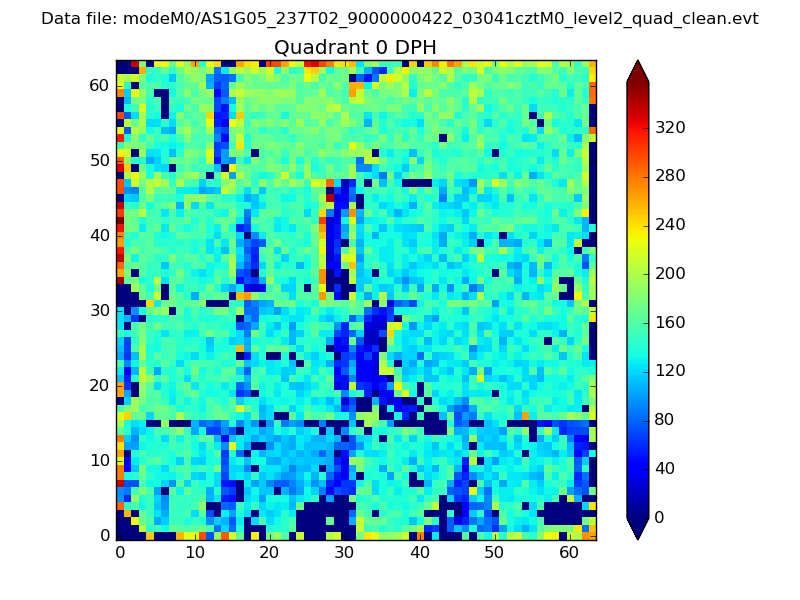 |
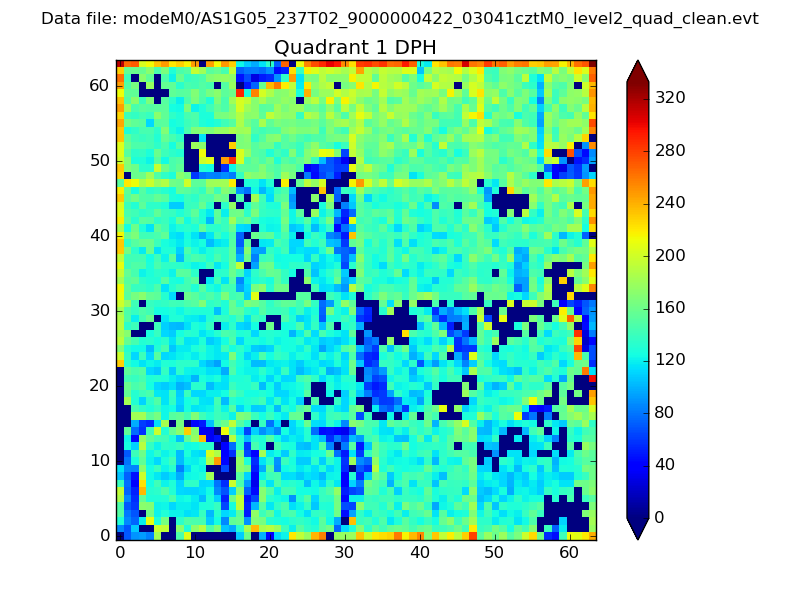 |
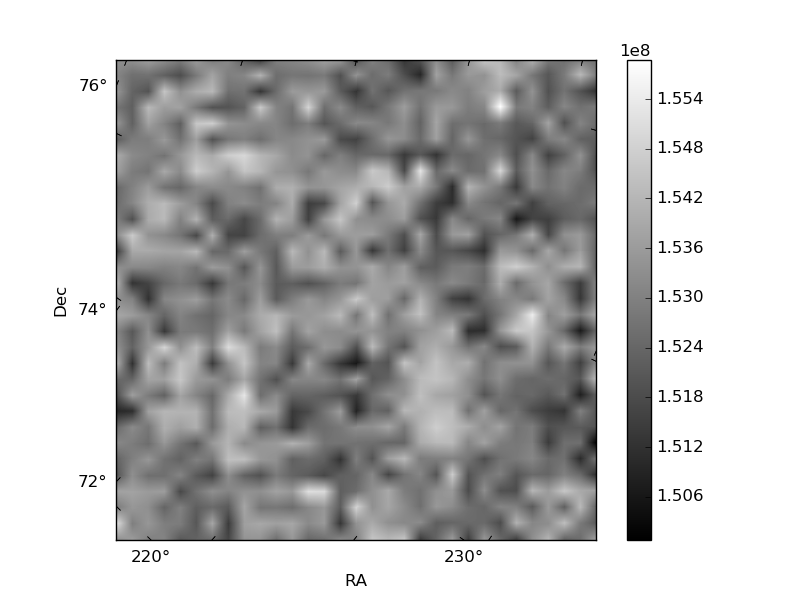
Quadrant B |
|---|---|---|---|
| Quadrant D | 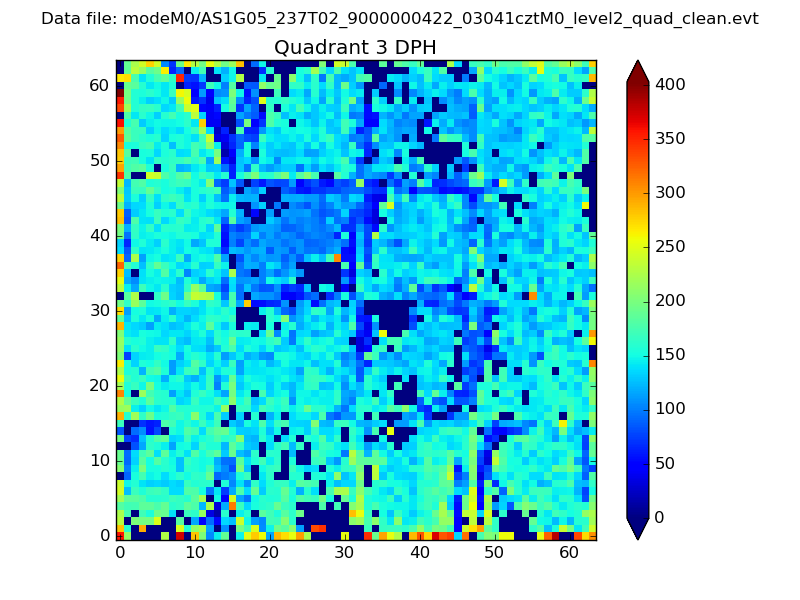 |
 |
Quadrant C |
| Plot type | Count rate plots | Images |
|---|---|---|
| Comparison with Poisson distribution Blue bars denote a histogram of data divided into 1 sec bins. Red curve is a Poisson curve with rate = median count rate of data. |
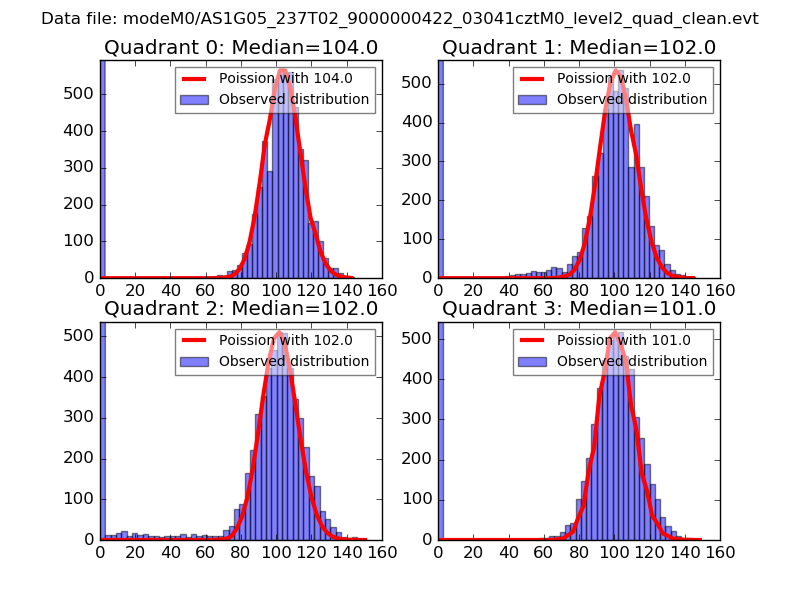 |
 |
| Quadrant-wise count rates Data is divided into 100 sec bins |
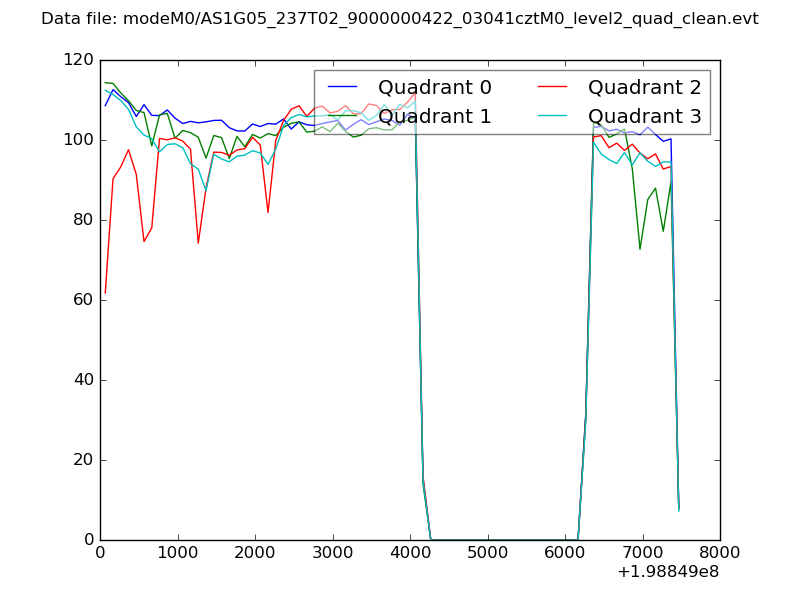 |
|
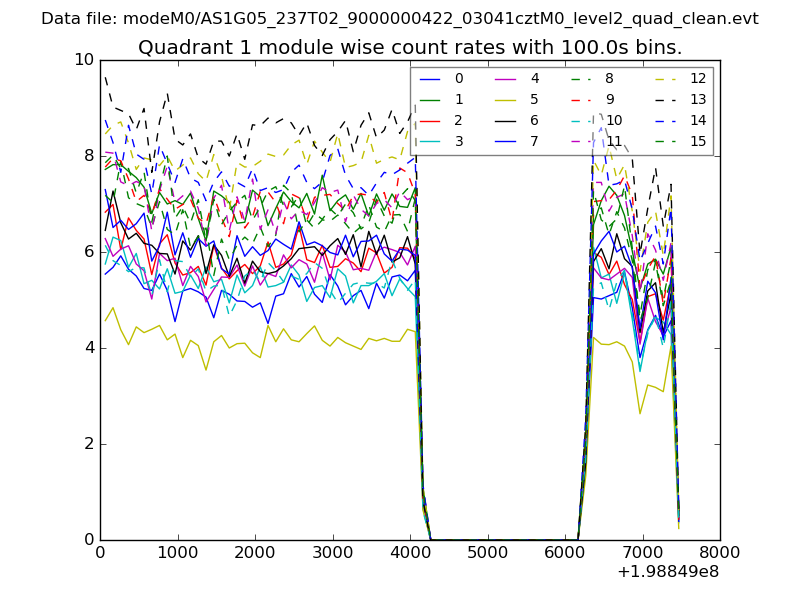
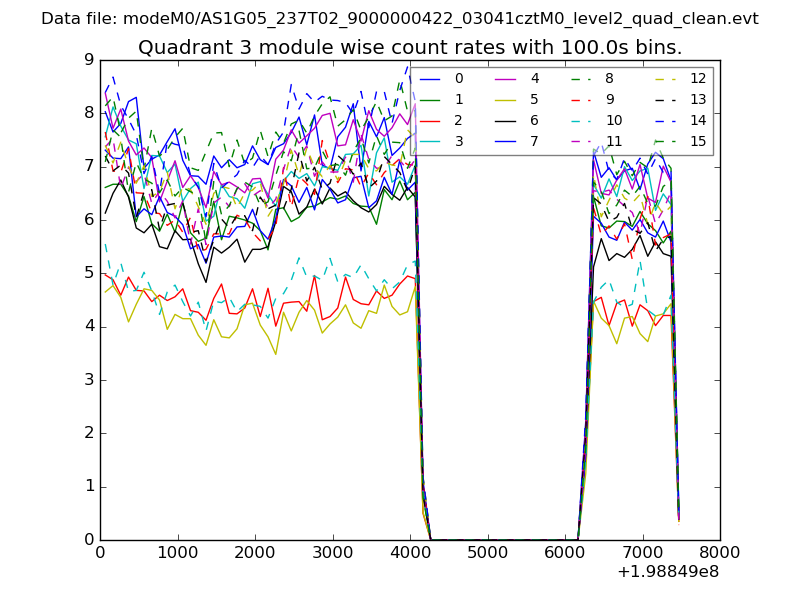
| Module-wise count rates for Quadrant A Data is divided into 100 sec bins |
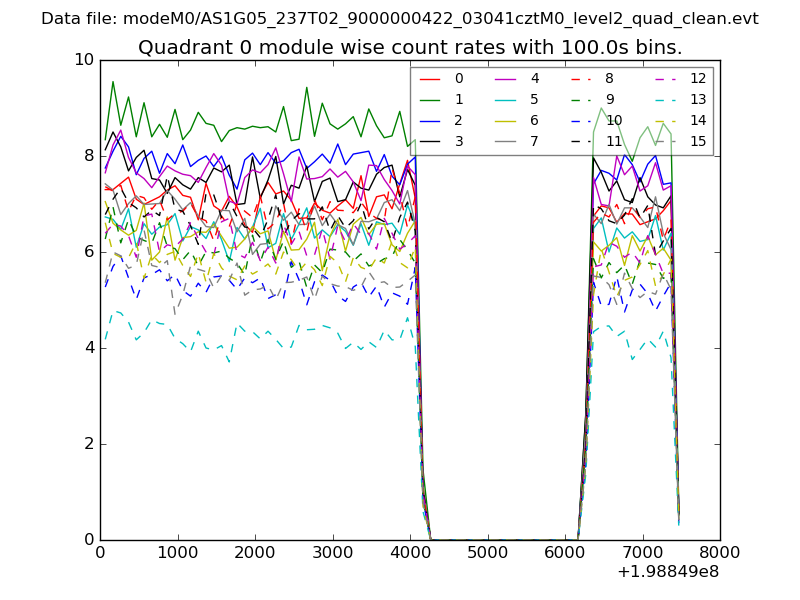 |
 |
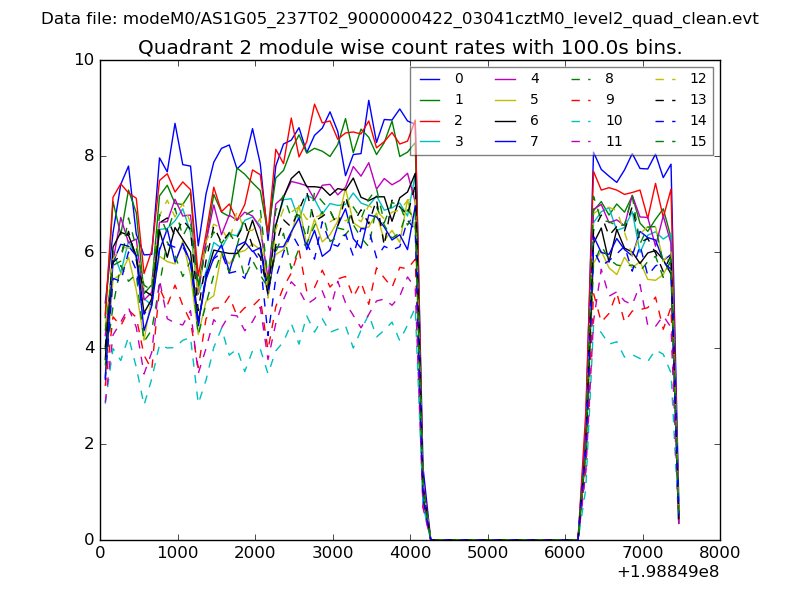
| Module-wise count rates for Quadrant B Data is divided into 100 sec bins |
 |
 |
| Module-wise count rates for Quadrant C Data is divided into 100 sec bins |
 |
 |
| Module-wise count rates for Quadrant D Data is divided into 100 sec bins |
 |
 |
| Parameter | Plot |
|---|---|
| CZT HV Monitor | 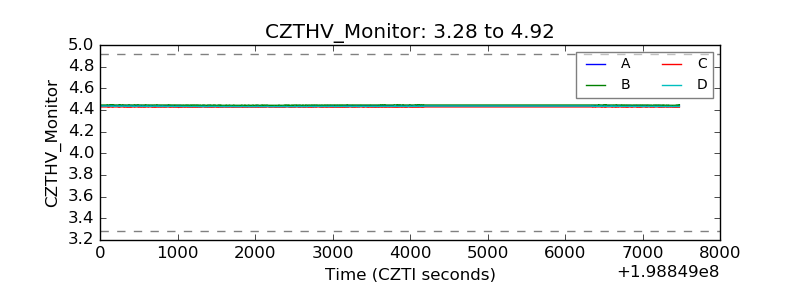 |
| D_VDD | 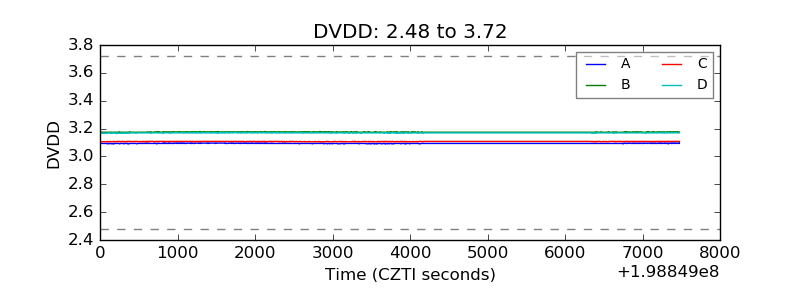 |
| Temperature 1 | 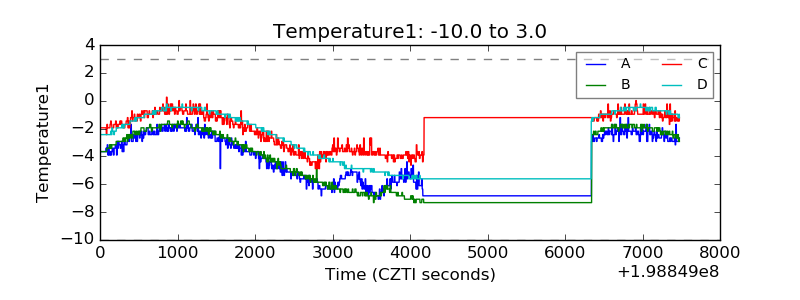 |
| Veto HV Monitor | 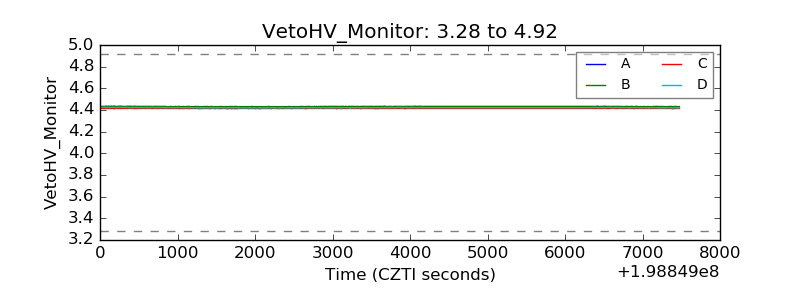 |
| Veto LLD | 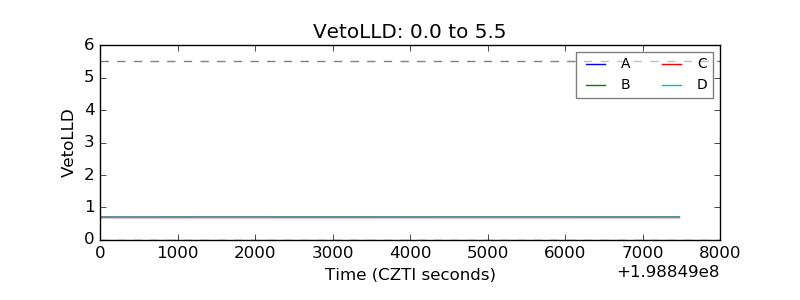 |
| Alpha Counter | 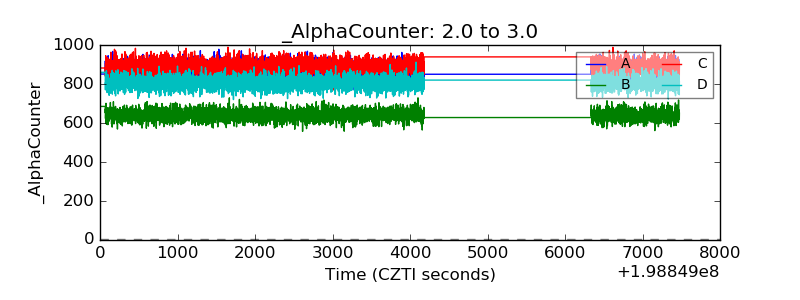 |
| _CPM_Rate | 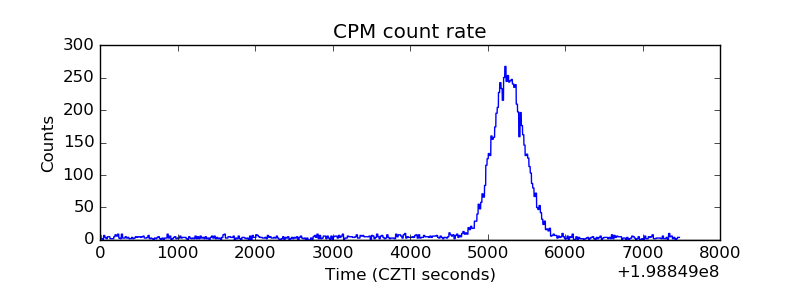 |
| CZT Counter | 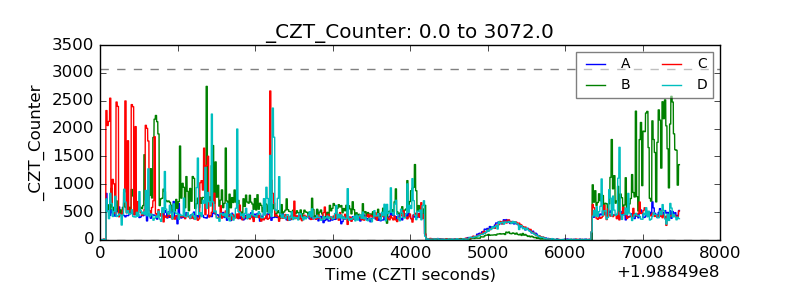 |
| +2.5 Volts monitor |  |
| +5 Volts monitor |  |
| _ROLL_ROT | 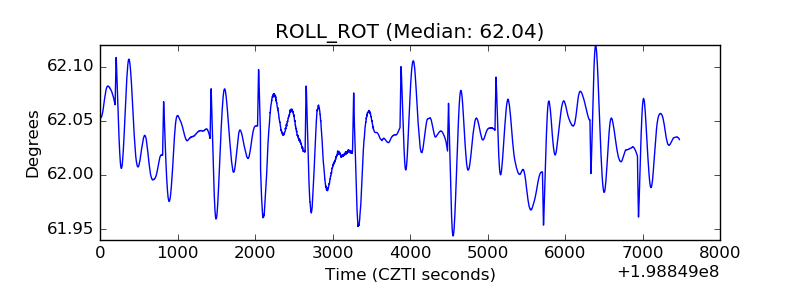 |
| _Roll_DEC | 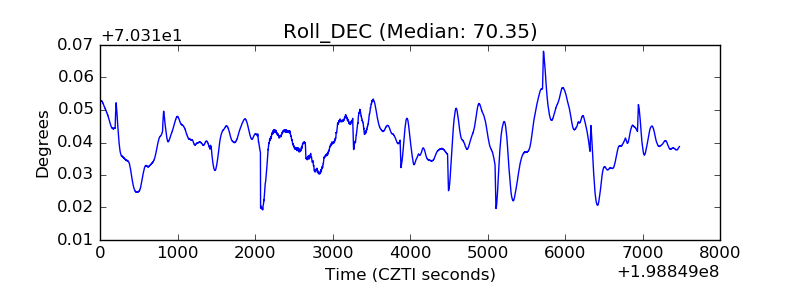 |
| _Roll_RA | 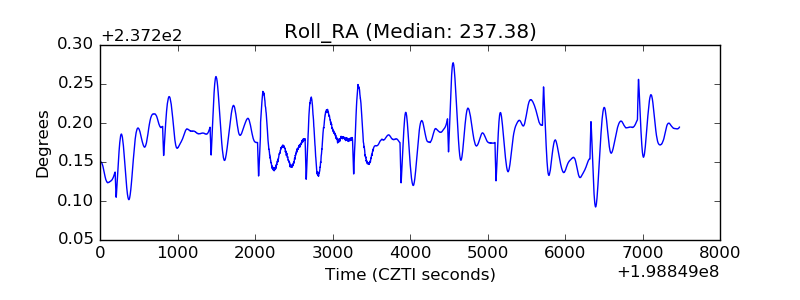 |
| Veto Counter | 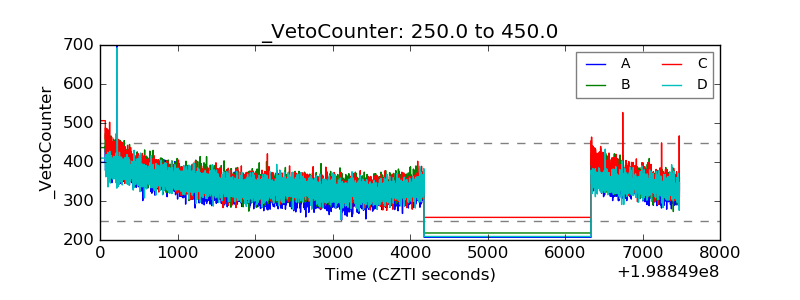 |