| Param | Original file | Final file |
|---|---|---|
| Filename | modeM0/AS1G05_237T02_9000000422_03045cztM0_level2.evt | modeM0/AS1G05_237T02_9000000422_03045cztM0_level2_quad_clean.evt |
| Size (bytes) | 317,010,240 | 77,912,640 |
| Size | 302.3 MB | 74.3 MB |
| Events in quadrant A | 2,278,492 | 490,854 |
| Events in quadrant B | 2,270,511 | 494,831 |
| Events in quadrant C | 2,155,034 | 513,656 |
| Events in quadrant D | 2,546,908 | 500,939 |
| Mode SS | |||
|---|---|---|---|
| Quadrant | BADHDUFLAG | Total packets | Discarded packets |
| A | 0 | 104 | 0 |
| B | 0 | 104 | 0 |
| C | 0 | 104 | 0 |
| D | 0 | 104 | 0 |
| Mode M9 | |||
|---|---|---|---|
| Quadrant | BADHDUFLAG | Total packets | Discarded packets |
| A | 0 | 26 | 1 |
| B | 0 | 25 | 0 |
| C | 0 | 27 | 2 |
| D | 0 | 28 | 2 |
| Mode M0 | |||
|---|---|---|---|
| Quadrant | BADHDUFLAG | Total packets | Discarded packets |
| A | 0 | 10850 | 3 |
| B | 0 | 10713 | 2 |
| C | 0 | 10396 | 2 |
| D | 0 | 11527 | 2 |
| Quadrant | Total seconds | Saturated seconds | Saturation percentage |
|---|---|---|---|
| A | 5127 | 26 | 0.507119% |
| B | 5127 | 20 | 0.390092% |
| C | 5127 | 4 | 0.078018% |
| D | 5127 | 42 | 0.819193% |
Noise dominated data is calculated using 1-second bins in cleaned event files. If a bin has >2000 counts, and if more than 50% of those come from <1% of pixels, then it is considered to be noise-dominated and hence unusable.
| Quadrant | # 1 sec bins | Bins with >0 counts | Bins with >2000 counts | High rate bins dominated by noise | Noise dominated (total time) | Noise dominated (detector-on time) | Marked lightcurve |
|---|---|---|---|---|---|---|---|
| A | 7282 | 5128 | 17 | 17 | 0.23% | 0.33% | 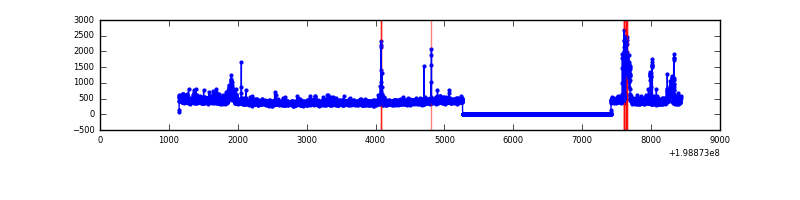 |
| B | 7282 | 5128 | 10 | 10 | 0.14% | 0.20% | 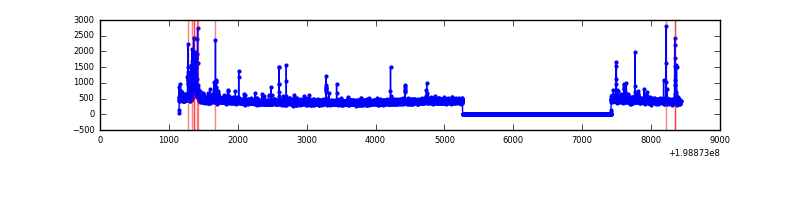 |
| C | 7282 | 5128 | 3 | 3 | 0.04% | 0.06% | 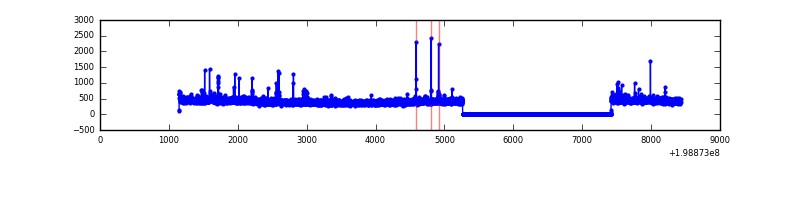 |
| D | 7282 | 5128 | 41 | 41 | 0.56% | 0.80% | 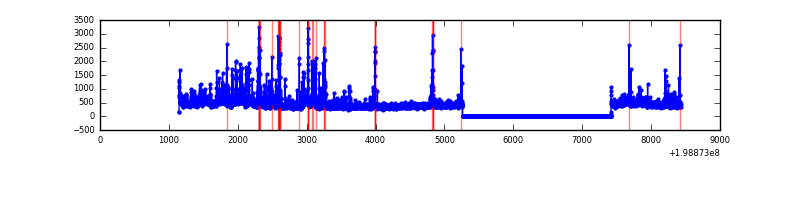 |
Top three noisy pixels from each quadrant. If the there are fewer than three noisy pixels in the level2.evt file, extra rows are filled as -1
| Pixel properties | Quadrant properties | ||||||
|---|---|---|---|---|---|---|---|
| Quadrant | DetID | PixID | Counts | Sigma | Mean | Median | Sigma |
| A | 14 | 249 | 179489 | 1688.45 | 519 | 507 | 106.0 |
| A | 12 | 247 | 64328 | 602.06 | 519 | 507 | 106.0 |
| A | 3 | 1 | 17558 | 160.85 | 519 | 507 | 106.0 |
| B | 7 | 252 | 76654 | 738.91 | 532 | 519 | 103.0 |
| B | 0 | 219 | 43530 | 417.43 | 532 | 519 | 103.0 |
| B | 0 | 230 | 28787 | 274.35 | 532 | 519 | 103.0 |
| C | 6 | 80 | 47145 | 385.4 | 521 | 522 | 121.0 |
| C | 4 | 207 | 22592 | 182.43 | 521 | 522 | 121.0 |
| C | 12 | 206 | 12727 | 100.89 | 521 | 522 | 121.0 |
| D | 2 | 152 | 275313 | 2188.73 | 511 | 497 | 125.6 |
| D | 13 | 114 | 161837 | 1284.97 | 511 | 497 | 125.6 |
| D | 13 | 70 | 39630 | 311.67 | 511 | 497 | 125.6 |
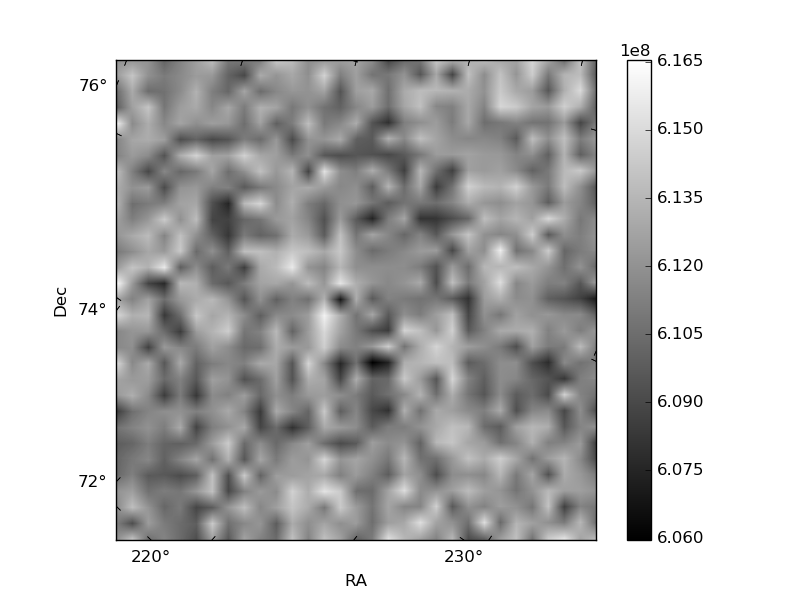
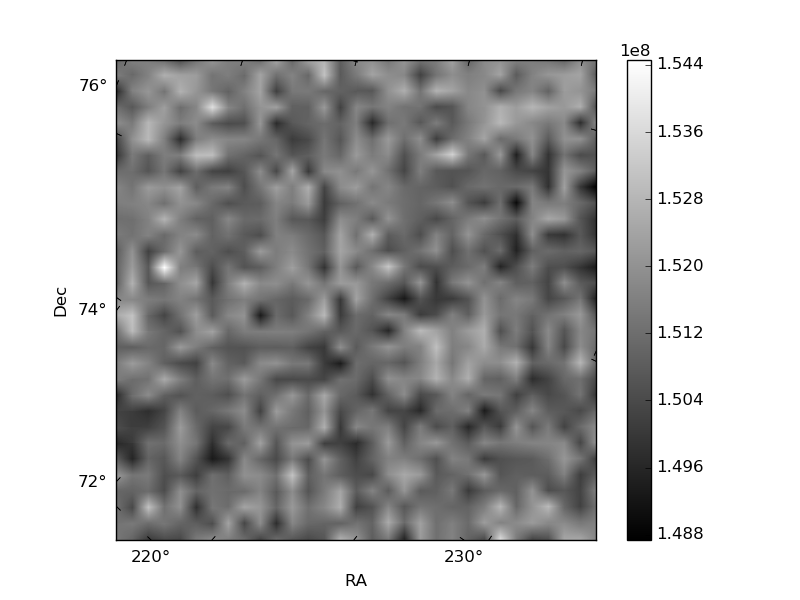
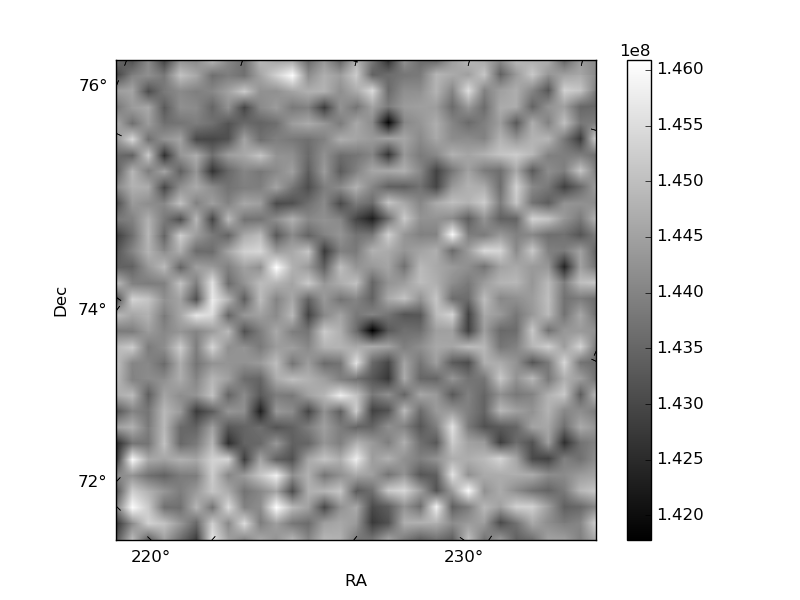
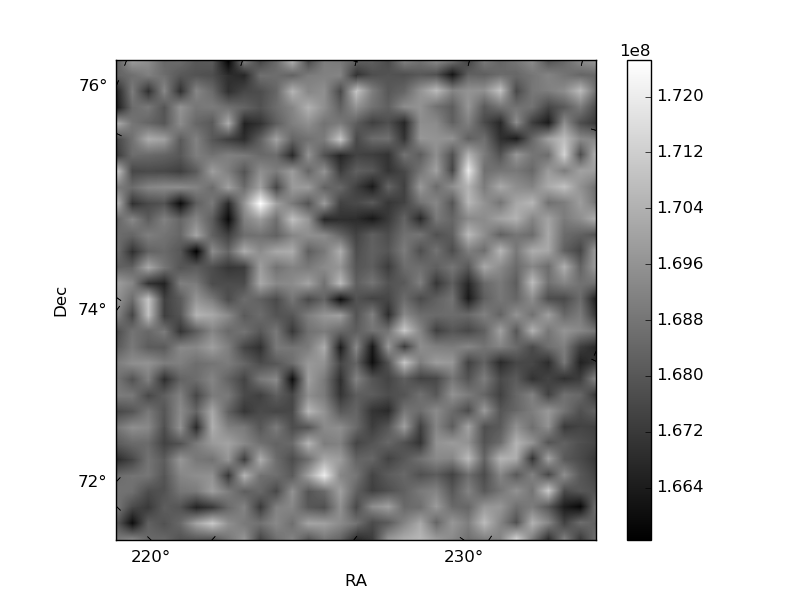
Histogram calculated using DETX and DETY for each event in the final _common_clean file
| Quadrant A | 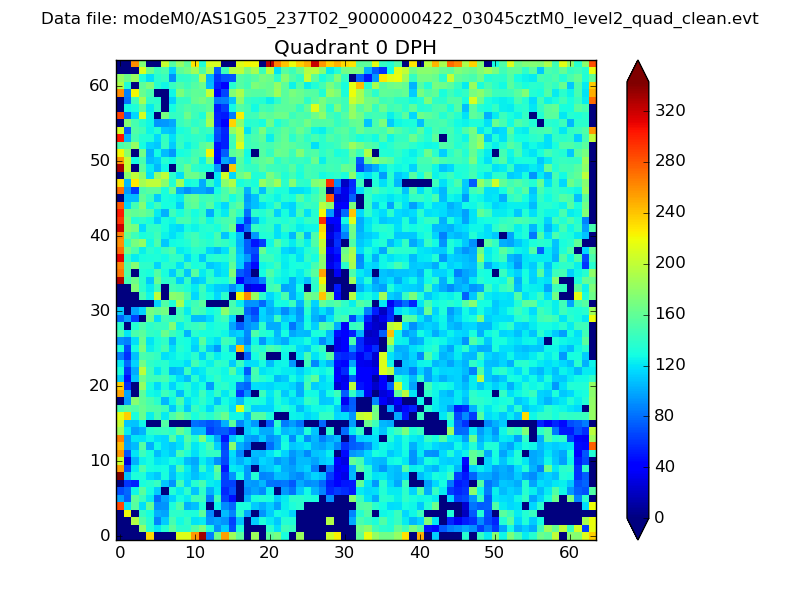 |
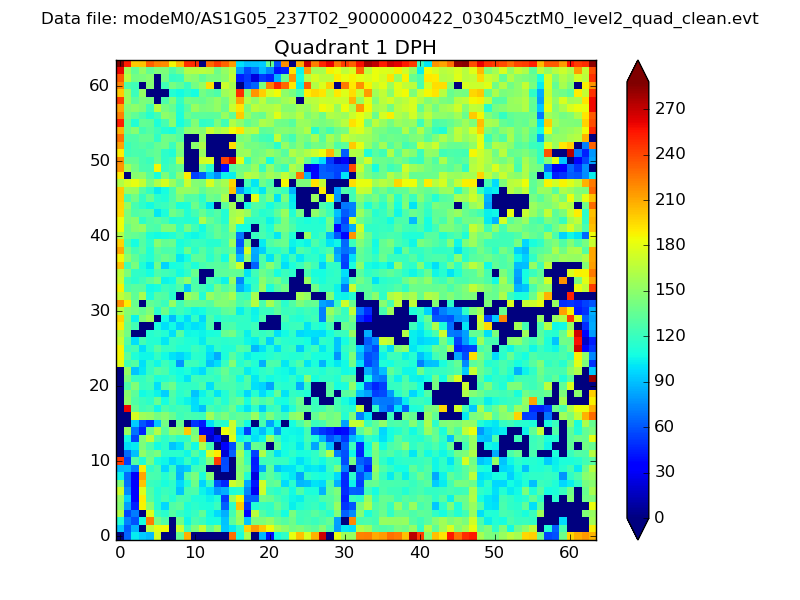 |
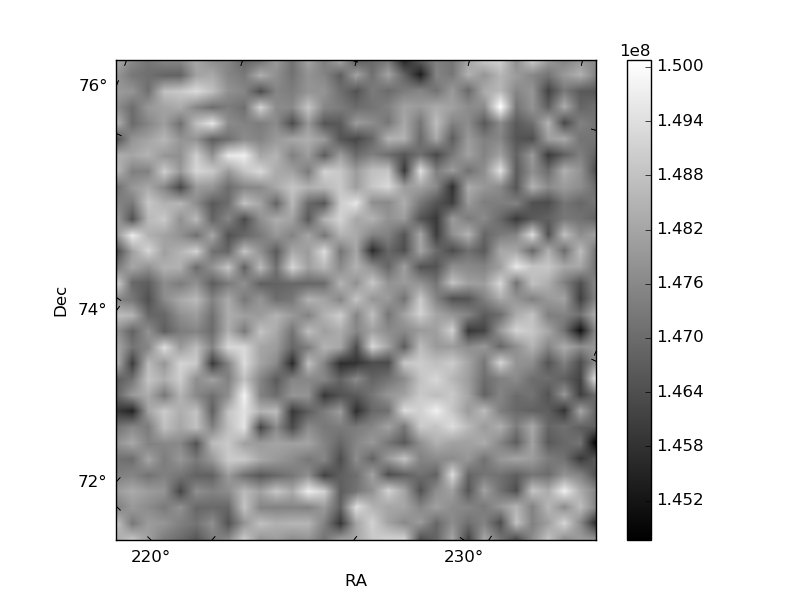
Quadrant B |
|---|---|---|---|
| Quadrant D | 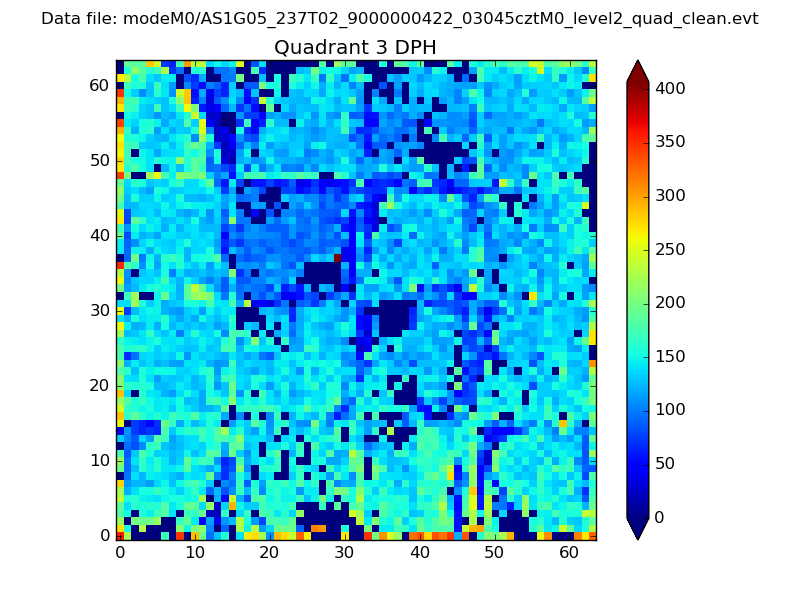 |
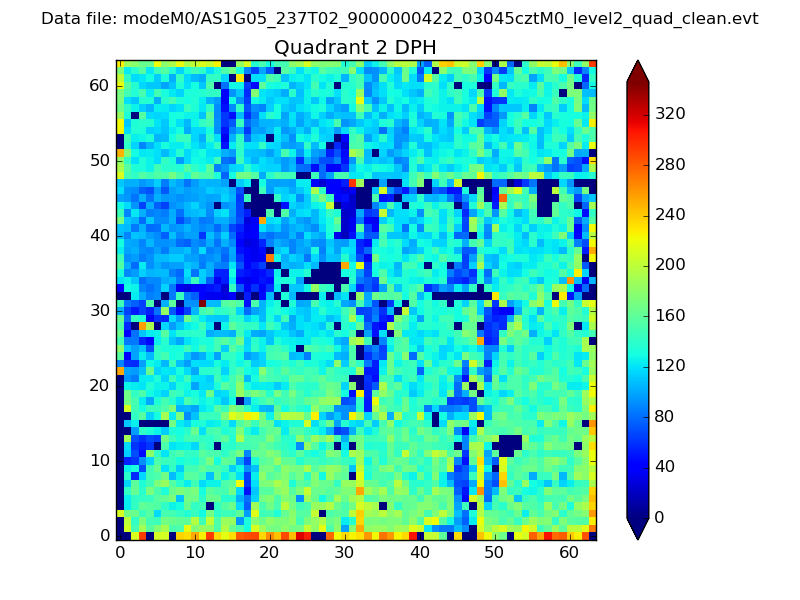 |
Quadrant C |
| Plot type | Count rate plots | Images |
|---|---|---|
| Comparison with Poisson distribution Blue bars denote a histogram of data divided into 1 sec bins. Red curve is a Poisson curve with rate = median count rate of data. |
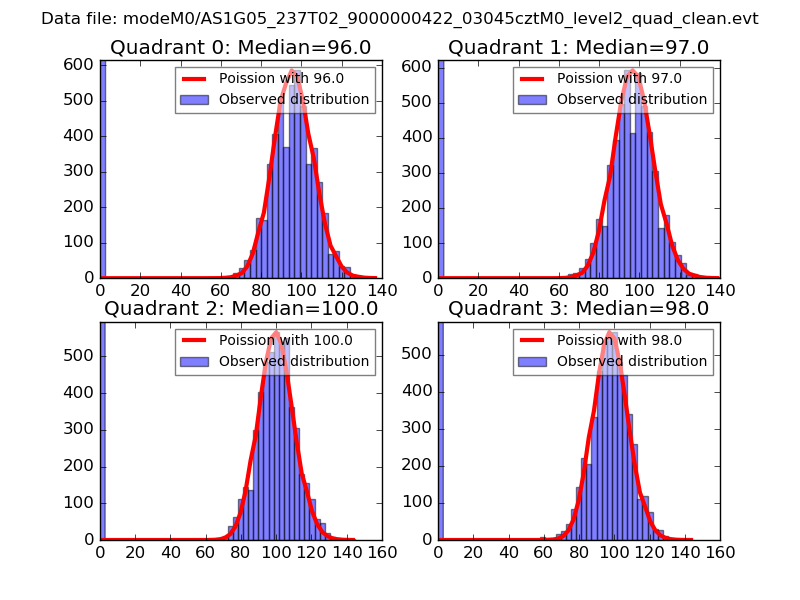 |
 |
| Quadrant-wise count rates Data is divided into 100 sec bins |
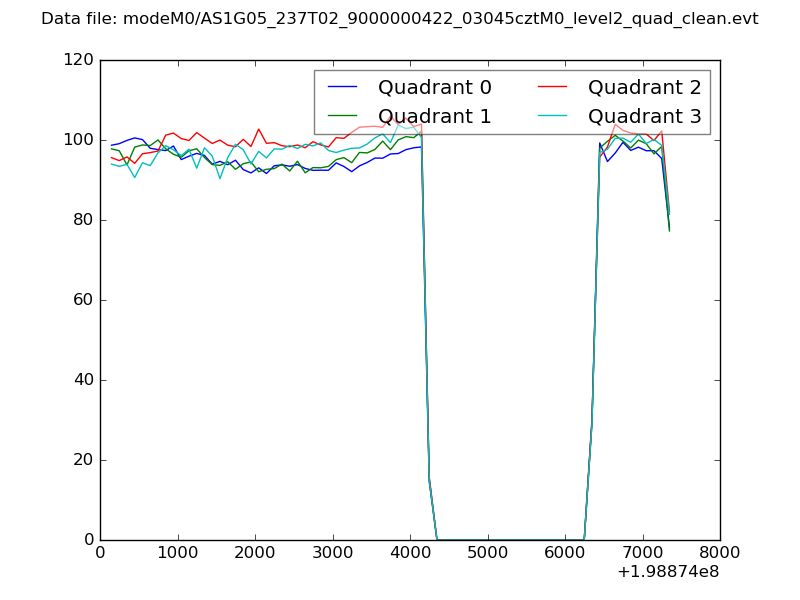 |
|
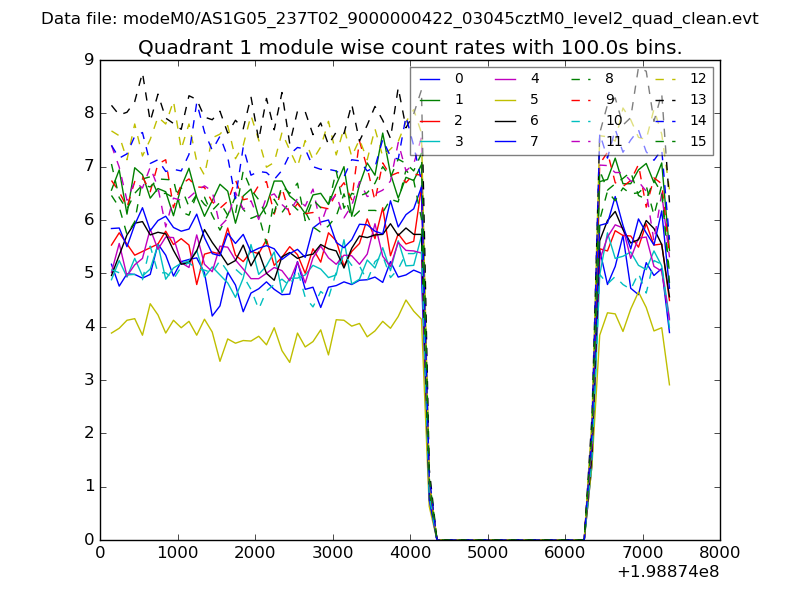
| Module-wise count rates for Quadrant A Data is divided into 100 sec bins |
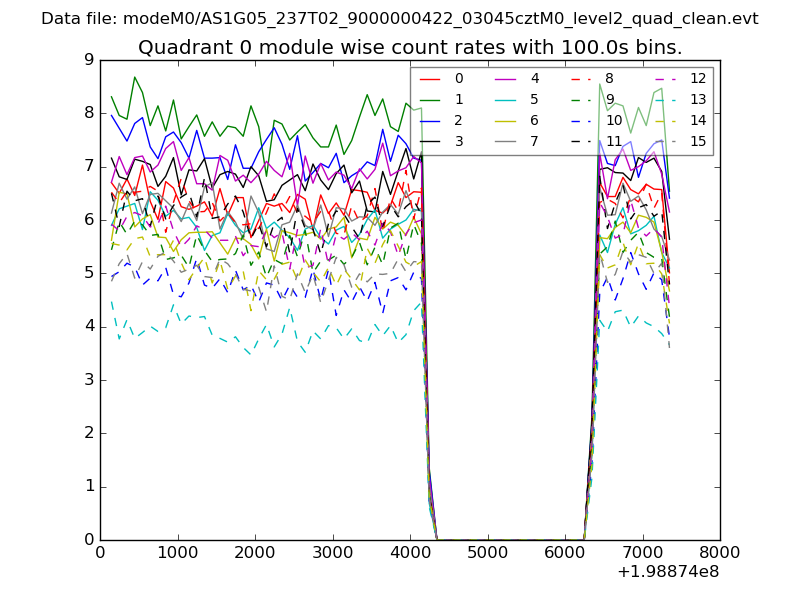 |
 |
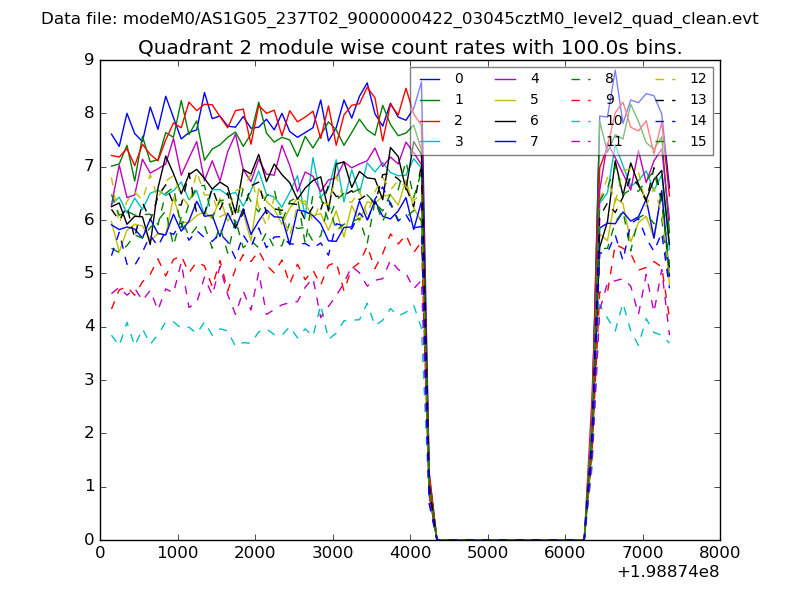
| Module-wise count rates for Quadrant B Data is divided into 100 sec bins |
 |
 |
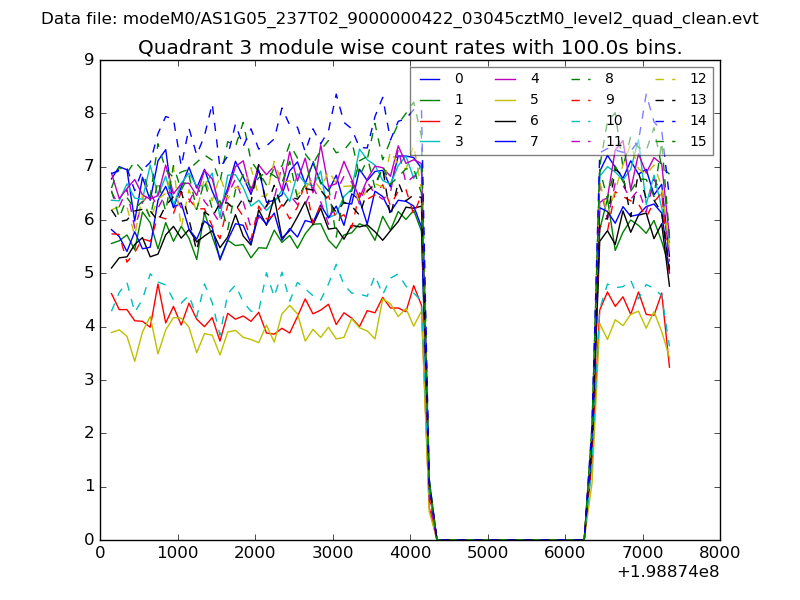
| Module-wise count rates for Quadrant C Data is divided into 100 sec bins |
 |
 |
| Module-wise count rates for Quadrant D Data is divided into 100 sec bins |
 |
 |
| Parameter | Plot |
|---|---|
| CZT HV Monitor | 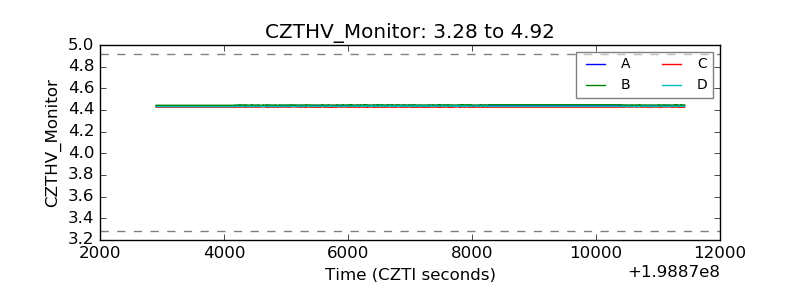 |
| D_VDD | 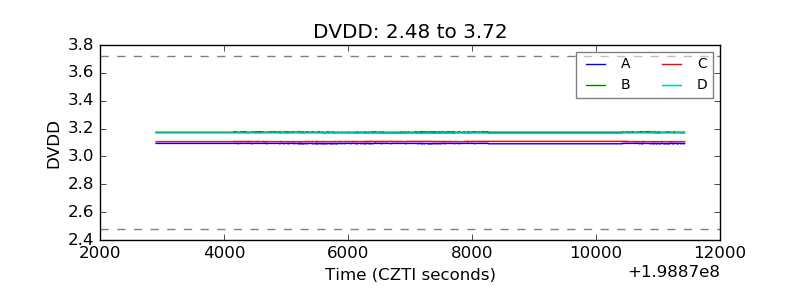 |
| Temperature 1 | 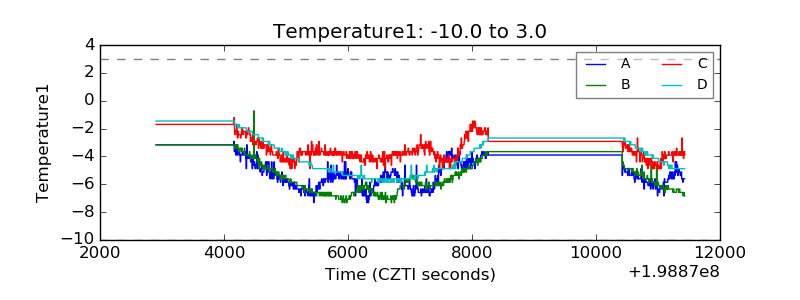 |
| Veto HV Monitor | 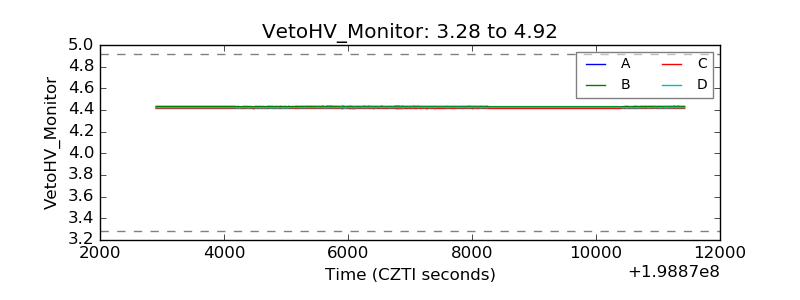 |
| Veto LLD | 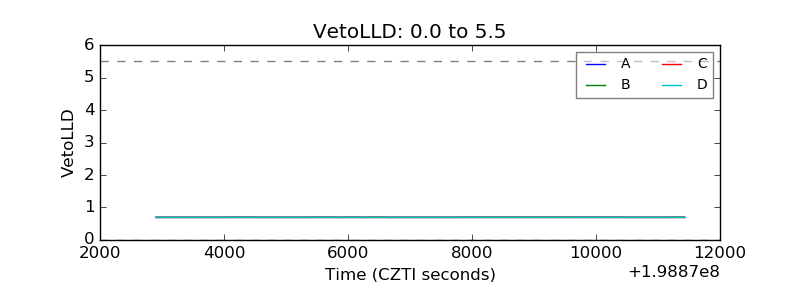 |
| Alpha Counter | 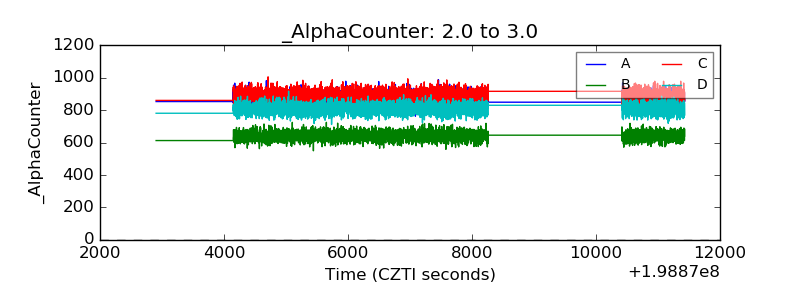 |
| _CPM_Rate | 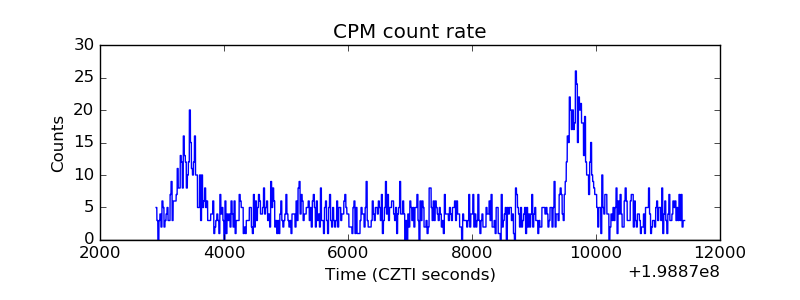 |
| CZT Counter | 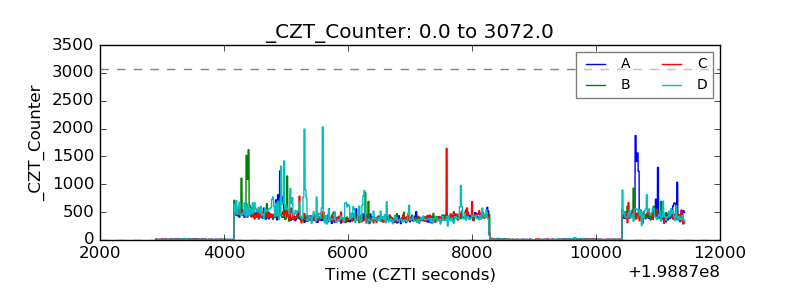 |
| +2.5 Volts monitor |  |
| +5 Volts monitor |  |
| _ROLL_ROT | 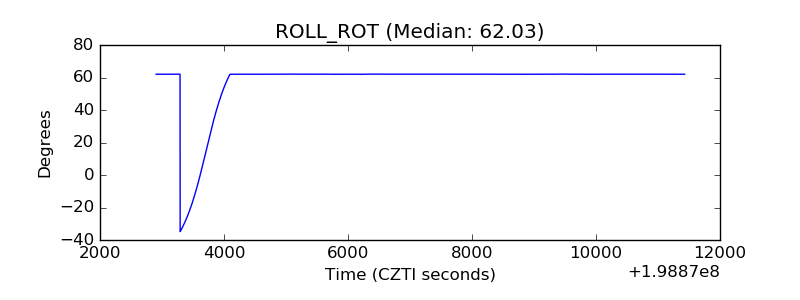 |
| _Roll_DEC | 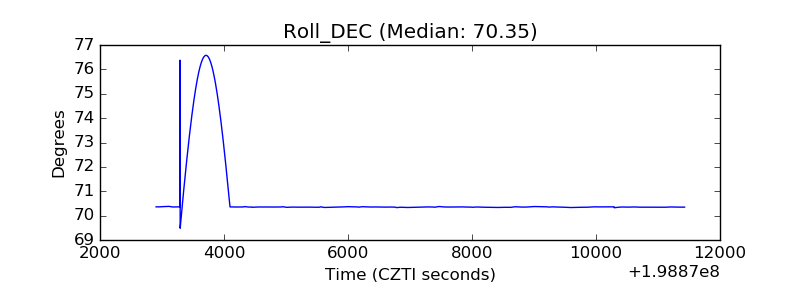 |
| _Roll_RA | 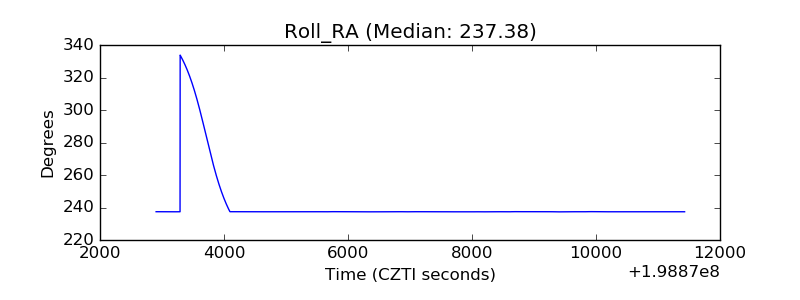 |
| Veto Counter | 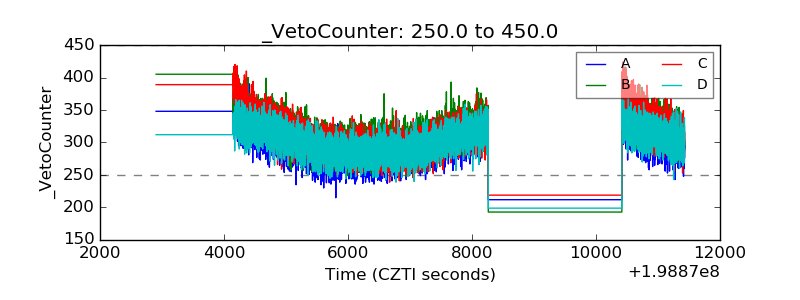 |