| Param | Original file | Final file |
|---|---|---|
| Filename | modeM0/AS1G05_237T02_9000000422_03048cztM0_level2.evt | modeM0/AS1G05_237T02_9000000422_03048cztM0_level2_quad_clean.evt |
| Size (bytes) | 794,445,120 | 202,302,720 |
| Size | 757.6 MB | 192.9 MB |
| Events in quadrant A | 6,108,132 | 1,260,107 |
| Events in quadrant B | 5,643,854 | 1,289,031 |
| Events in quadrant C | 5,487,111 | 1,341,109 |
| Events in quadrant D | 5,909,577 | 1,309,605 |
| Mode SS | |||
|---|---|---|---|
| Quadrant | BADHDUFLAG | Total packets | Discarded packets |
| A | 0 | 274 | 0 |
| B | 0 | 274 | 0 |
| C | 0 | 274 | 0 |
| D | 0 | 274 | 0 |
| Mode M9 | |||
|---|---|---|---|
| Quadrant | BADHDUFLAG | Total packets | Discarded packets |
| A | 0 | 75 | 0 |
| B | 0 | 75 | 0 |
| C | 0 | 75 | 0 |
| D | 0 | 76 | 0 |
| Mode M0 | |||
|---|---|---|---|
| Quadrant | BADHDUFLAG | Total packets | Discarded packets |
| A | 0 | 28877 | 5 |
| B | 0 | 27381 | 4 |
| C | 0 | 27238 | 4 |
| D | 0 | 28481 | 4 |
| Quadrant | Total seconds | Saturated seconds | Saturation percentage |
|---|---|---|---|
| A | 13433 | 176 | 1.310206% |
| B | 13433 | 24 | 0.178664% |
| C | 13433 | 18 | 0.133998% |
| D | 13433 | 39 | 0.290330% |
Noise dominated data is calculated using 1-second bins in cleaned event files. If a bin has >2000 counts, and if more than 50% of those come from <1% of pixels, then it is considered to be noise-dominated and hence unusable.
| Quadrant | # 1 sec bins | Bins with >0 counts | Bins with >2000 counts | High rate bins dominated by noise | Noise dominated (total time) | Noise dominated (detector-on time) | Marked lightcurve |
|---|---|---|---|---|---|---|---|
| A | 19898 | 13436 | 147 | 147 | 0.74% | 1.09% | 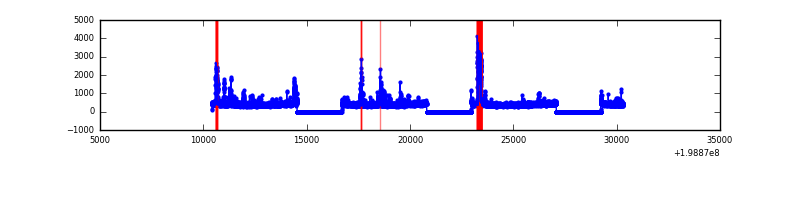 |
| B | 19898 | 13436 | 11 | 11 | 0.06% | 0.08% | 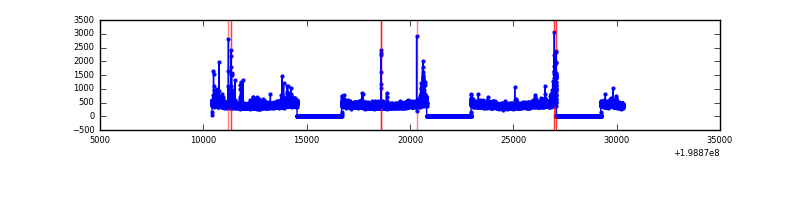 |
| C | 19898 | 13436 | 13 | 13 | 0.07% | 0.10% | 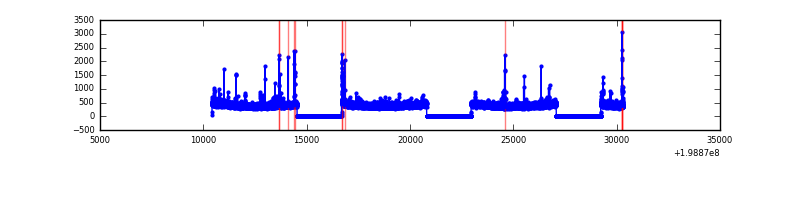 |
| D | 19898 | 13436 | 30 | 30 | 0.15% | 0.22% |  |
Top three noisy pixels from each quadrant. If the there are fewer than three noisy pixels in the level2.evt file, extra rows are filled as -1
| Pixel properties | Quadrant properties | ||||||
|---|---|---|---|---|---|---|---|
| Quadrant | DetID | PixID | Counts | Sigma | Mean | Median | Sigma |
| A | 14 | 249 | 551989 | 2026.44 | 1350 | 1318 | 271.7 |
| A | 0 | 50 | 274996 | 1007.12 | 1350 | 1318 | 271.7 |
| A | 3 | 1 | 48607 | 174.02 | 1350 | 1318 | 271.7 |
| B | 0 | 219 | 76198 | 280.67 | 1395 | 1362 | 266.6 |
| B | 0 | 230 | 54085 | 197.74 | 1395 | 1362 | 266.6 |
| B | 2 | 249 | 42870 | 155.68 | 1395 | 1362 | 266.6 |
| C | 6 | 80 | 95762 | 307.48 | 1342 | 1347 | 307.1 |
| C | 1 | 16 | 35440 | 111.03 | 1342 | 1347 | 307.1 |
| C | 15 | 208 | 28860 | 89.6 | 1342 | 1347 | 307.1 |
| D | 2 | 152 | 269865 | 805.1 | 1322 | 1287 | 333.6 |
| D | 13 | 114 | 168063 | 499.94 | 1322 | 1287 | 333.6 |
| D | 10 | 213 | 129355 | 383.9 | 1322 | 1287 | 333.6 |
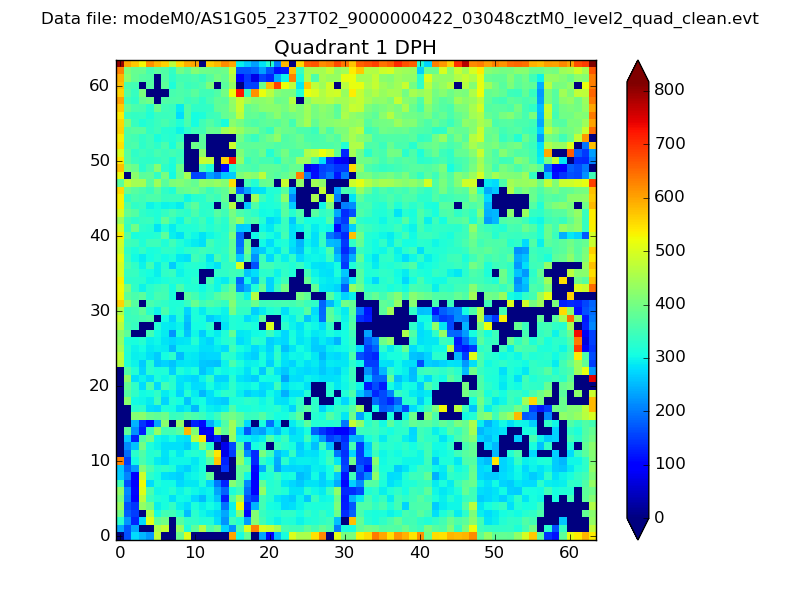
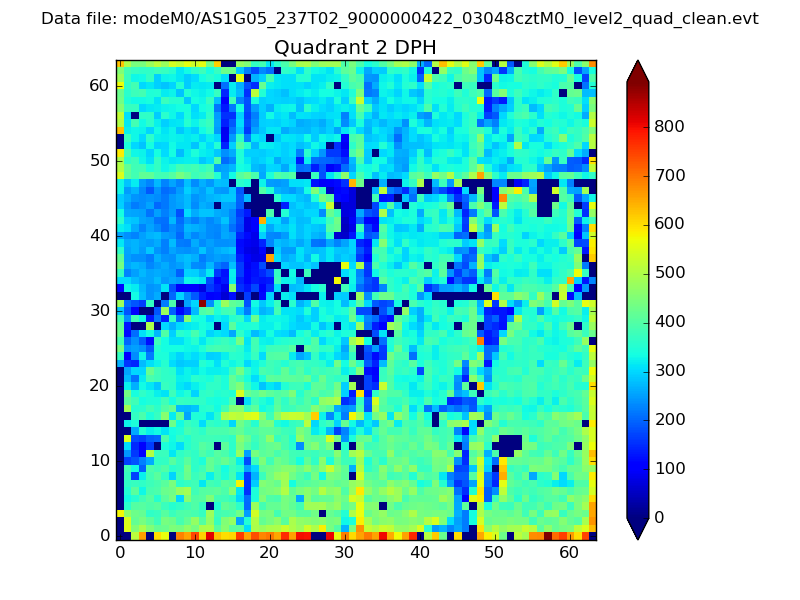
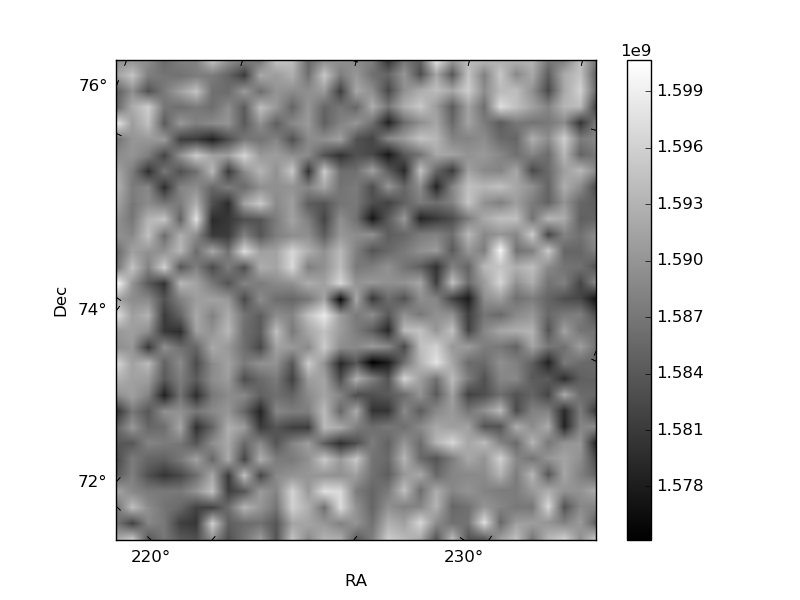
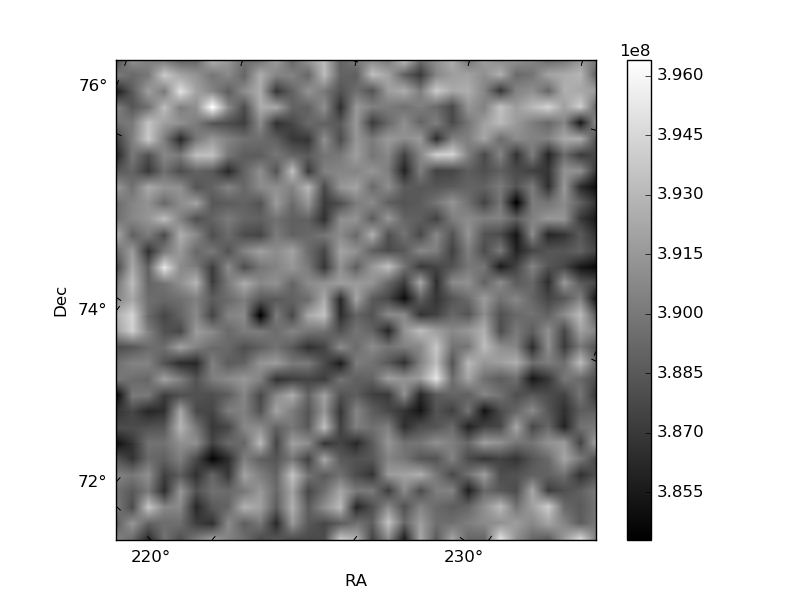
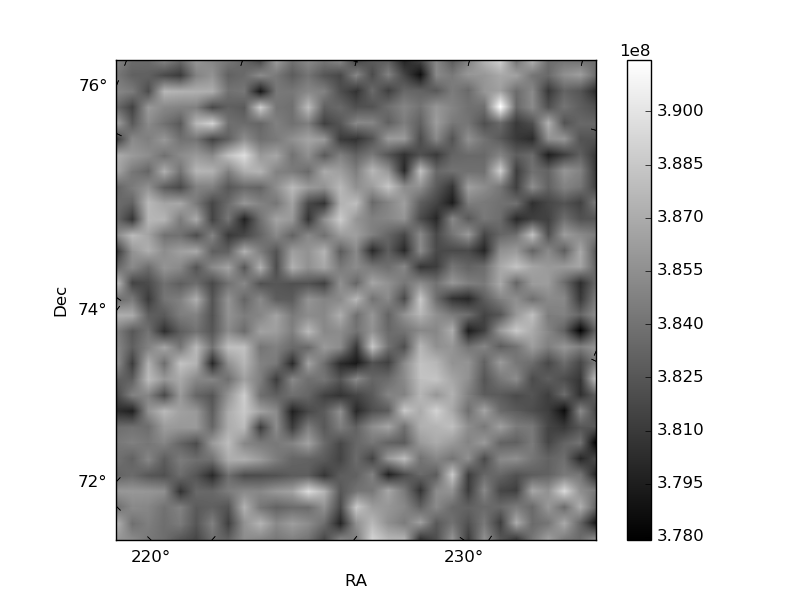
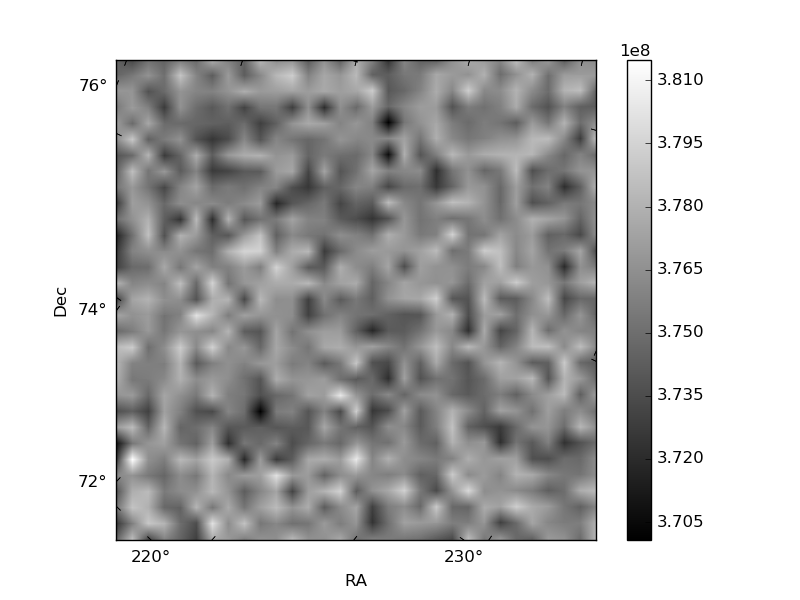
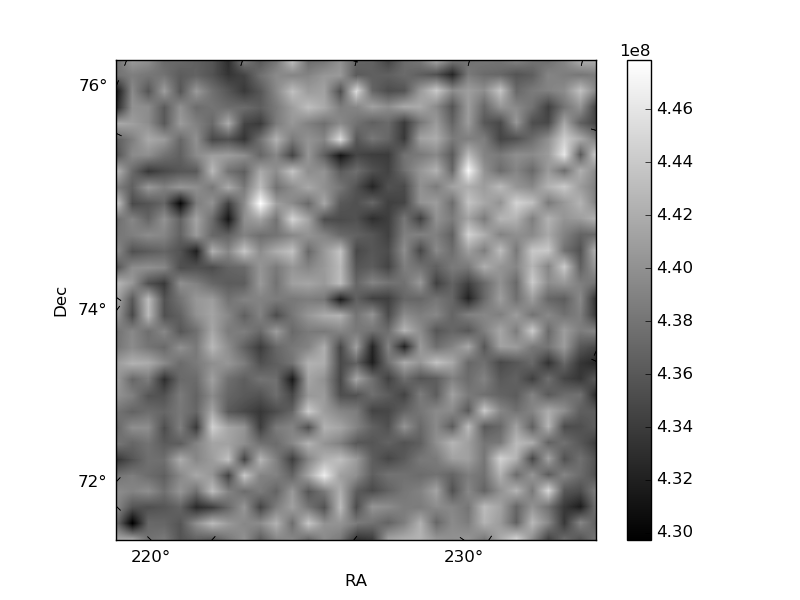
Histogram calculated using DETX and DETY for each event in the final _common_clean file
| Quadrant A | 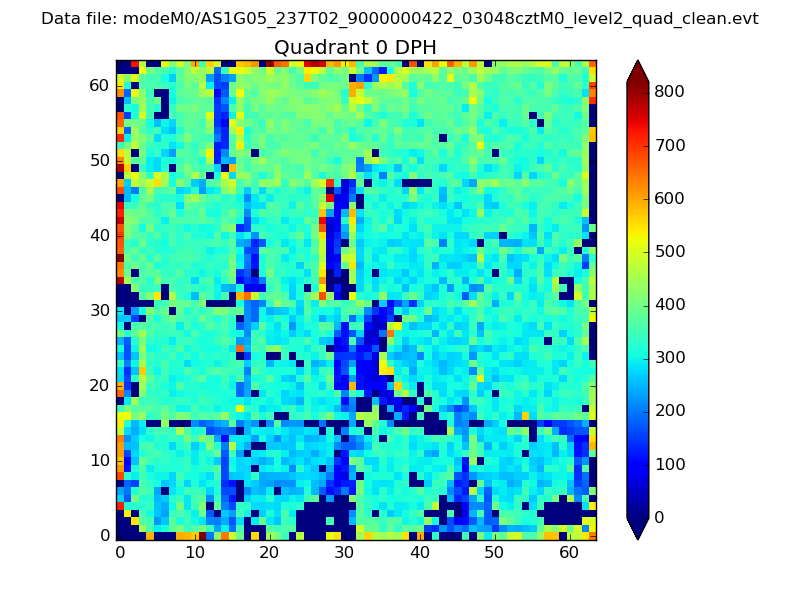 |
 |
Quadrant B |
|---|---|---|---|
| Quadrant D | 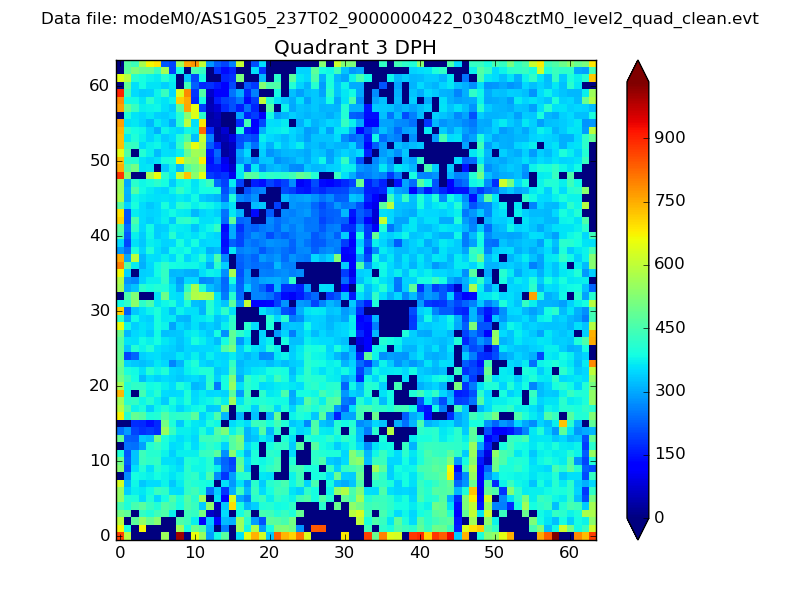 |
 |
Quadrant C |
| Plot type | Count rate plots | Images |
|---|---|---|
| Comparison with Poisson distribution Blue bars denote a histogram of data divided into 1 sec bins. Red curve is a Poisson curve with rate = median count rate of data. |
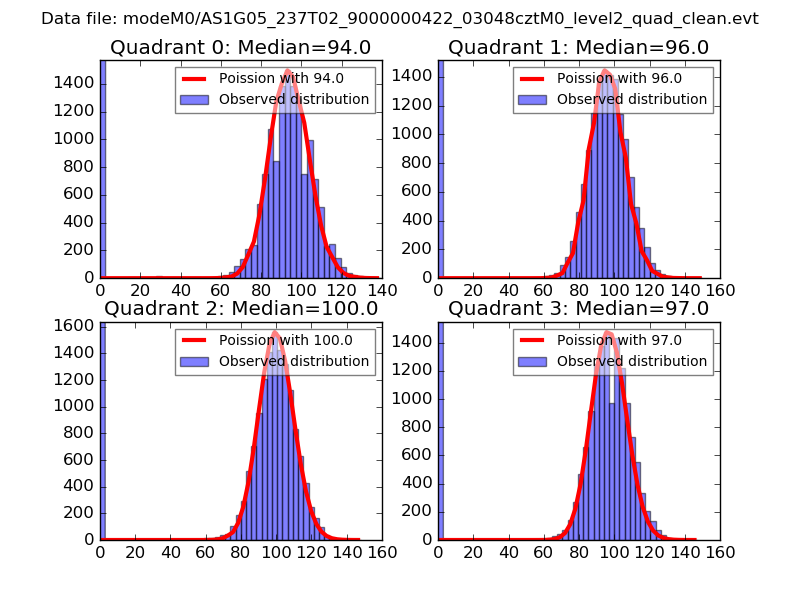 |
 |
| Quadrant-wise count rates Data is divided into 100 sec bins |
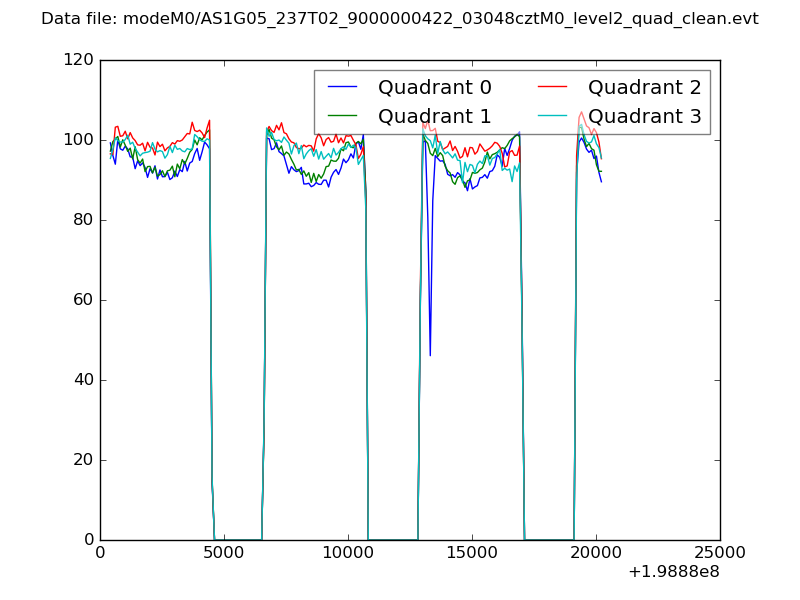 |
|
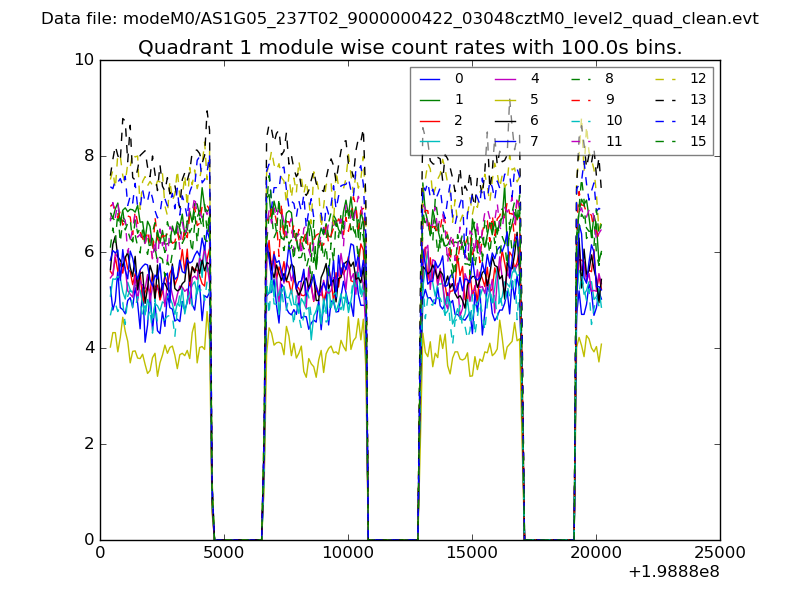
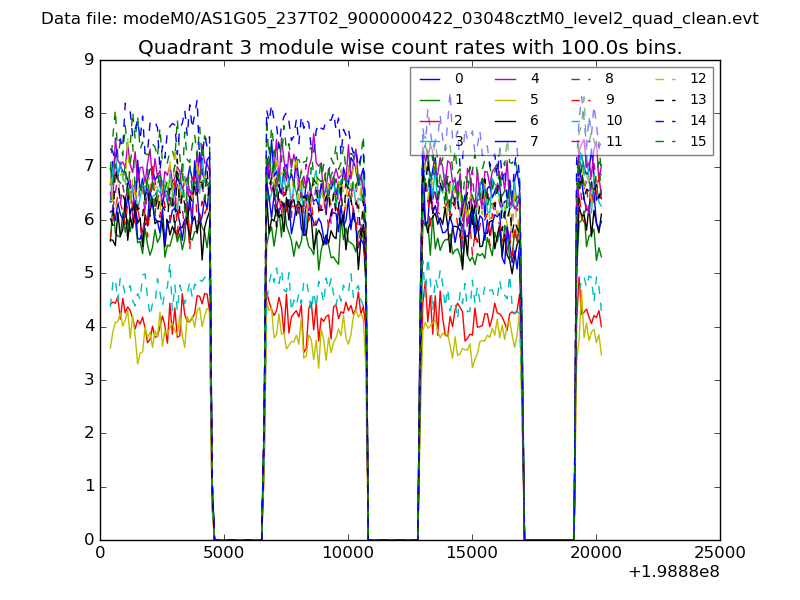
| Module-wise count rates for Quadrant A Data is divided into 100 sec bins |
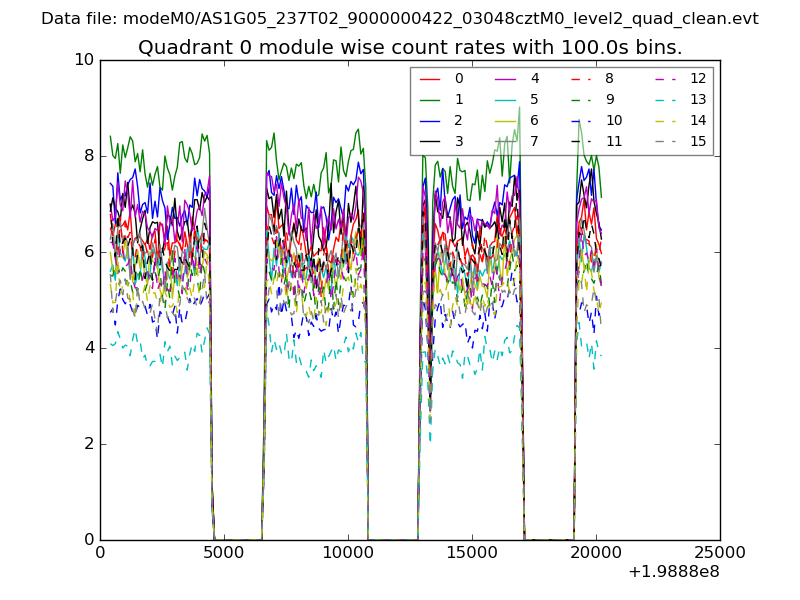 |
 |
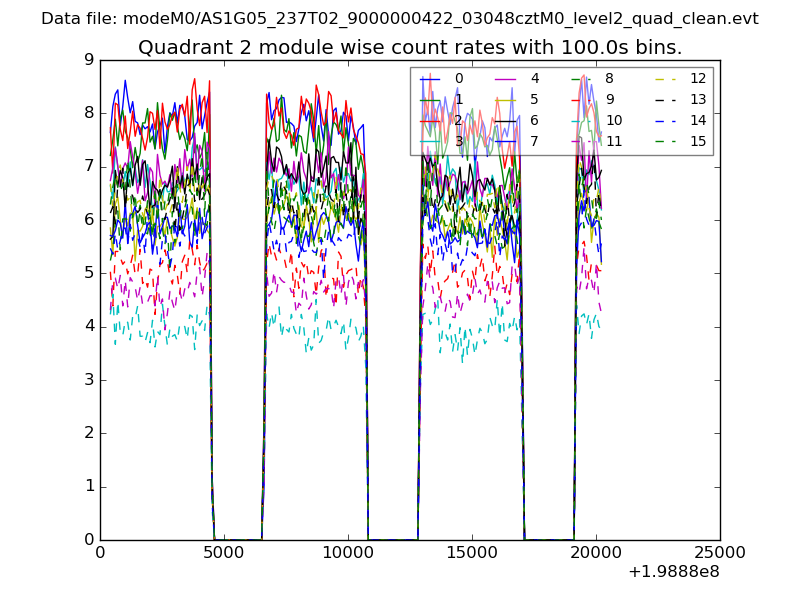
| Module-wise count rates for Quadrant B Data is divided into 100 sec bins |
 |
 |
| Module-wise count rates for Quadrant C Data is divided into 100 sec bins |
 |
 |
| Module-wise count rates for Quadrant D Data is divided into 100 sec bins |
 |
 |
| Parameter | Plot |
|---|---|
| CZT HV Monitor | 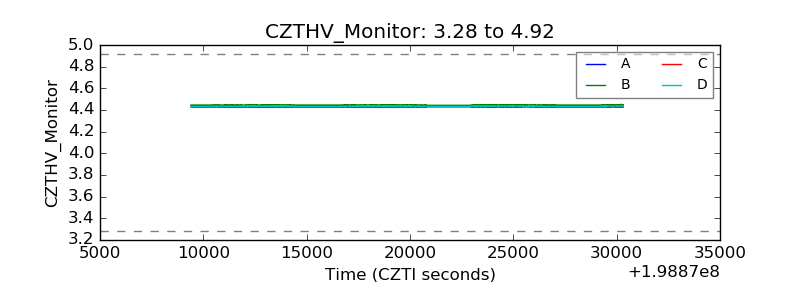 |
| D_VDD | 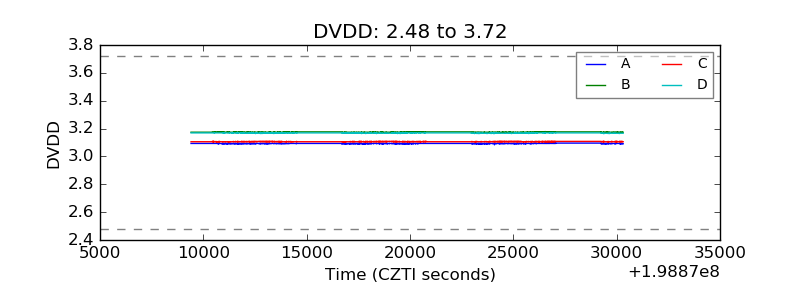 |
| Temperature 1 | 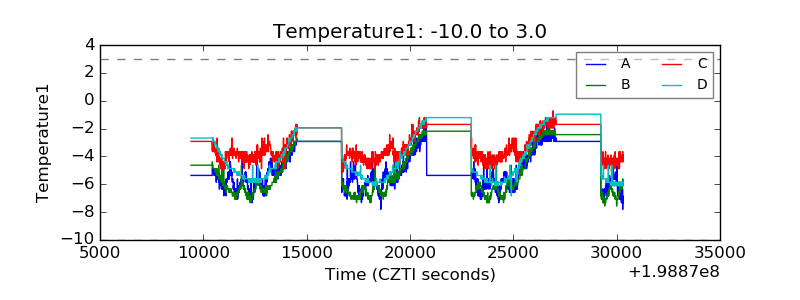 |
| Veto HV Monitor | 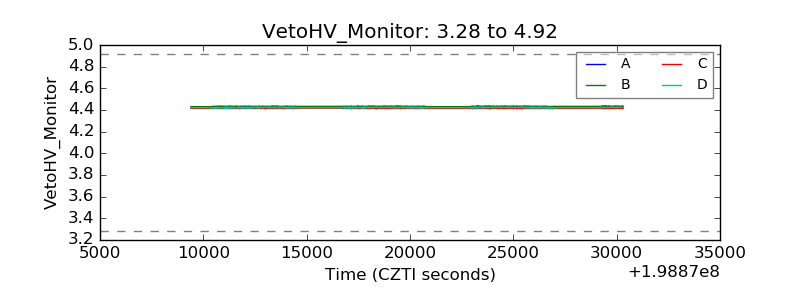 |
| Veto LLD | 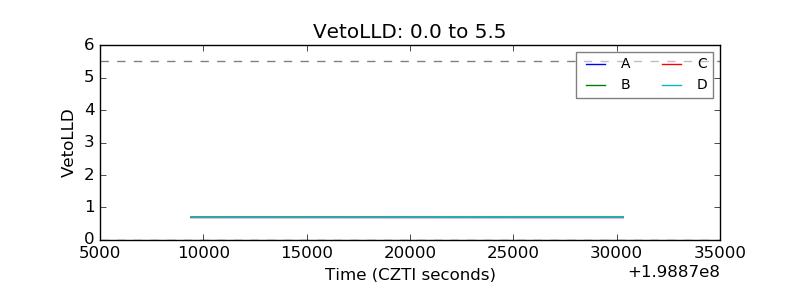 |
| Alpha Counter | 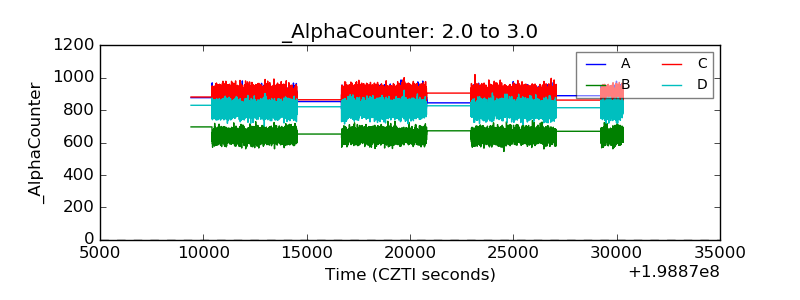 |
| _CPM_Rate |  |
| CZT Counter | 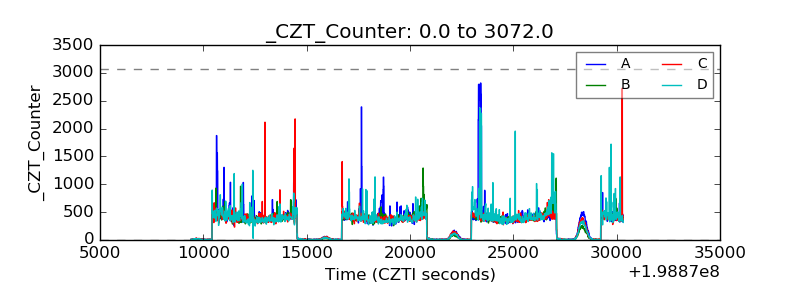 |
| +2.5 Volts monitor |  |
| +5 Volts monitor |  |
| _ROLL_ROT | 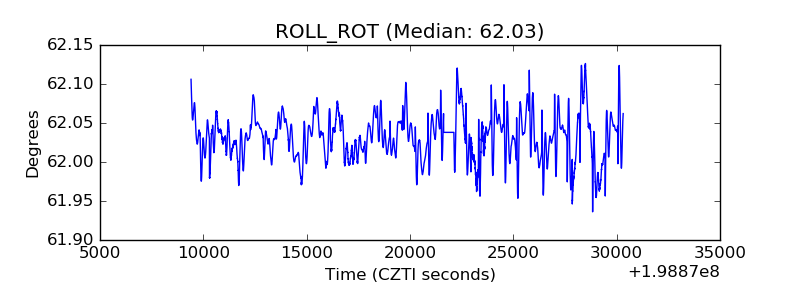 |
| _Roll_DEC |  |
| _Roll_RA | 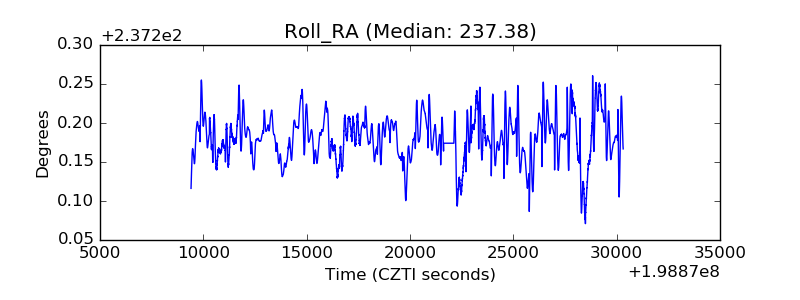 |
| Veto Counter | 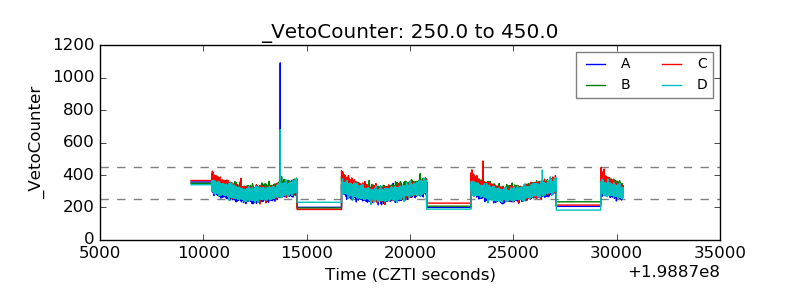 |