| Param | Original file | Final file |
|---|---|---|
| Filename | modeM0/AS1G05_237T02_9000000422_03049cztM0_level2.evt | modeM0/AS1G05_237T02_9000000422_03049cztM0_level2_quad_clean.evt |
| Size (bytes) | 1,208,888,640 | 303,091,200 |
| Size | 1.1 GB | 289.1 MB |
| Events in quadrant A | 8,882,132 | 1,897,017 |
| Events in quadrant B | 8,600,601 | 1,933,033 |
| Events in quadrant C | 8,270,323 | 2,006,504 |
| Events in quadrant D | 9,490,000 | 1,952,907 |
| Mode SS | |||
|---|---|---|---|
| Quadrant | BADHDUFLAG | Total packets | Discarded packets |
| A | 0 | 410 | 0 |
| B | 0 | 410 | 0 |
| C | 0 | 410 | 0 |
| D | 0 | 410 | 0 |
| Mode M9 | |||
|---|---|---|---|
| Quadrant | BADHDUFLAG | Total packets | Discarded packets |
| A | 0 | 90 | 0 |
| B | 0 | 90 | 0 |
| C | 0 | 90 | 0 |
| D | 0 | 91 | 0 |
| Mode M0 | |||
|---|---|---|---|
| Quadrant | BADHDUFLAG | Total packets | Discarded packets |
| A | 0 | 42604 | 5 |
| B | 0 | 41554 | 5 |
| C | 0 | 41026 | 5 |
| D | 0 | 44545 | 5 |
| Quadrant | Total seconds | Saturated seconds | Saturation percentage |
|---|---|---|---|
| A | 20206 | 182 | 0.900723% |
| B | 20206 | 48 | 0.237553% |
| C | 20206 | 31 | 0.153420% |
| D | 20206 | 143 | 0.707711% |
Noise dominated data is calculated using 1-second bins in cleaned event files. If a bin has >2000 counts, and if more than 50% of those come from <1% of pixels, then it is considered to be noise-dominated and hence unusable.
| Quadrant | # 1 sec bins | Bins with >0 counts | Bins with >2000 counts | High rate bins dominated by noise | Noise dominated (total time) | Noise dominated (detector-on time) | Marked lightcurve |
|---|---|---|---|---|---|---|---|
| A | 28826 | 20210 | 151 | 151 | 0.52% | 0.75% | 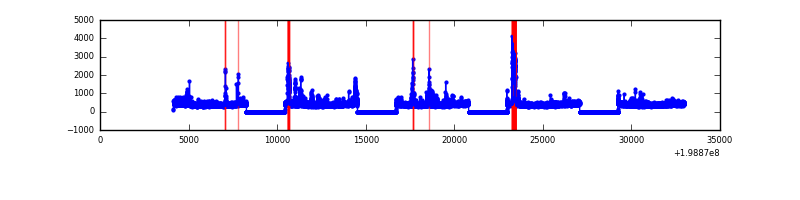 |
| B | 28826 | 20210 | 25 | 25 | 0.09% | 0.12% | 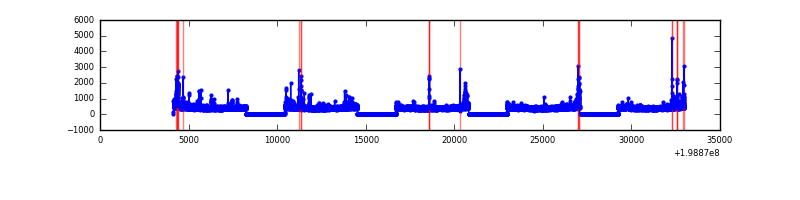 |
| C | 28826 | 20210 | 27 | 27 | 0.09% | 0.13% | 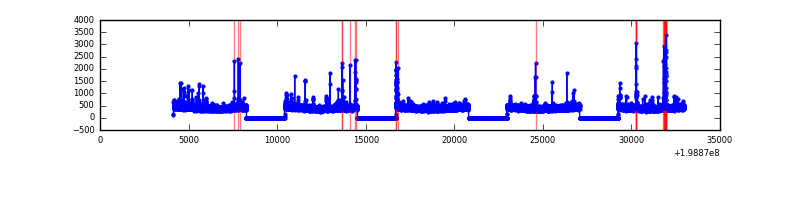 |
| D | 28826 | 20210 | 118 | 118 | 0.41% | 0.58% | 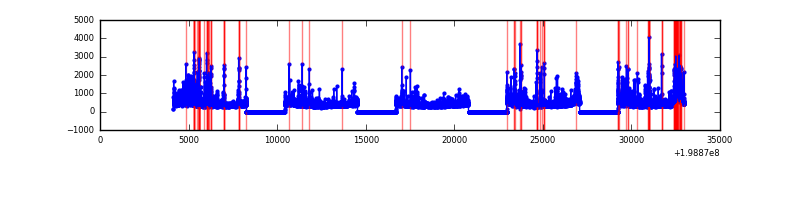 |
Top three noisy pixels from each quadrant. If the there are fewer than three noisy pixels in the level2.evt file, extra rows are filled as -1
| Pixel properties | Quadrant properties | ||||||
|---|---|---|---|---|---|---|---|
| Quadrant | DetID | PixID | Counts | Sigma | Mean | Median | Sigma |
| A | 14 | 249 | 572691 | 1385.93 | 2035 | 1989 | 411.8 |
| A | 0 | 50 | 302204 | 729.06 | 2035 | 1989 | 411.8 |
| A | 12 | 247 | 75570 | 178.69 | 2035 | 1989 | 411.8 |
| B | 0 | 219 | 136062 | 337.88 | 2090 | 2043 | 396.6 |
| B | 0 | 230 | 107152 | 265.0 | 2090 | 2043 | 396.6 |
| B | 7 | 252 | 105249 | 260.2 | 2090 | 2043 | 396.6 |
| C | 6 | 80 | 144207 | 309.32 | 2012 | 2021 | 459.7 |
| C | 15 | 208 | 83659 | 177.6 | 2012 | 2021 | 459.7 |
| C | 1 | 16 | 48659 | 101.46 | 2012 | 2021 | 459.7 |
| D | 2 | 152 | 686547 | 1390.35 | 1983 | 1932 | 492.4 |
| D | 13 | 114 | 538367 | 1089.42 | 1983 | 1932 | 492.4 |
| D | 10 | 213 | 176305 | 354.12 | 1983 | 1932 | 492.4 |
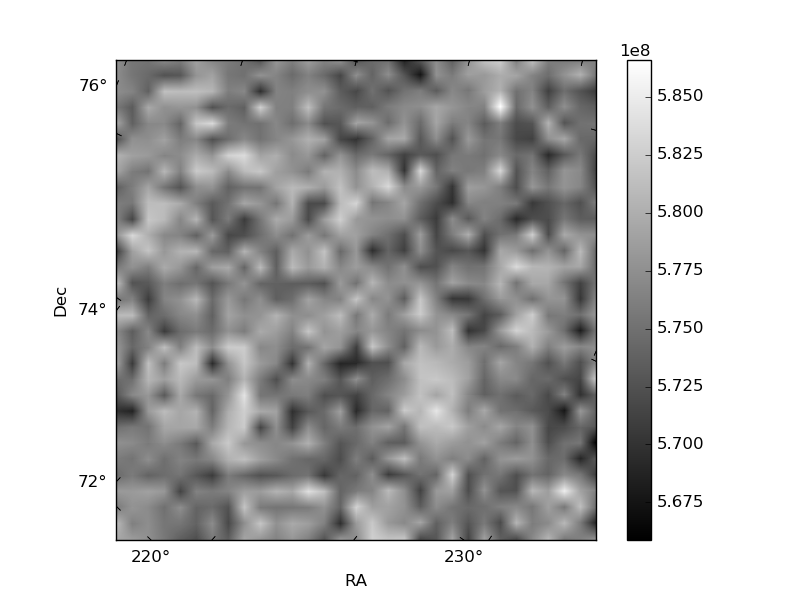
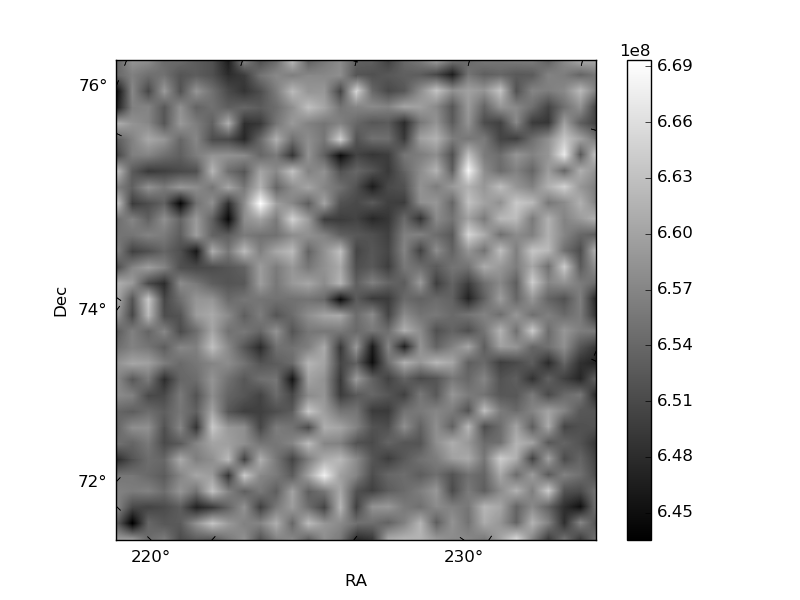
Histogram calculated using DETX and DETY for each event in the final _common_clean file
| Quadrant A | 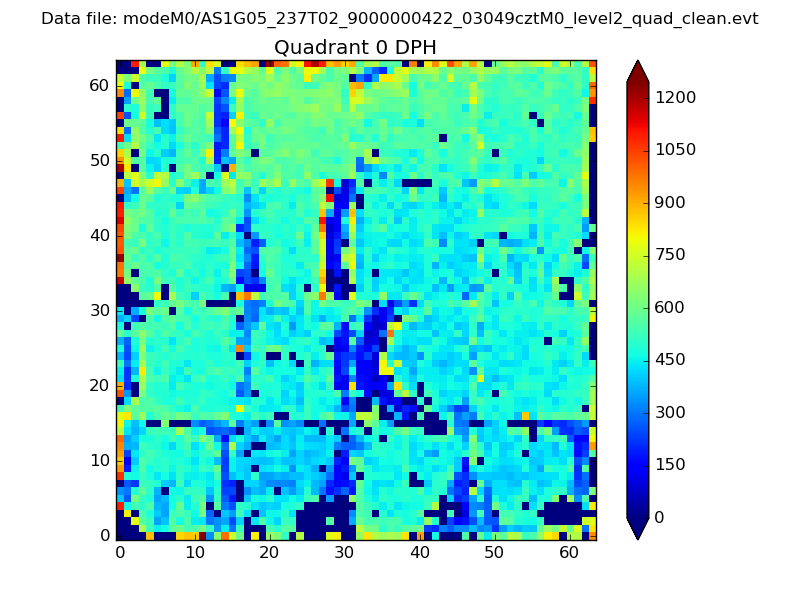 |
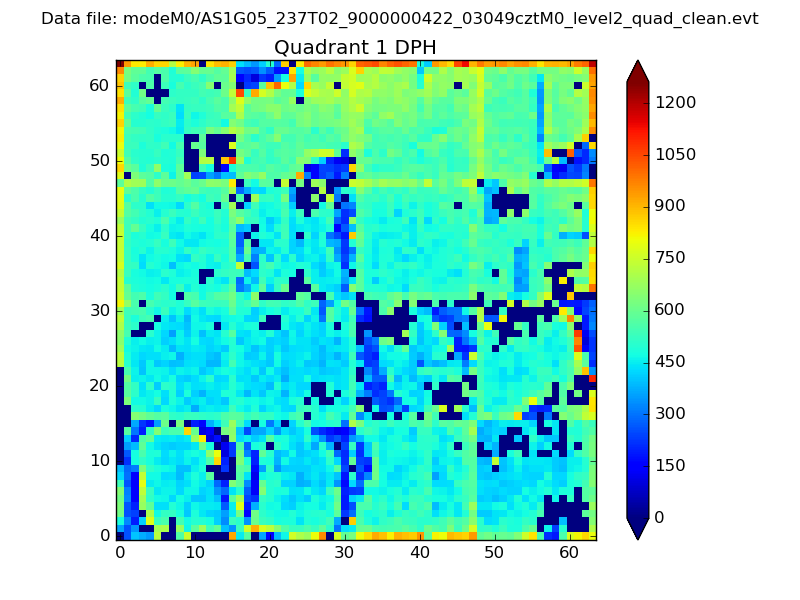 |
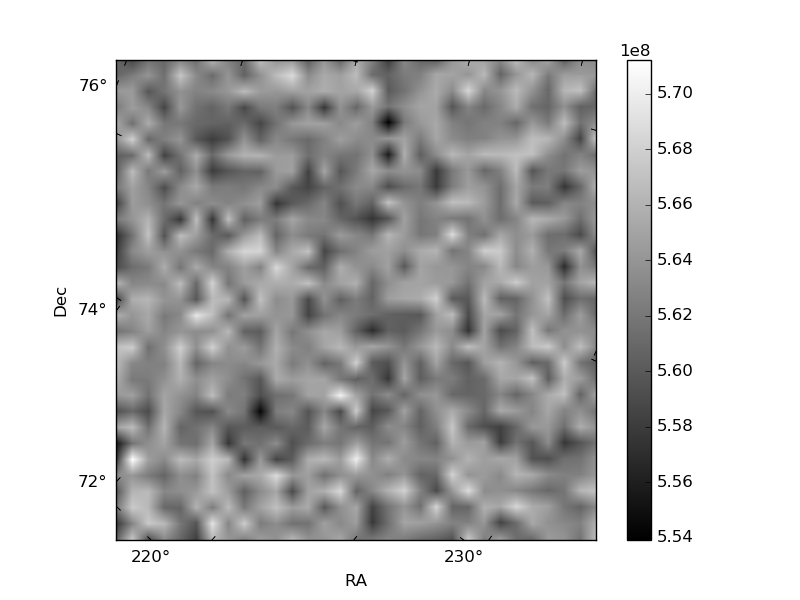
Quadrant B |
|---|---|---|---|
| Quadrant D | 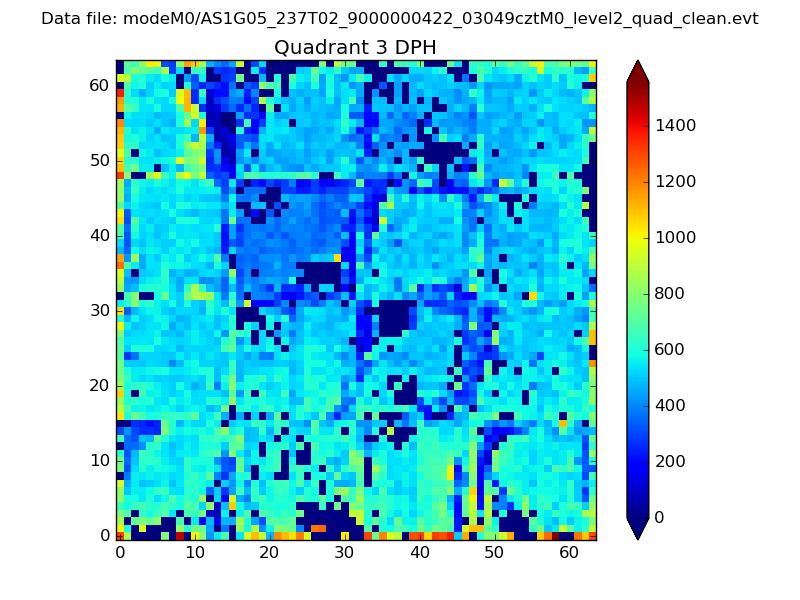 |
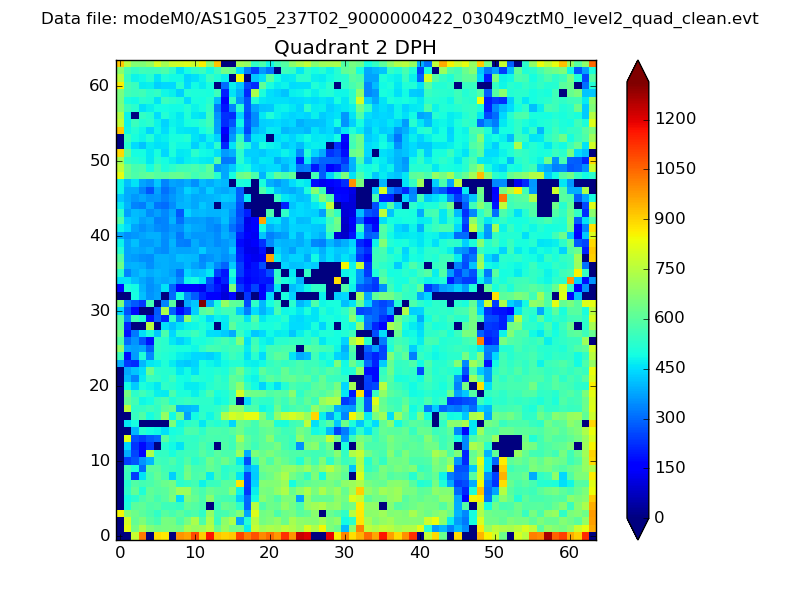 |
Quadrant C |
| Plot type | Count rate plots | Images |
|---|---|---|
| Comparison with Poisson distribution Blue bars denote a histogram of data divided into 1 sec bins. Red curve is a Poisson curve with rate = median count rate of data. |
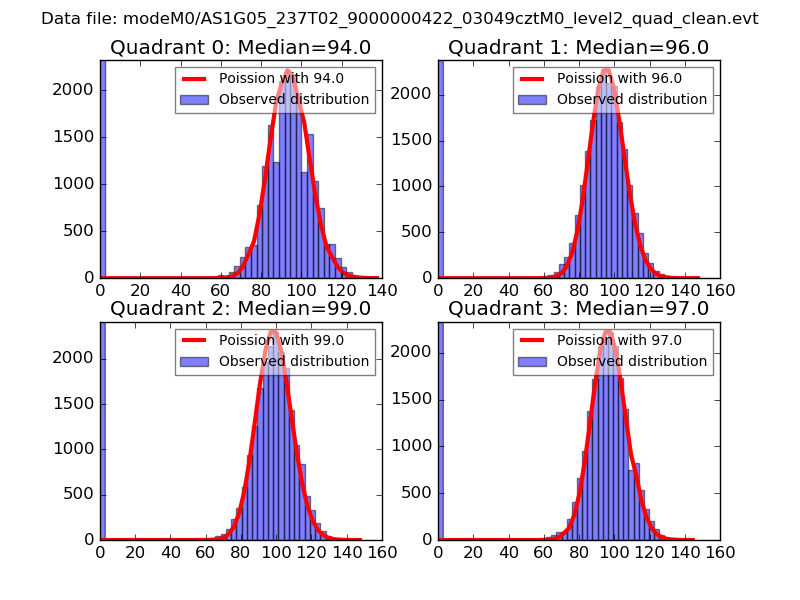 |
 |
| Quadrant-wise count rates Data is divided into 100 sec bins |
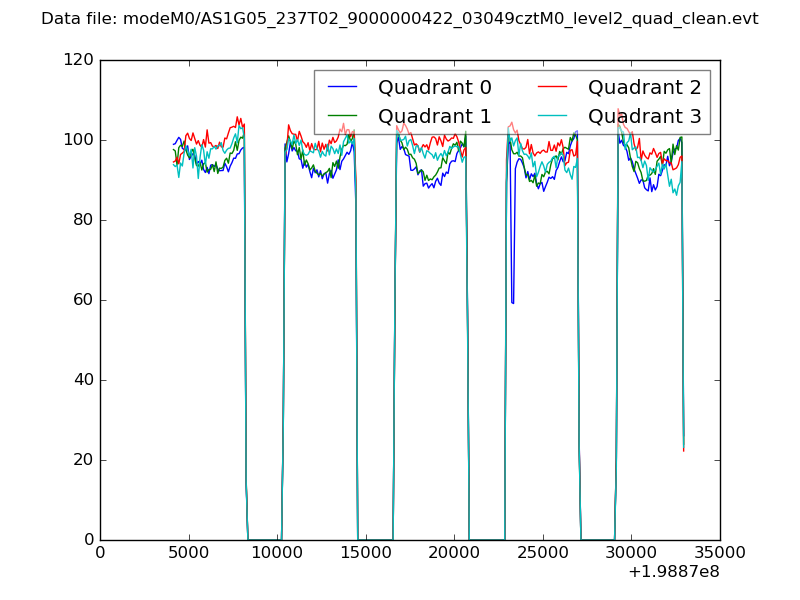 |
|
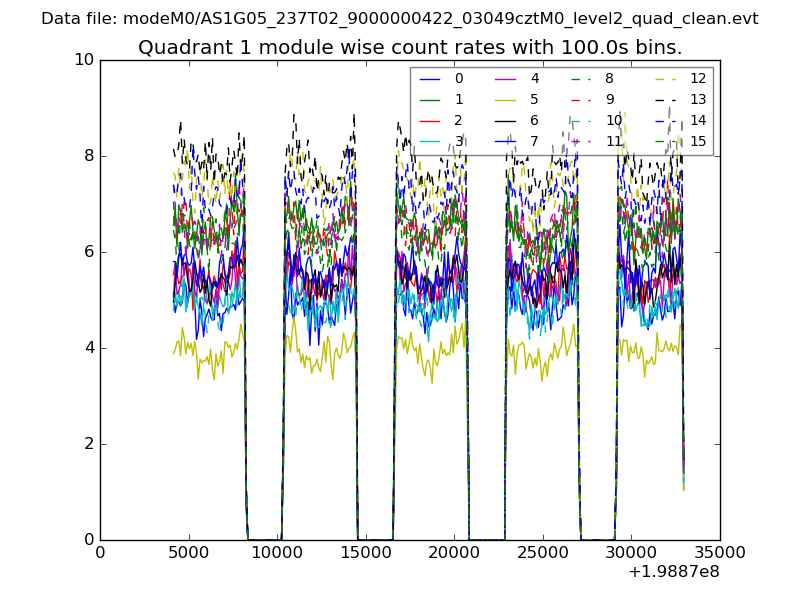
| Module-wise count rates for Quadrant A Data is divided into 100 sec bins |
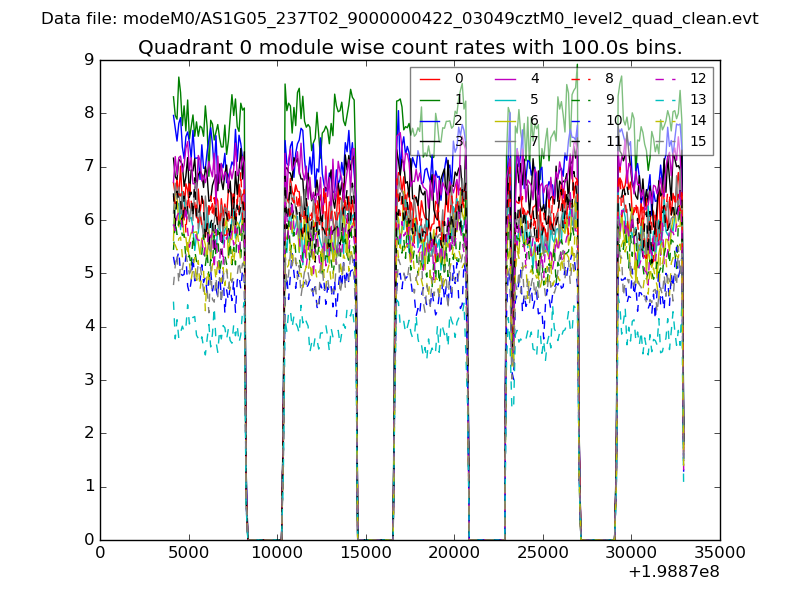 |
 |
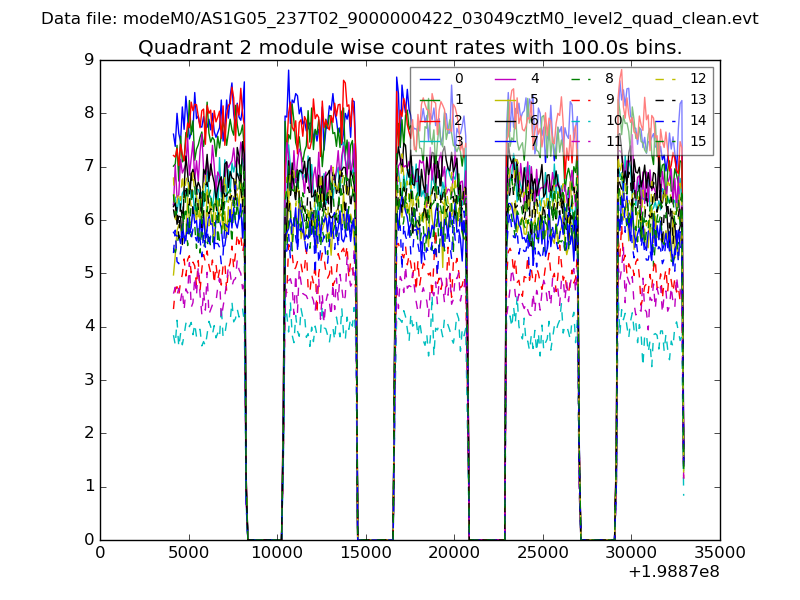
| Module-wise count rates for Quadrant B Data is divided into 100 sec bins |
 |
 |
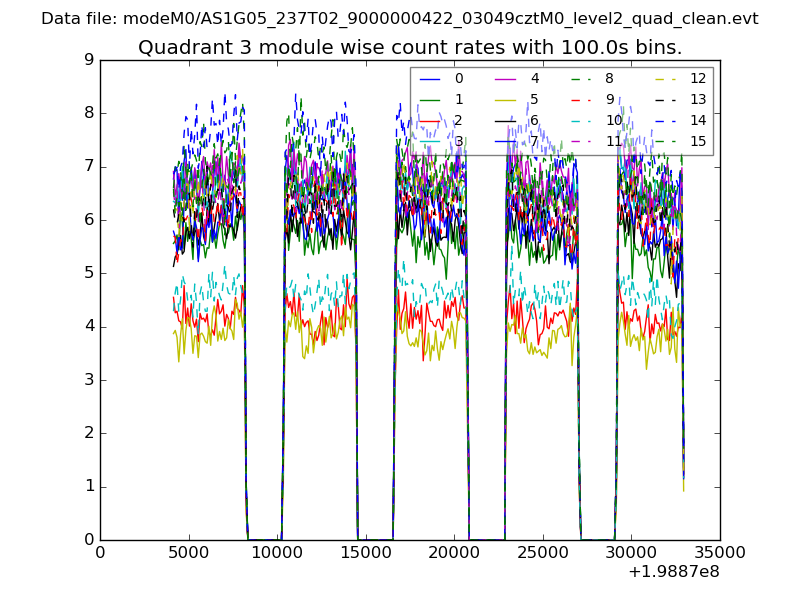
| Module-wise count rates for Quadrant C Data is divided into 100 sec bins |
 |
 |
| Module-wise count rates for Quadrant D Data is divided into 100 sec bins |
 |
 |
| Parameter | Plot |
|---|---|
| CZT HV Monitor | 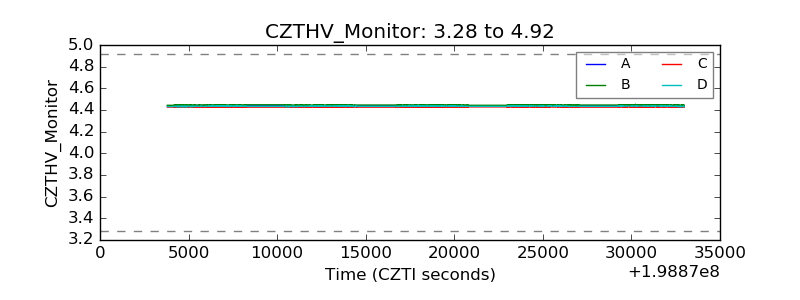 |
| D_VDD | 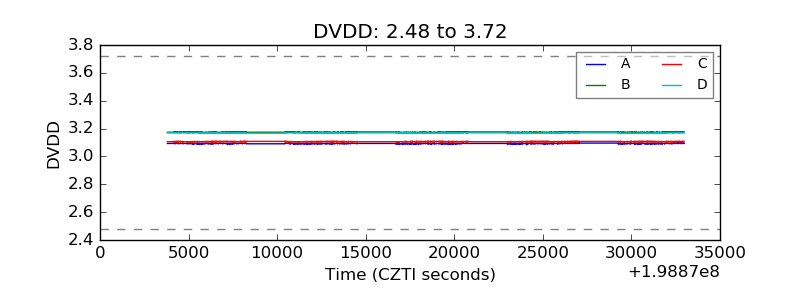 |
| Temperature 1 | 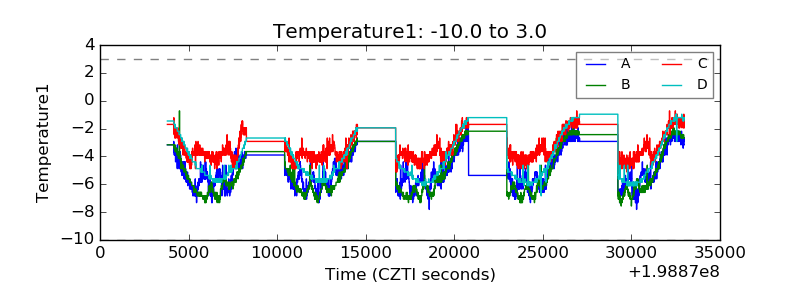 |
| Veto HV Monitor | 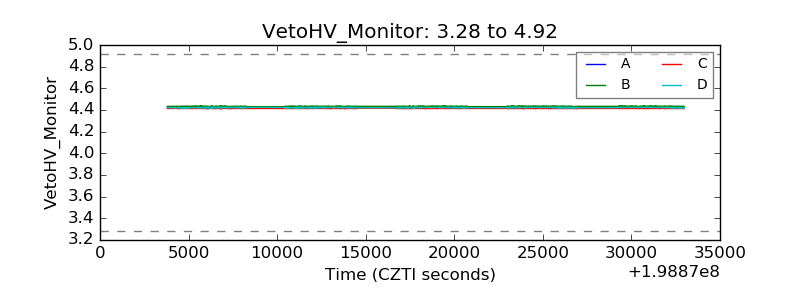 |
| Veto LLD | 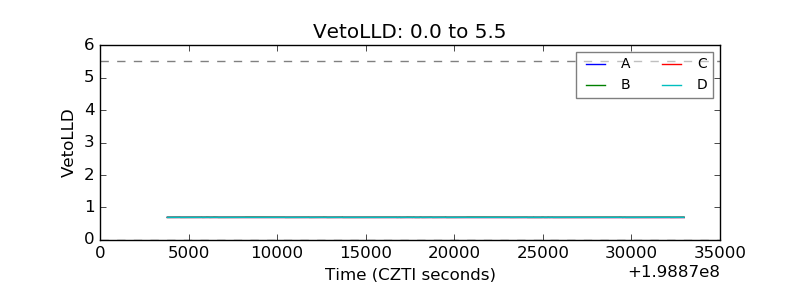 |
| Alpha Counter | 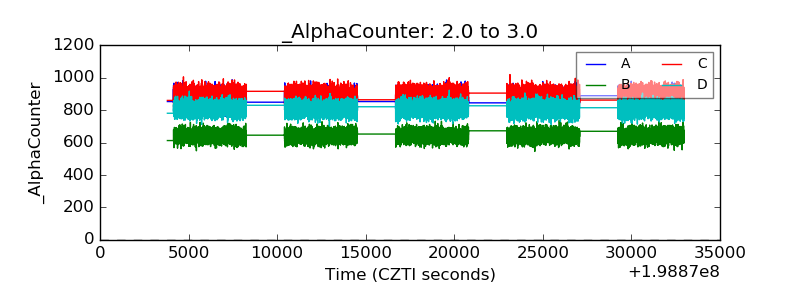 |
| _CPM_Rate |  |
| CZT Counter | 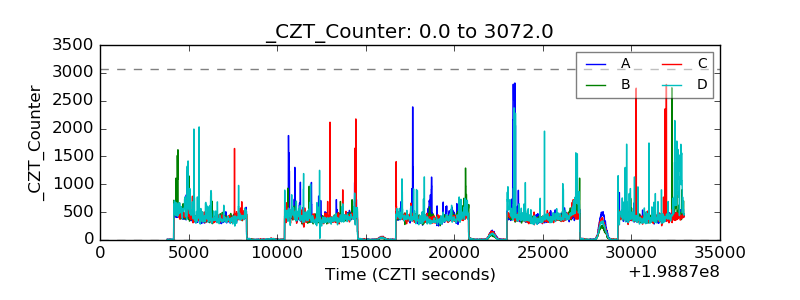 |
| +2.5 Volts monitor |  |
| +5 Volts monitor |  |
| _ROLL_ROT | 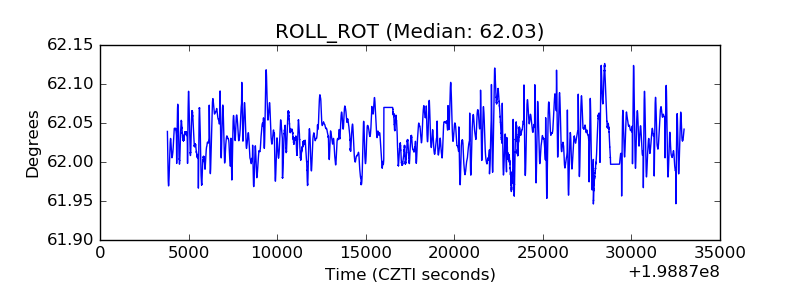 |
| _Roll_DEC | 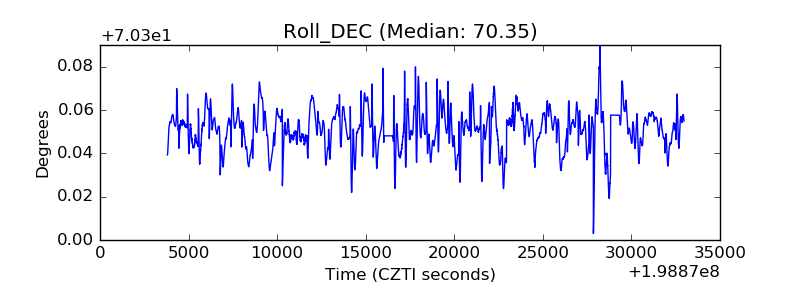 |
| _Roll_RA |  |
| Veto Counter | 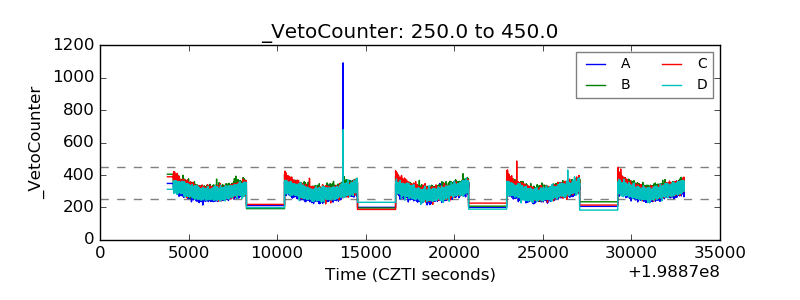 |