| Param | Original file | Final file |
|---|---|---|
| Filename | modeM0/AS1G05_238T03_9000000424cztM0_level2.fits | modeM0/AS1G05_238T03_9000000424cztM0_level2_quad_clean.evt |
| Size (bytes) | 844,090,560 | 989,398,080 |
| Size | 805.0 MB | 943.6 MB |
| Events in quadrant A | 5,066,254 | 6,205,544 |
| Events in quadrant B | 4,807,044 | 6,001,957 |
| Events in quadrant C | 4,891,706 | 5,827,735 |
| Events in quadrant D | 4,183,980 | 5,318,025 |
| Mode M0 | |||
|---|---|---|---|
| Quadrant | BADHDUFLAG | Total packets | Discarded packets |
| A | 0 | 198450 | 0 |
| B | 0 | 231275 | 0 |
| C | 0 | 202190 | 0 |
| D | 0 | 231624 | 0 |
| Mode M9 | |||
|---|---|---|---|
| Quadrant | BADHDUFLAG | Total packets | Discarded packets |
| A | 0 | 512 | 0 |
| B | 0 | 512 | 0 |
| C | 0 | 512 | 0 |
| D | 0 | 512 | 0 |
| Mode SS | |||
|---|---|---|---|
| Quadrant | BADHDUFLAG | Total packets | Discarded packets |
| A | 0 | 1976 | 0 |
| B | 0 | 1976 | 0 |
| C | 0 | 1976 | 0 |
| D | 0 | 1976 | 0 |
| Quadrant | Total seconds | Saturated seconds | Saturation percentage |
|---|---|---|---|
| A | 96484 | 195 | 0.202106% |
| B | 96484 | 1943 | 2.013805% |
| C | 96484 | 482 | 0.499565% |
| D | 96484 | 1742 | 1.805481% |
Noise dominated data is calculated using 1-second bins in cleaned event files. If a bin has >2000 counts, and if more than 50% of those come from <1% of pixels, then it is considered to be noise-dominated and hence unusable.
| Quadrant | # 1 sec bins | Bins with >0 counts | Bins with >2000 counts | High rate bins dominated by noise | Noise dominated (total time) | Noise dominated (detector-on time) | Marked lightcurve |
|---|---|---|---|---|---|---|---|
| A | 145845 | 96484 | 0 | 0 | 0.00% | 0.00% | 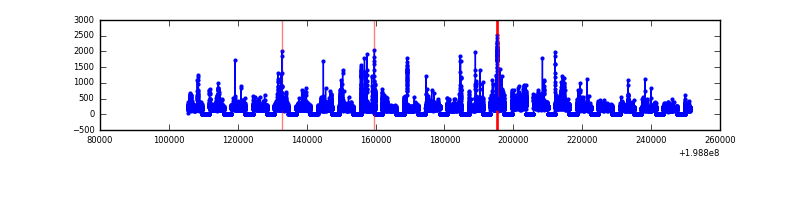 |
| B | 145845 | 96479 | 0 | 0 | 0.00% | 0.00% | 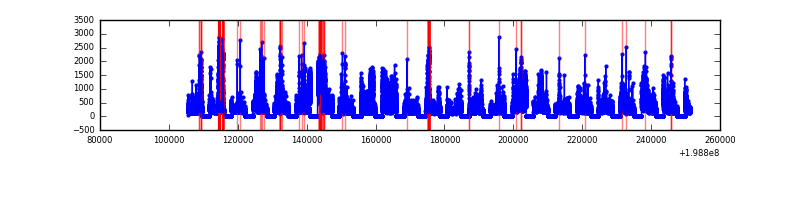 |
| C | 145845 | 96474 | 0 | 0 | 0.00% | 0.00% |  |
| D | 145845 | 96473 | 0 | 0 | 0.00% | 0.00% |  |
Top three noisy pixels from each quadrant. If the there are fewer than three noisy pixels in the level2.evt file, extra rows are filled as -1
| Pixel properties | Quadrant properties | ||||||
|---|---|---|---|---|---|---|---|
| Quadrant | DetID | PixID | Counts | Sigma | Mean | Median | Sigma |
| A | 0 | 29 | 4910 | 10.88 | 1320 | 1235 | 337.7 |
| A | 7 | 110 | 4439 | 9.49 | 1320 | 1235 | 337.7 |
| A | 9 | 19 | 3911 | 7.92 | 1320 | 1235 | 337.7 |
| B | 2 | 9 | 4222 | 12.29 | 1271 | 1216 | 244.6 |
| B | 12 | 226 | 3673 | 10.05 | 1271 | 1216 | 244.6 |
| B | 5 | 128 | 3638 | 9.9 | 1271 | 1216 | 244.6 |
| C | 1 | 81 | 3796 | 7.62 | 1293 | 1204 | 340.0 |
| C | 1 | 80 | 3757 | 7.51 | 1293 | 1204 | 340.0 |
| C | 9 | 188 | 3388 | 6.42 | 1293 | 1204 | 340.0 |
| D | 11 | 82 | 3946 | 9.02 | 1198 | 1091 | 316.7 |
| D | 6 | 231 | 3261 | 6.85 | 1198 | 1091 | 316.7 |
| D | 6 | 44 | 3157 | 6.52 | 1198 | 1091 | 316.7 |
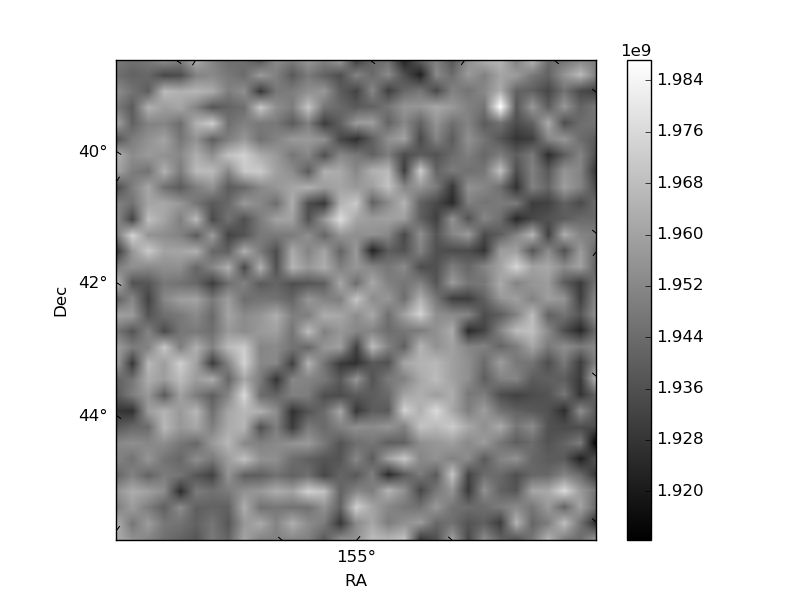
Histogram calculated using DETX and DETY for each event in the final _common_clean file
| Quadrant A |  |
 |
Quadrant B |
|---|---|---|---|
| Quadrant D |  |
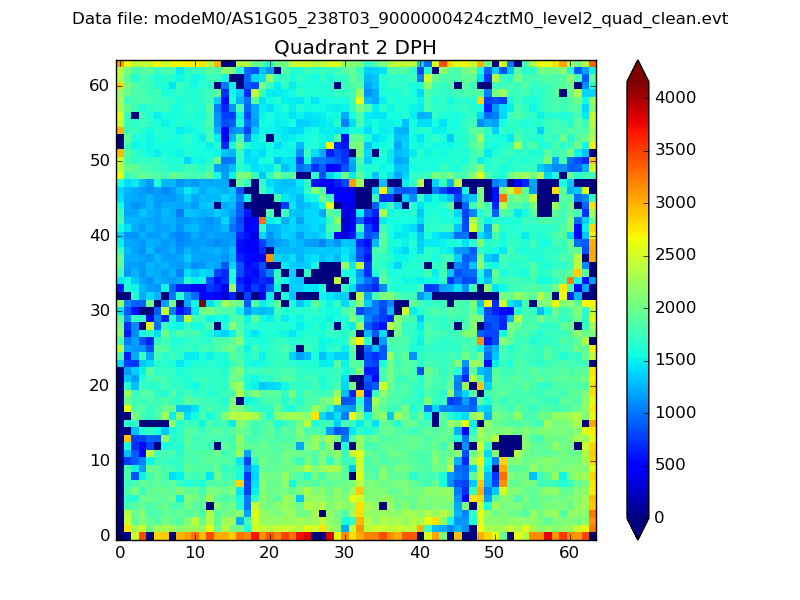 |
Quadrant C |
| Plot type | Count rate plots | Images |
|---|---|---|
| Comparison with Poisson distribution Blue bars denote a histogram of data divided into 1 sec bins. Red curve is a Poisson curve with rate = median count rate of data. |
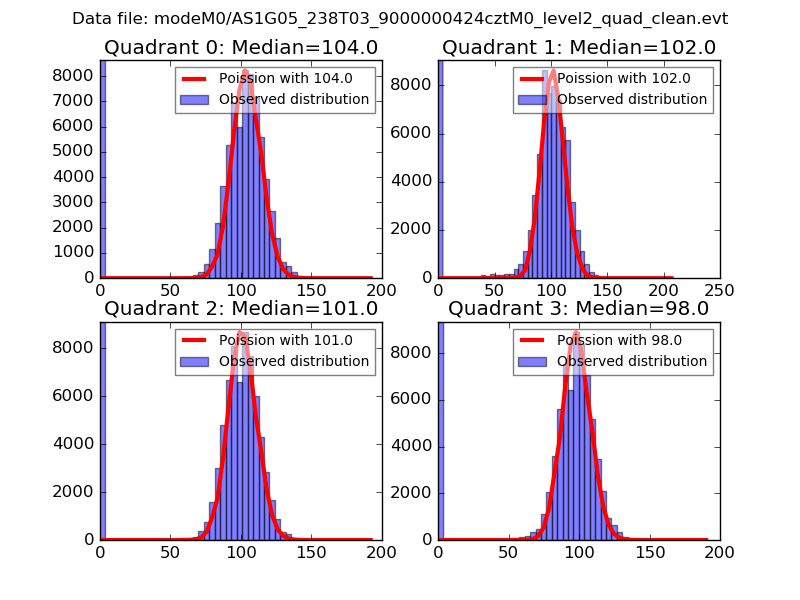 |
 |
| Quadrant-wise count rates Data is divided into 100 sec bins |
 |
|
| Module-wise count rates for Quadrant A Data is divided into 100 sec bins |
 |
 |
| Module-wise count rates for Quadrant B Data is divided into 100 sec bins |
 |
 |
| Module-wise count rates for Quadrant C Data is divided into 100 sec bins |
 |
 |
| Module-wise count rates for Quadrant D Data is divided into 100 sec bins |
 |
 |
| Parameter | Plot |
|---|---|
| CZT HV Monitor |  |
| D_VDD | 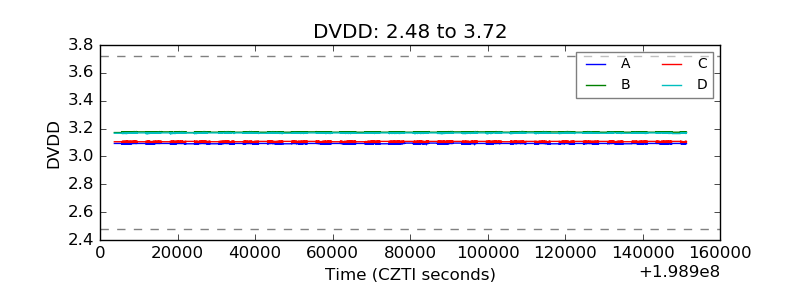 |
| Temperature 1 |  |
| Veto HV Monitor |  |
| Veto LLD |  |
| Alpha Counter |  |
| _CPM_Rate |  |
| CZT Counter |  |
| +2.5 Volts monitor |  |
| +5 Volts monitor |  |
| _ROLL_ROT | 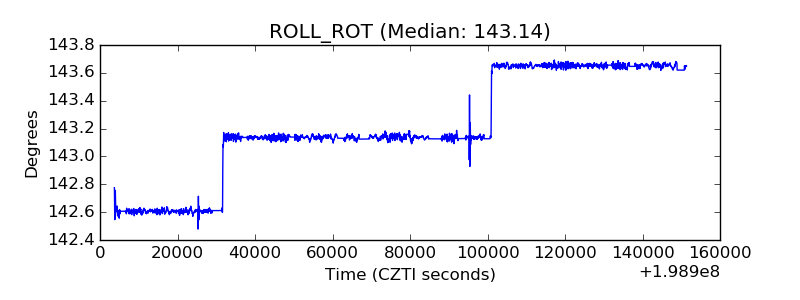 |
| _Roll_DEC |  |
| _Roll_RA |  |
| Veto Counter |  |