| Param | Original file | Final file |
|---|---|---|
| Filename | modeM0/AS1G05_238T03_9000000424_03052cztM0_level2.evt | modeM0/AS1G05_238T03_9000000424_03052cztM0_level2_quad_clean.evt |
| Size (bytes) | 367,827,840 | 44,974,080 |
| Size | 350.8 MB | 42.9 MB |
| Events in quadrant A | 2,362,391 | 261,708 |
| Events in quadrant B | 2,823,257 | 249,011 |
| Events in quadrant C | 2,401,724 | 252,846 |
| Events in quadrant D | 3,205,647 | 240,633 |
| Mode M0 | |||
|---|---|---|---|
| Quadrant | BADHDUFLAG | Total packets | Discarded packets |
| A | 0 | 10357 | 3 |
| B | 0 | 11635 | 2 |
| C | 0 | 10554 | 2 |
| D | 0 | 13044 | 2 |
| Mode M9 | |||
|---|---|---|---|
| Quadrant | BADHDUFLAG | Total packets | Discarded packets |
| A | 0 | 34 | 0 |
| B | 0 | 34 | 0 |
| C | 0 | 34 | 0 |
| D | 0 | 35 | 0 |
| Mode SS | |||
|---|---|---|---|
| Quadrant | BADHDUFLAG | Total packets | Discarded packets |
| A | 0 | 104 | 0 |
| B | 0 | 104 | 0 |
| C | 0 | 104 | 0 |
| D | 0 | 104 | 0 |
| Quadrant | Total seconds | Saturated seconds | Saturation percentage |
|---|---|---|---|
| A | 5091 | 6 | 0.117855% |
| B | 5091 | 181 | 3.555294% |
| C | 5091 | 11 | 0.216068% |
| D | 5091 | 45 | 0.883913% |
Noise dominated data is calculated using 1-second bins in cleaned event files. If a bin has >2000 counts, and if more than 50% of those come from <1% of pixels, then it is considered to be noise-dominated and hence unusable.
| Quadrant | # 1 sec bins | Bins with >0 counts | Bins with >2000 counts | High rate bins dominated by noise | Noise dominated (total time) | Noise dominated (detector-on time) | Marked lightcurve |
|---|---|---|---|---|---|---|---|
| A | 7247 | 5092 | 0 | 0 | 0.00% | 0.00% | 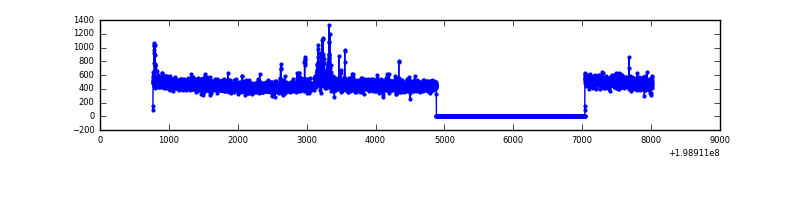 |
| B | 7247 | 5092 | 170 | 170 | 2.35% | 3.34% | 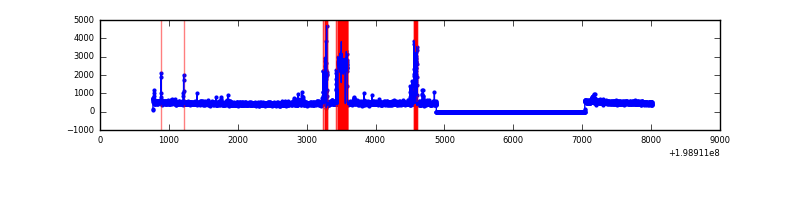 |
| C | 7247 | 5092 | 8 | 8 | 0.11% | 0.16% | 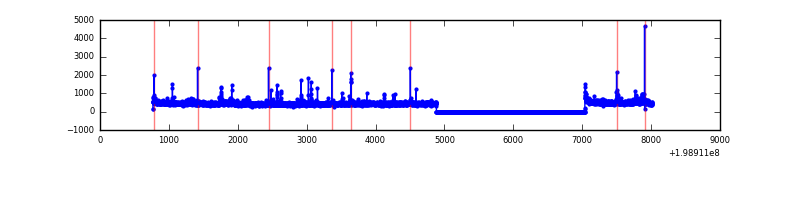 |
| D | 7247 | 5092 | 40 | 40 | 0.55% | 0.79% |  |
Top three noisy pixels from each quadrant. If the there are fewer than three noisy pixels in the level2.evt file, extra rows are filled as -1
| Pixel properties | Quadrant properties | ||||||
|---|---|---|---|---|---|---|---|
| Quadrant | DetID | PixID | Counts | Sigma | Mean | Median | Sigma |
| A | 0 | 50 | 43693 | 356.2 | 595 | 583 | 121.0 |
| A | 3 | 1 | 18011 | 144.0 | 595 | 583 | 121.0 |
| A | 13 | 251 | 7126 | 54.06 | 595 | 583 | 121.0 |
| B | 0 | 230 | 407807 | 3600.13 | 590 | 578 | 113.1 |
| B | 2 | 249 | 64158 | 562.08 | 590 | 578 | 113.1 |
| B | 0 | 219 | 22037 | 189.71 | 590 | 578 | 113.1 |
| C | 1 | 192 | 66298 | 500.34 | 567 | 572 | 131.4 |
| C | 6 | 80 | 64487 | 486.55 | 567 | 572 | 131.4 |
| C | 4 | 207 | 12776 | 92.9 | 567 | 572 | 131.4 |
| D | 13 | 114 | 795567 | 5842.36 | 565 | 550 | 136.1 |
| D | 2 | 232 | 89264 | 651.93 | 565 | 550 | 136.1 |
| D | 2 | 152 | 83488 | 609.49 | 565 | 550 | 136.1 |
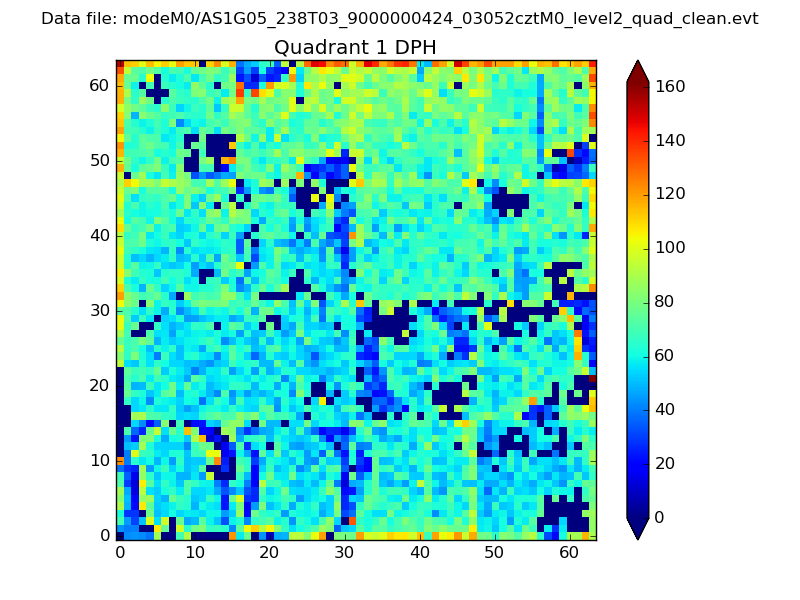
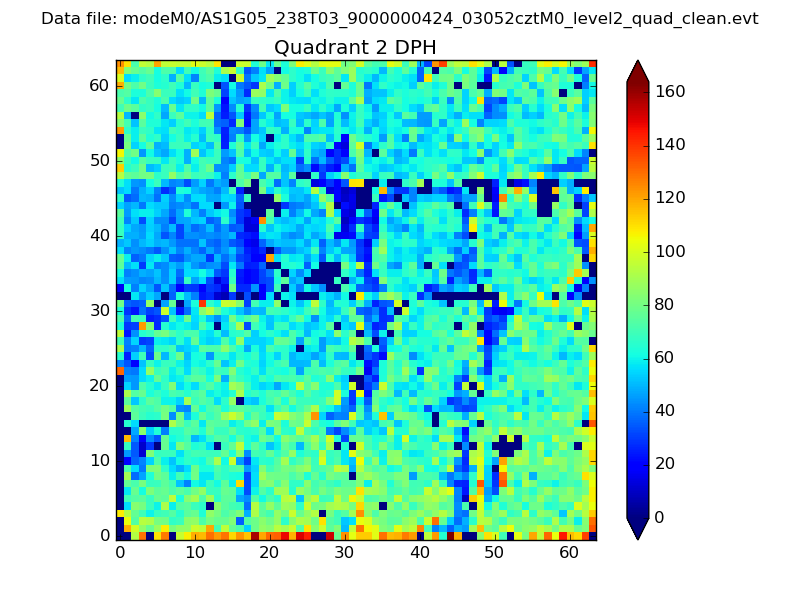
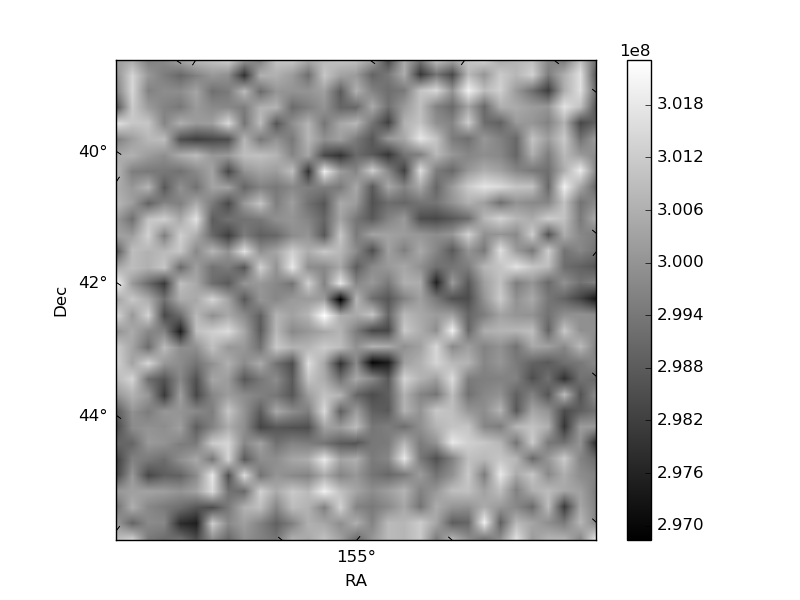
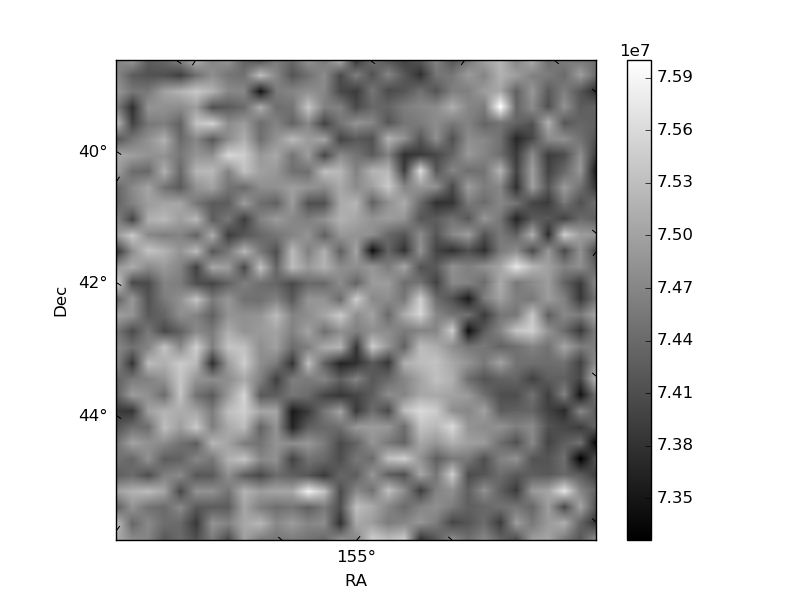
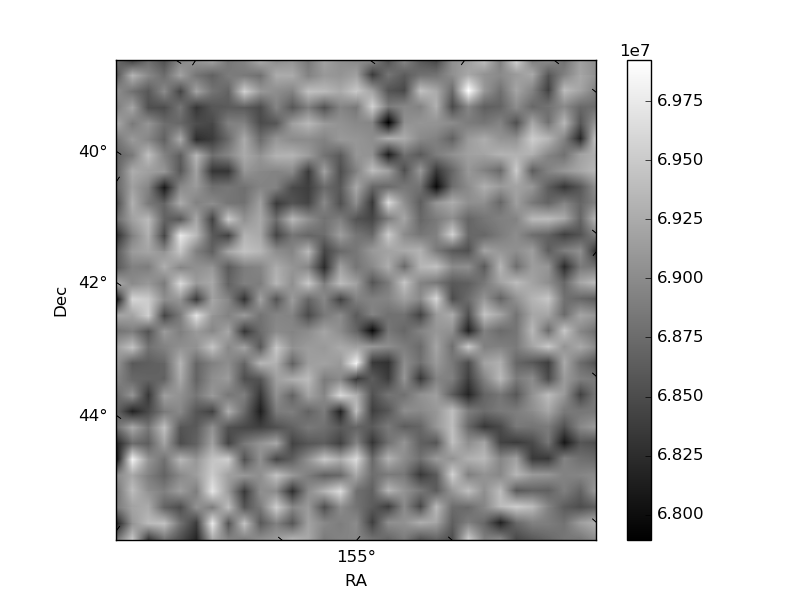
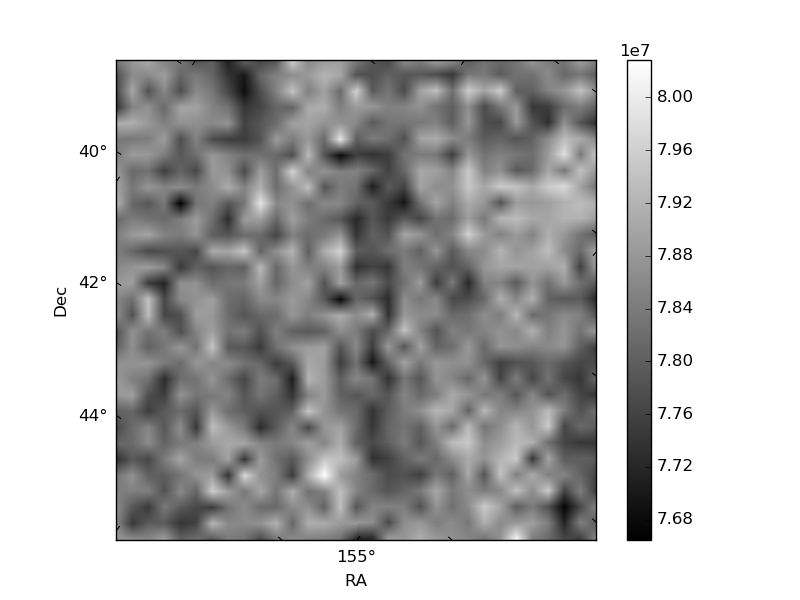
Histogram calculated using DETX and DETY for each event in the final _common_clean file
| Quadrant A | 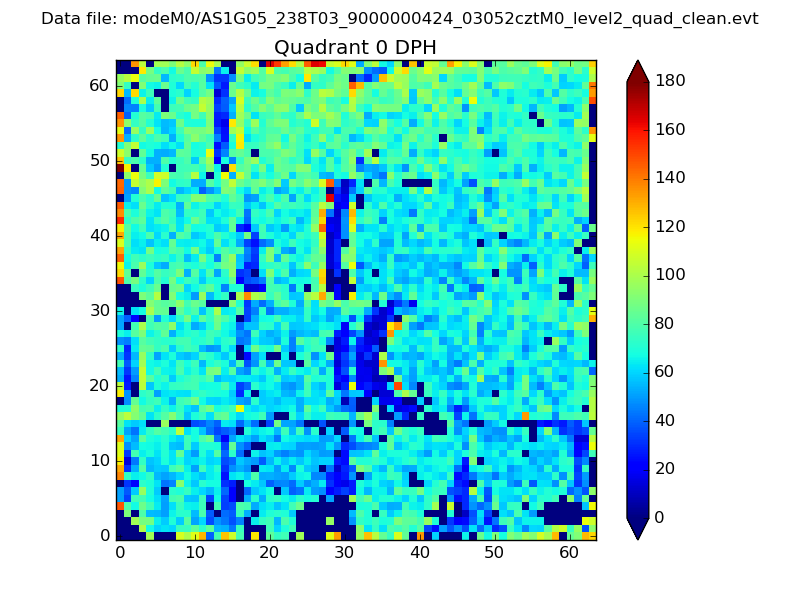 |
 |
Quadrant B |
|---|---|---|---|
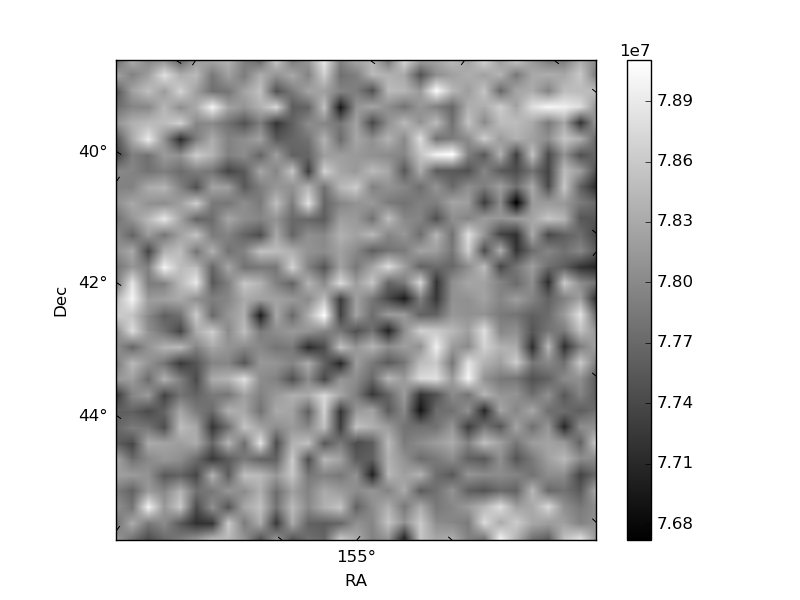
| Quadrant D | 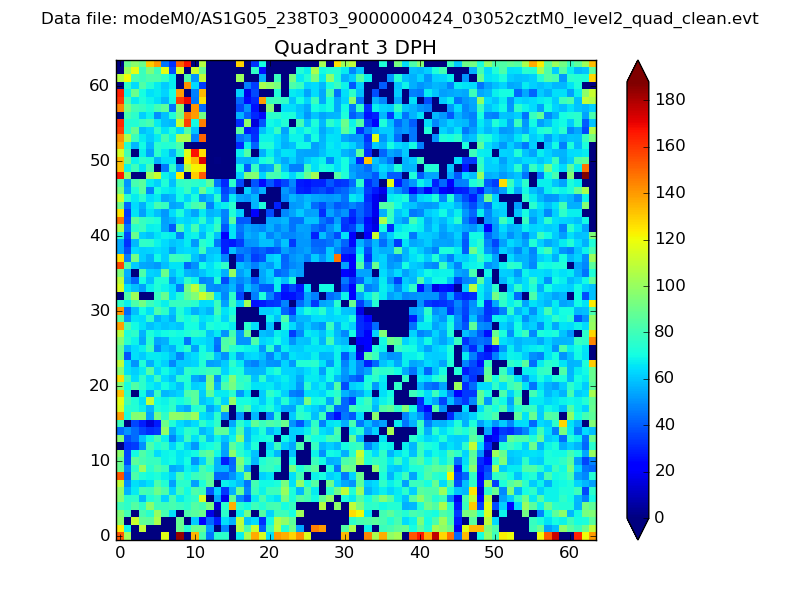 |
 |
Quadrant C |
| Plot type | Count rate plots | Images |
|---|---|---|
| Comparison with Poisson distribution Blue bars denote a histogram of data divided into 1 sec bins. Red curve is a Poisson curve with rate = median count rate of data. |
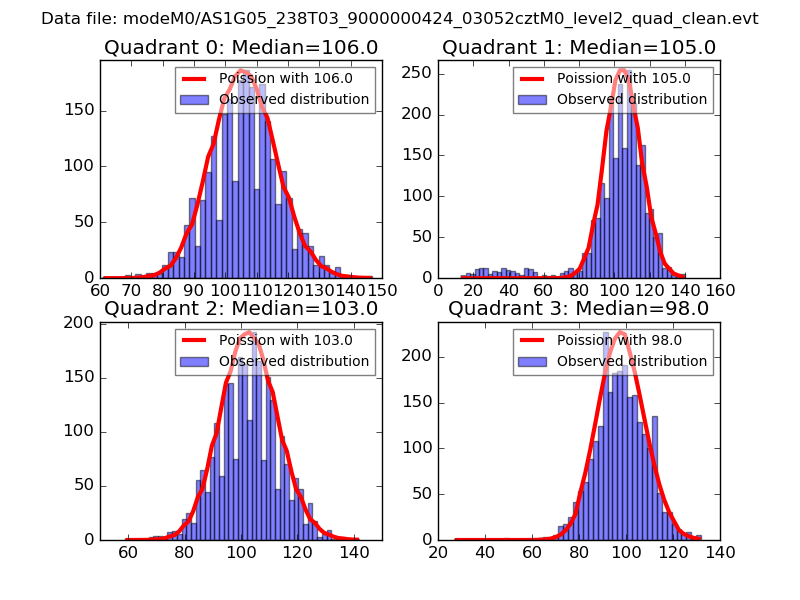 |
 |
| Quadrant-wise count rates Data is divided into 100 sec bins |
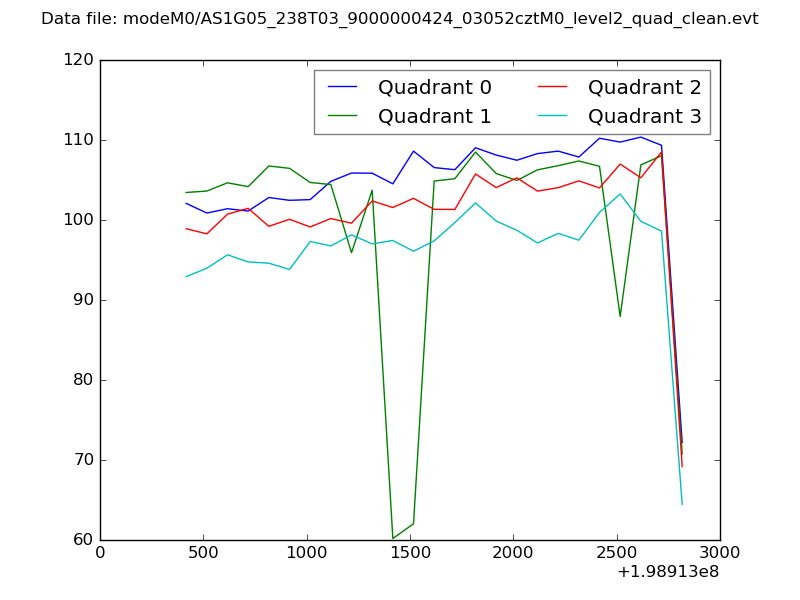 |
|
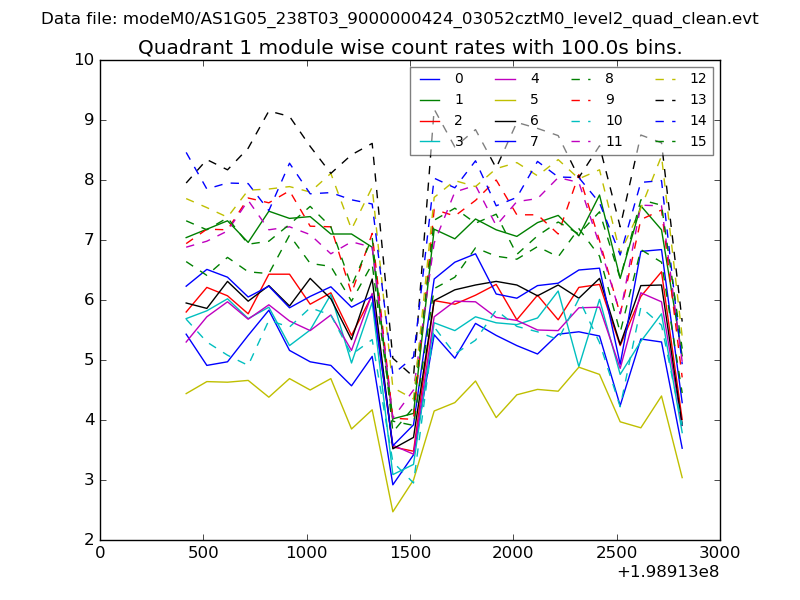
| Module-wise count rates for Quadrant A Data is divided into 100 sec bins |
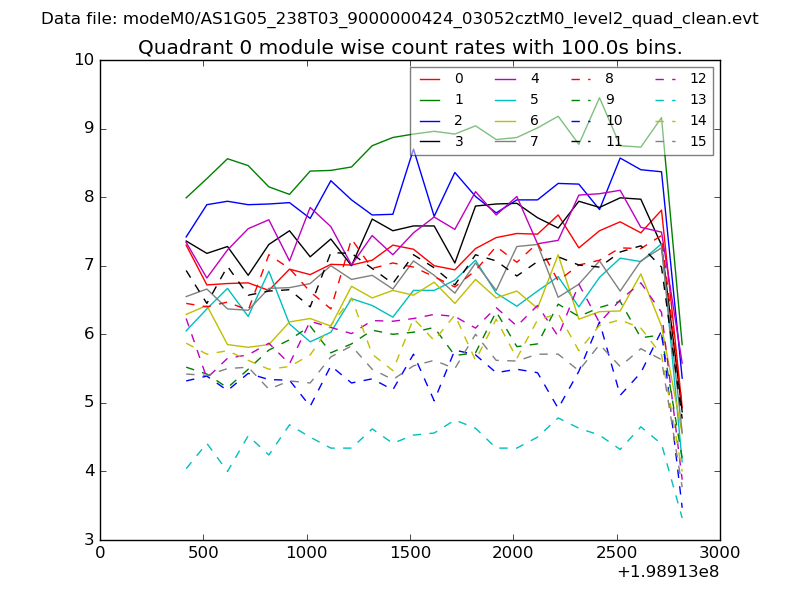 |
 |
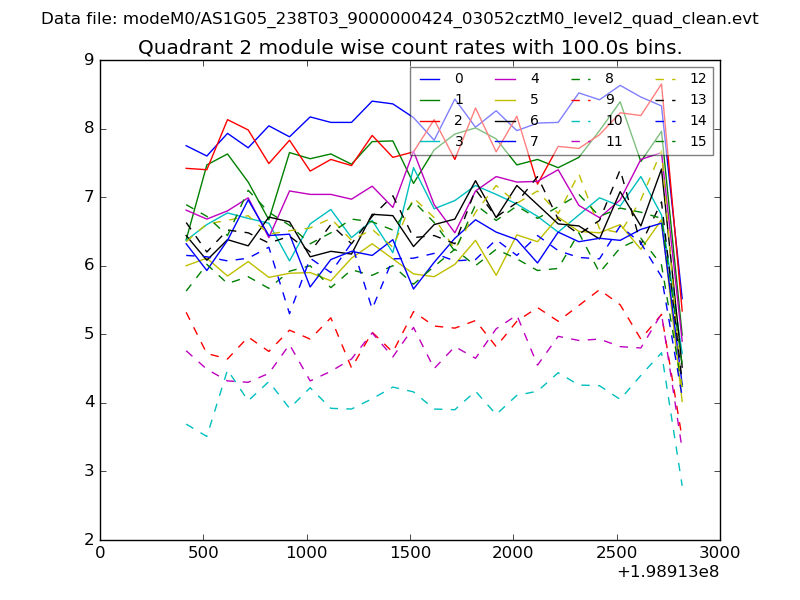
| Module-wise count rates for Quadrant B Data is divided into 100 sec bins |
 |
 |
| Module-wise count rates for Quadrant C Data is divided into 100 sec bins |
 |
 |
| Module-wise count rates for Quadrant D Data is divided into 100 sec bins |
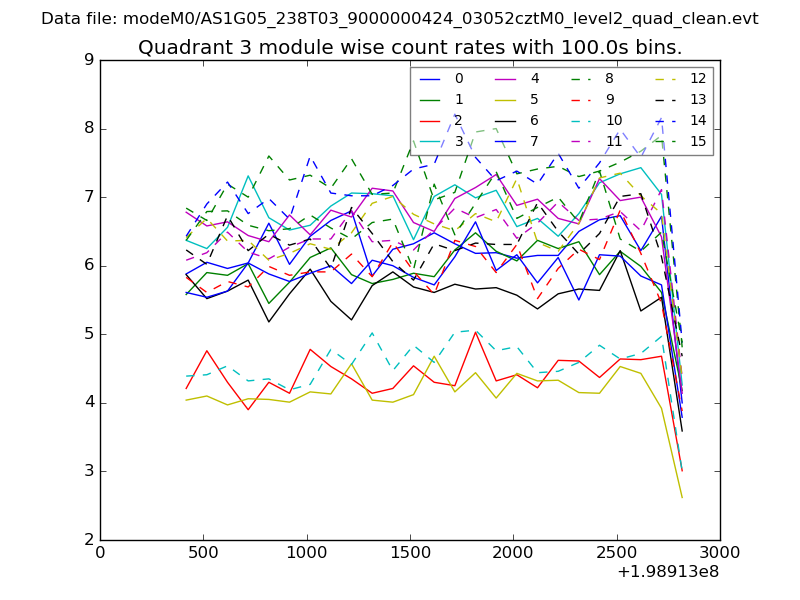 |
 |
| Parameter | Plot |
|---|---|
| CZT HV Monitor | 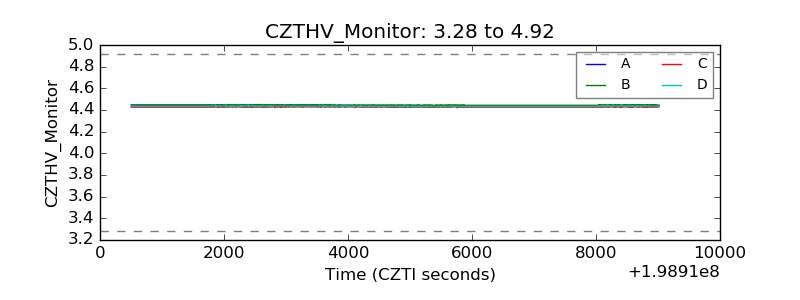 |
| D_VDD | 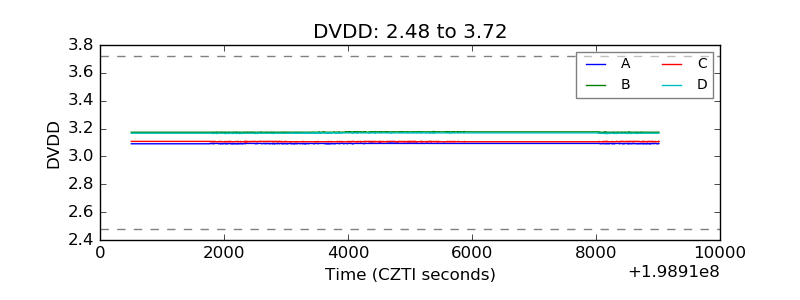 |
| Temperature 1 | 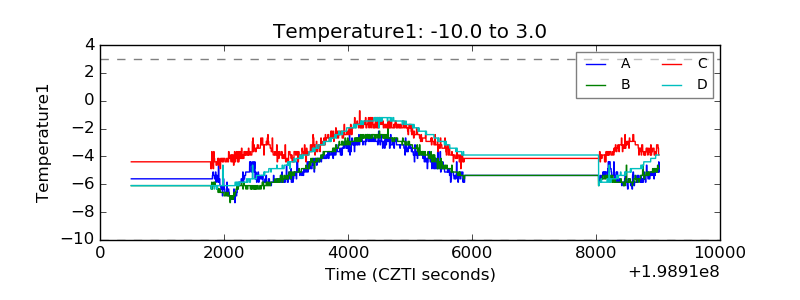 |
| Veto HV Monitor | 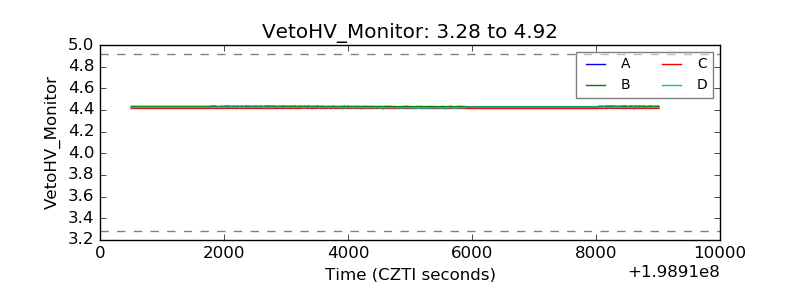 |
| Veto LLD | 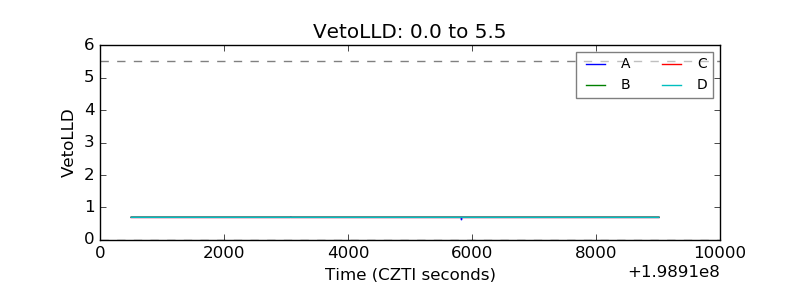 |
| Alpha Counter | 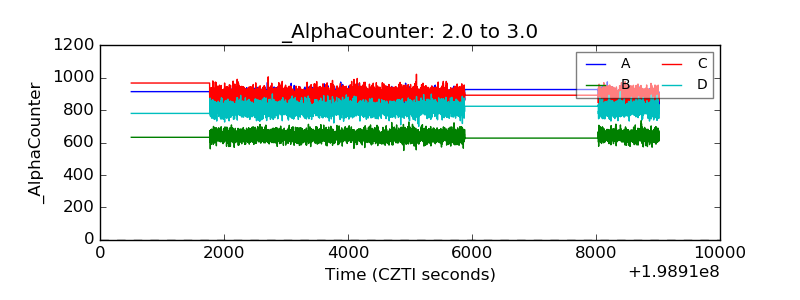 |
| _CPM_Rate | 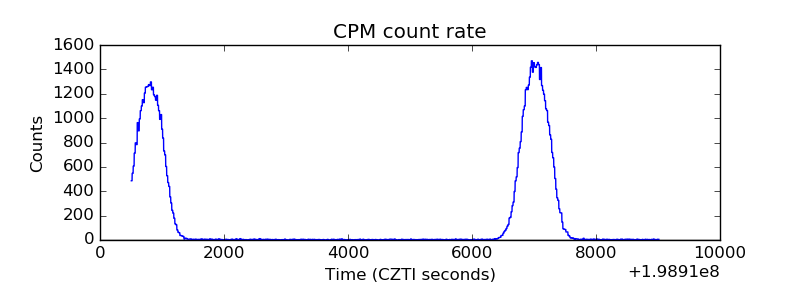 |
| CZT Counter | 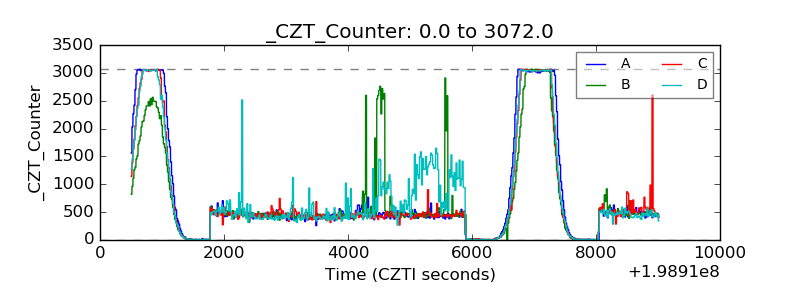 |
| +2.5 Volts monitor |  |
| +5 Volts monitor |  |
| _ROLL_ROT | 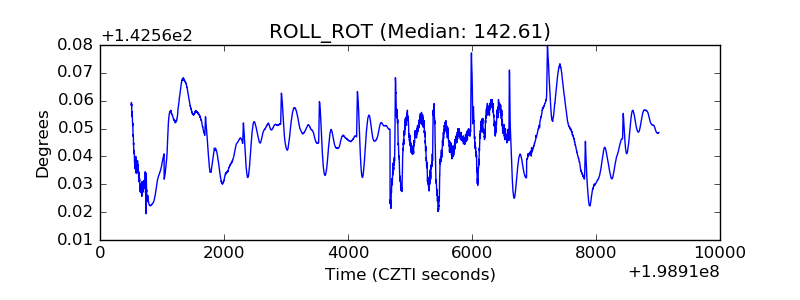 |
| _Roll_DEC | 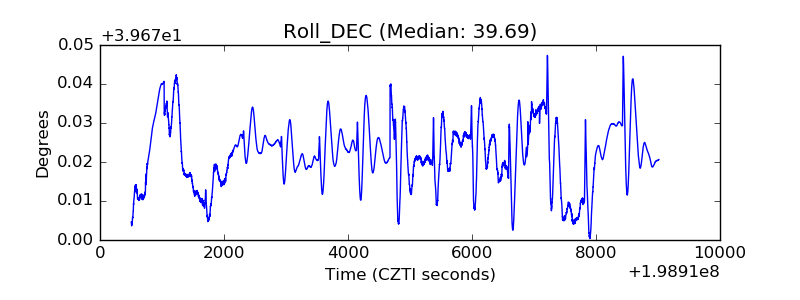 |
| _Roll_RA | 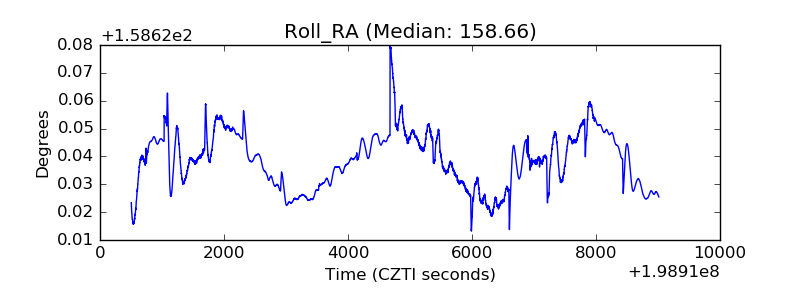 |
| Veto Counter | 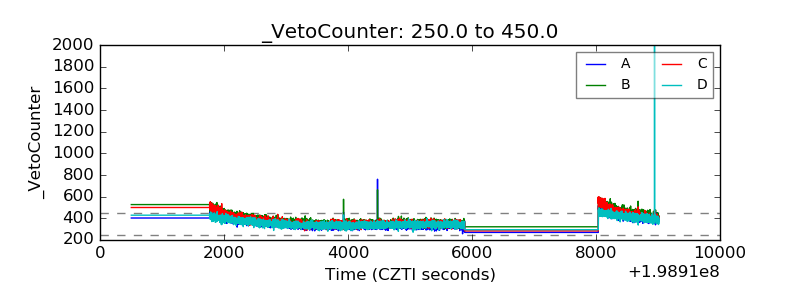 |