| Param | Original file | Final file |
|---|---|---|
| Filename | modeM0/AS1G05_238T03_9000000424_03053cztM0_level2.evt | modeM0/AS1G05_238T03_9000000424_03053cztM0_level2_quad_clean.evt |
| Size (bytes) | 380,044,800 | 54,829,440 |
| Size | 362.4 MB | 52.3 MB |
| Events in quadrant A | 2,367,894 | 337,295 |
| Events in quadrant B | 2,655,179 | 336,481 |
| Events in quadrant C | 2,367,584 | 326,375 |
| Events in quadrant D | 3,774,219 | 304,419 |
| Mode M0 | |||
|---|---|---|---|
| Quadrant | BADHDUFLAG | Total packets | Discarded packets |
| A | 0 | 10234 | 3 |
| B | 0 | 11171 | 2 |
| C | 0 | 10371 | 2 |
| D | 0 | 14628 | 2 |
| Mode M9 | |||
|---|---|---|---|
| Quadrant | BADHDUFLAG | Total packets | Discarded packets |
| A | 0 | 32 | 0 |
| B | 0 | 32 | 0 |
| C | 0 | 32 | 0 |
| D | 0 | 33 | 0 |
| Mode SS | |||
|---|---|---|---|
| Quadrant | BADHDUFLAG | Total packets | Discarded packets |
| A | 0 | 102 | 0 |
| B | 0 | 102 | 0 |
| C | 0 | 102 | 0 |
| D | 0 | 102 | 0 |
| Quadrant | Total seconds | Saturated seconds | Saturation percentage |
|---|---|---|---|
| A | 5072 | 6 | 0.118297% |
| B | 5072 | 9 | 0.177445% |
| C | 5072 | 9 | 0.177445% |
| D | 5072 | 291 | 5.737382% |
Noise dominated data is calculated using 1-second bins in cleaned event files. If a bin has >2000 counts, and if more than 50% of those come from <1% of pixels, then it is considered to be noise-dominated and hence unusable.
| Quadrant | # 1 sec bins | Bins with >0 counts | Bins with >2000 counts | High rate bins dominated by noise | Noise dominated (total time) | Noise dominated (detector-on time) | Marked lightcurve |
|---|---|---|---|---|---|---|---|
| A | 7196 | 5073 | 1 | 1 | 0.01% | 0.02% | 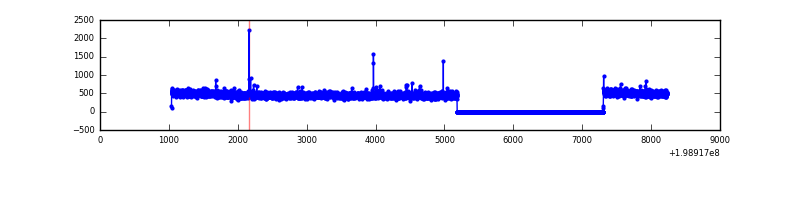 |
| B | 7196 | 5073 | 5 | 5 | 0.07% | 0.10% | 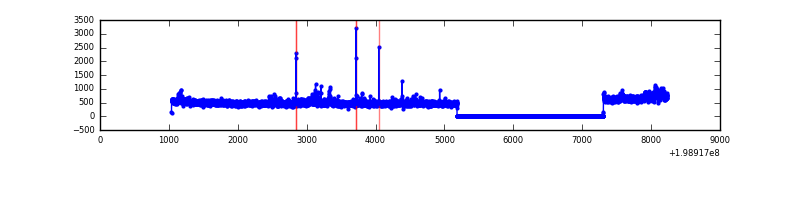 |
| C | 7196 | 5073 | 4 | 4 | 0.06% | 0.08% |  |
| D | 7196 | 5073 | 295 | 295 | 4.10% | 5.82% | 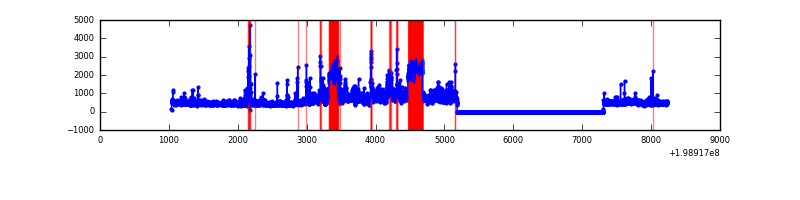 |
Top three noisy pixels from each quadrant. If the there are fewer than three noisy pixels in the level2.evt file, extra rows are filled as -1
| Pixel properties | Quadrant properties | ||||||
|---|---|---|---|---|---|---|---|
| Quadrant | DetID | PixID | Counts | Sigma | Mean | Median | Sigma |
| A | 14 | 249 | 11137 | 85.91 | 607 | 595 | 122.7 |
| A | 0 | 226 | 6721 | 49.92 | 607 | 595 | 122.7 |
| A | 12 | 194 | 6412 | 47.4 | 607 | 595 | 122.7 |
| B | 0 | 230 | 180180 | 1553.62 | 612 | 601 | 115.6 |
| B | 15 | 204 | 32089 | 272.42 | 612 | 601 | 115.6 |
| B | 0 | 219 | 29544 | 250.4 | 612 | 601 | 115.6 |
| C | 1 | 192 | 42887 | 316.3 | 578 | 583 | 133.7 |
| C | 6 | 80 | 24431 | 178.3 | 578 | 583 | 133.7 |
| C | 4 | 207 | 10114 | 71.26 | 578 | 583 | 133.7 |
| D | 13 | 114 | 1279261 | 9296.24 | 572 | 556 | 137.6 |
| D | 2 | 232 | 110925 | 802.39 | 572 | 556 | 137.6 |
| D | 2 | 152 | 70826 | 510.87 | 572 | 556 | 137.6 |
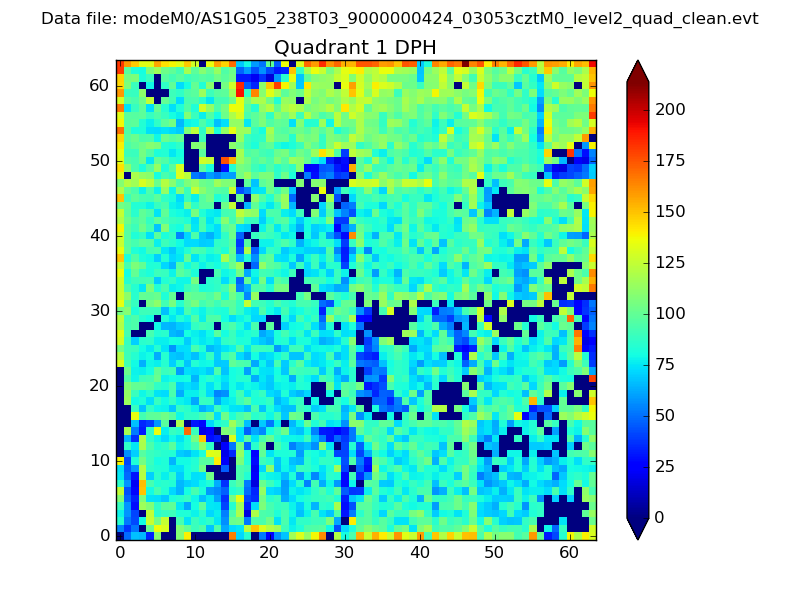
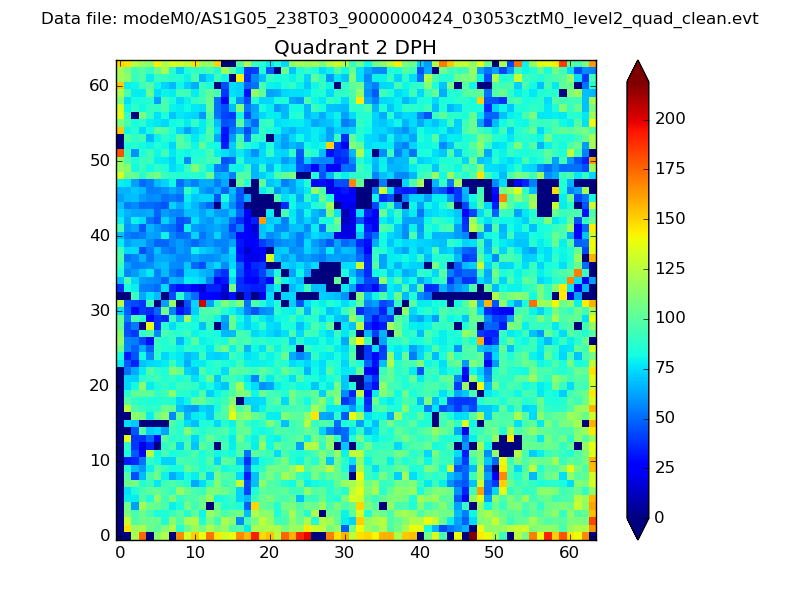
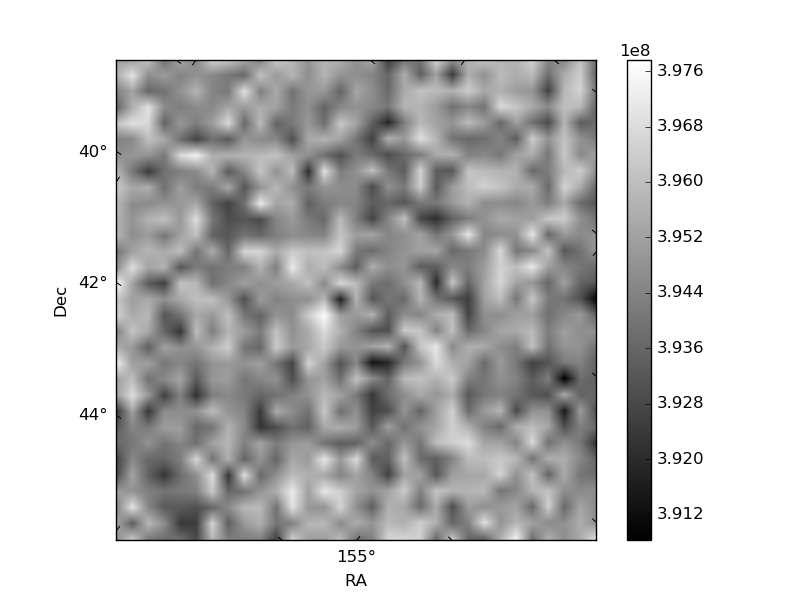
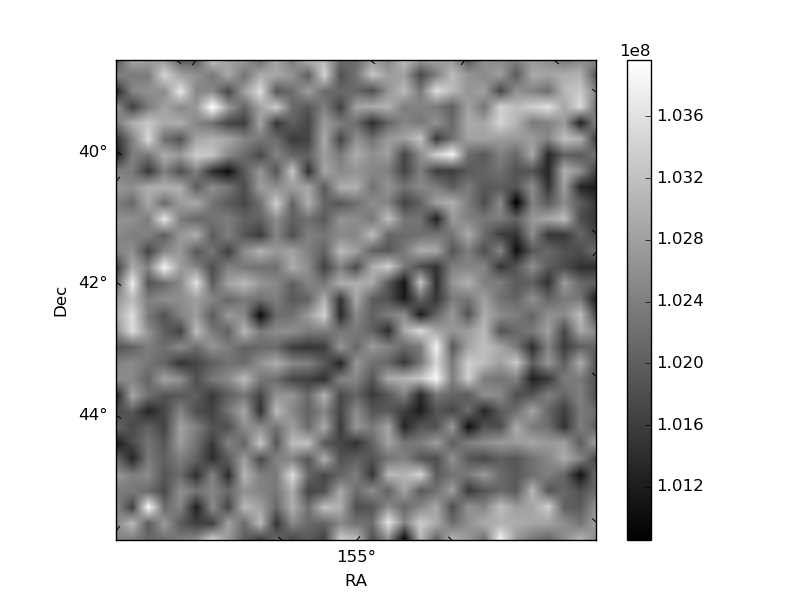
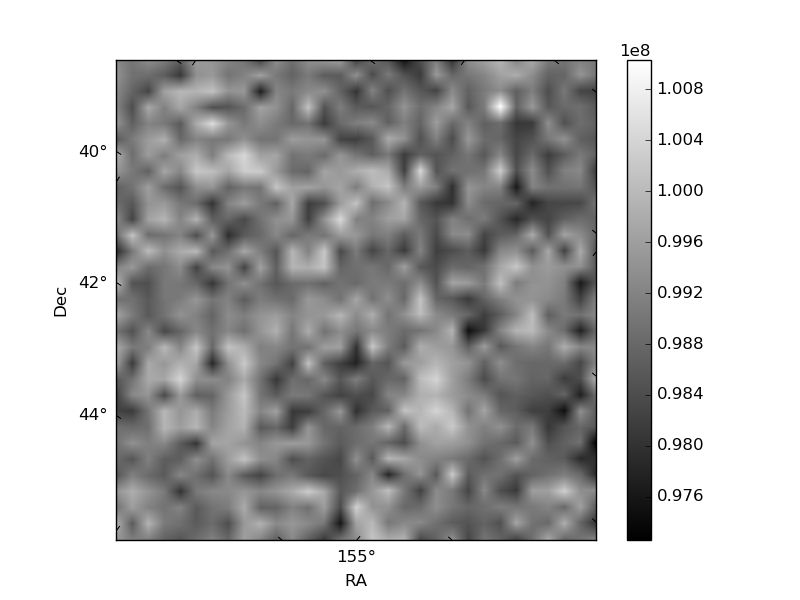
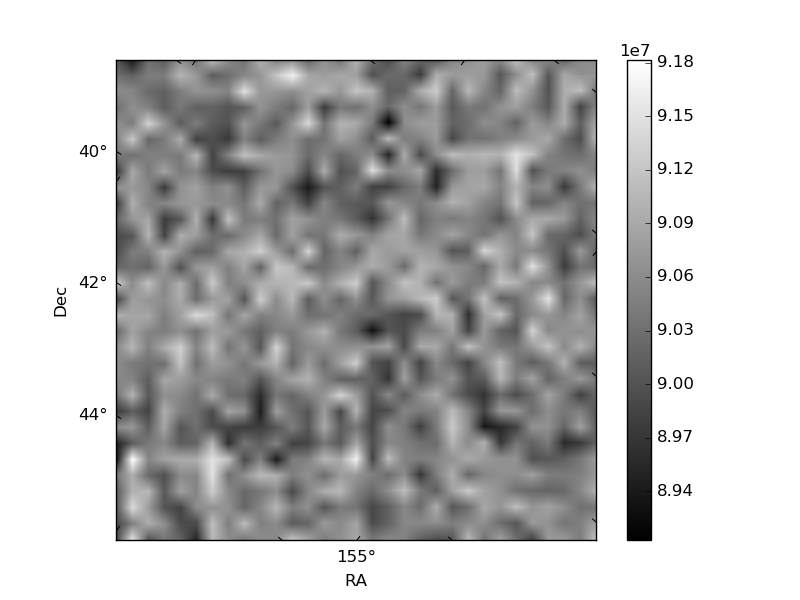
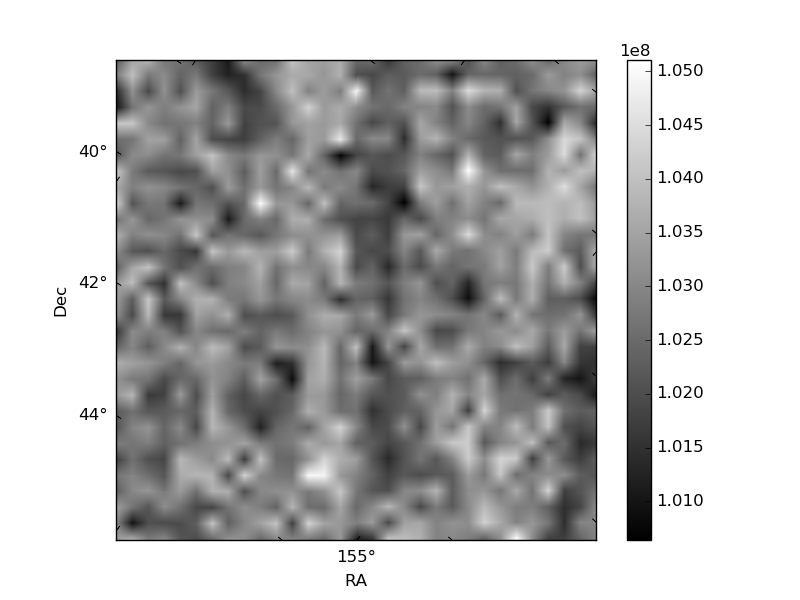
Histogram calculated using DETX and DETY for each event in the final _common_clean file
| Quadrant A | 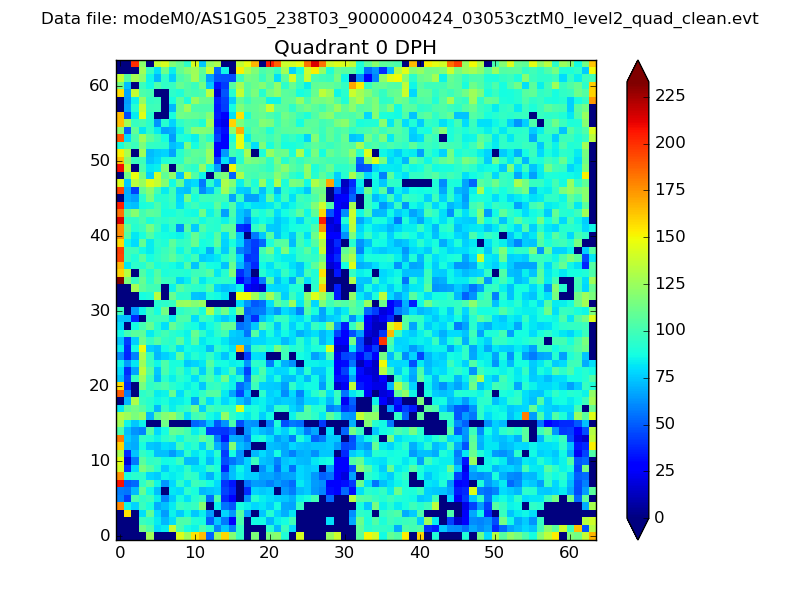 |
 |
Quadrant B |
|---|---|---|---|
| Quadrant D | 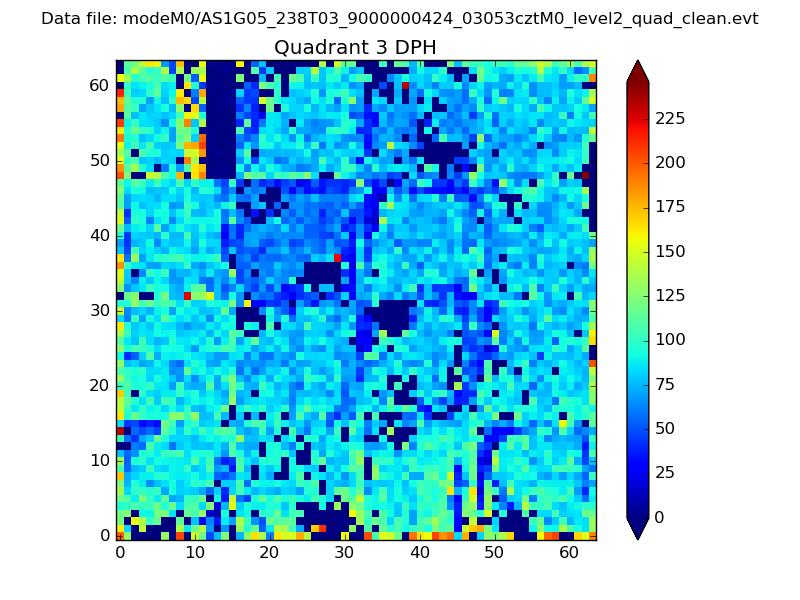 |
 |
Quadrant C |
| Plot type | Count rate plots | Images |
|---|---|---|
| Comparison with Poisson distribution Blue bars denote a histogram of data divided into 1 sec bins. Red curve is a Poisson curve with rate = median count rate of data. |
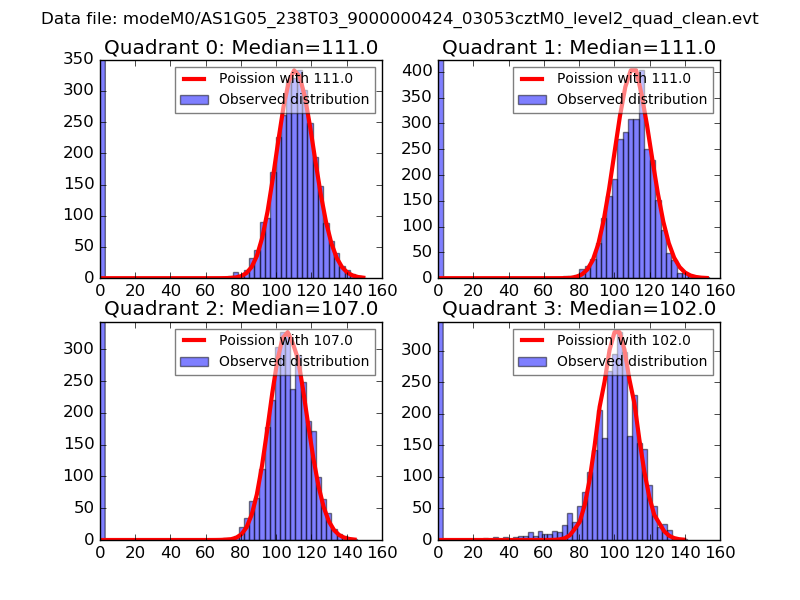 |
 |
| Quadrant-wise count rates Data is divided into 100 sec bins |
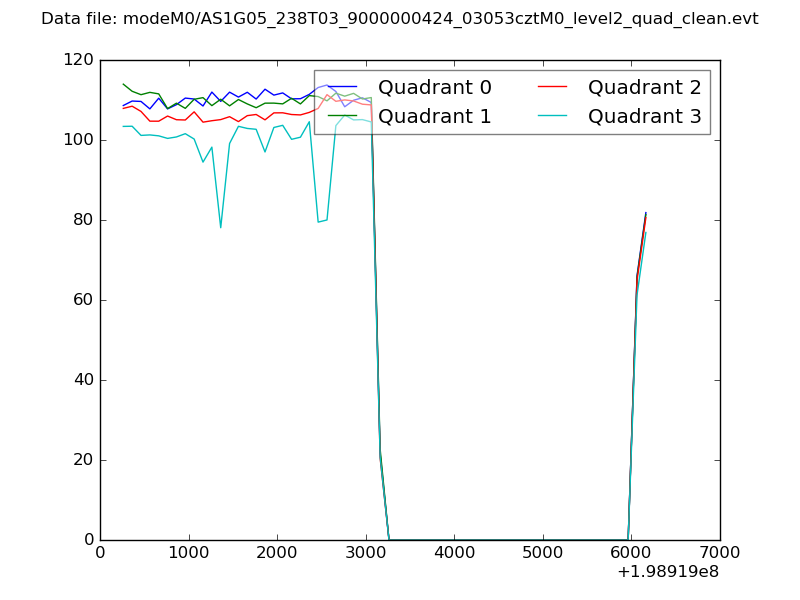 |
|
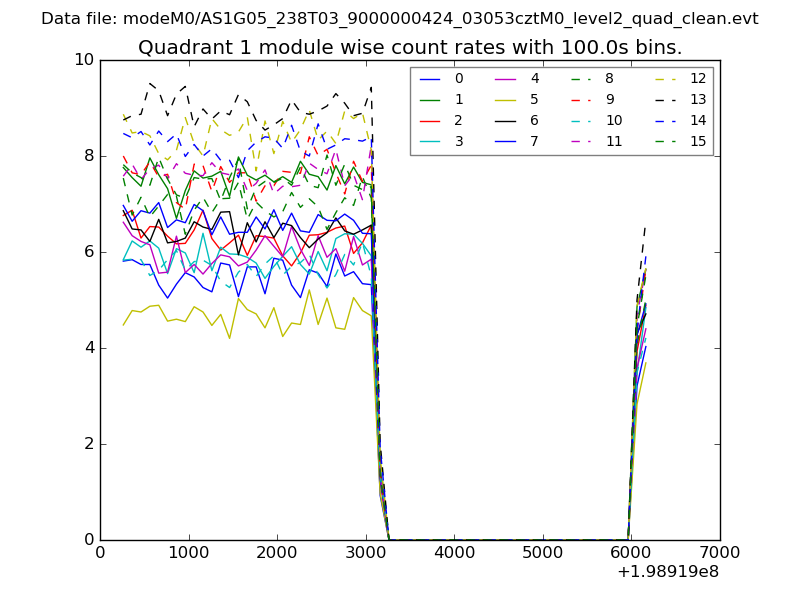
| Module-wise count rates for Quadrant A Data is divided into 100 sec bins |
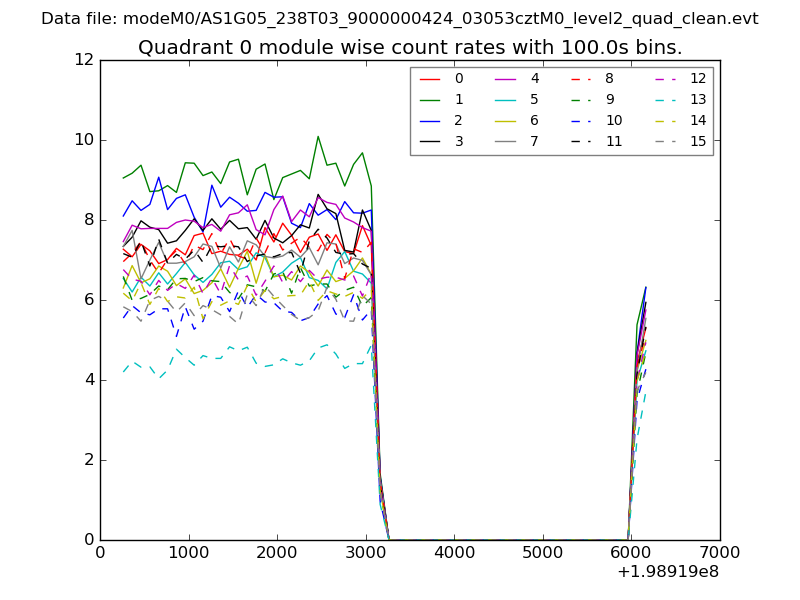 |
 |
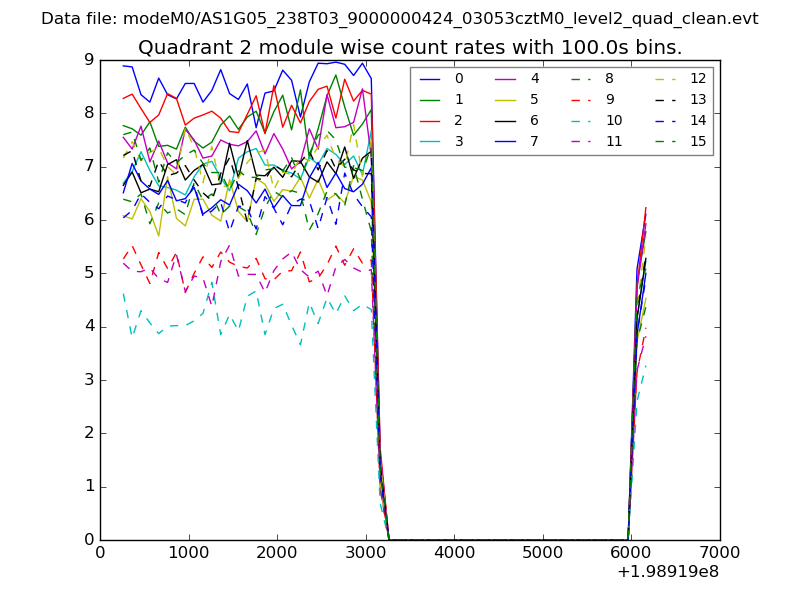
| Module-wise count rates for Quadrant B Data is divided into 100 sec bins |
 |
 |
| Module-wise count rates for Quadrant C Data is divided into 100 sec bins |
 |
 |
| Module-wise count rates for Quadrant D Data is divided into 100 sec bins |
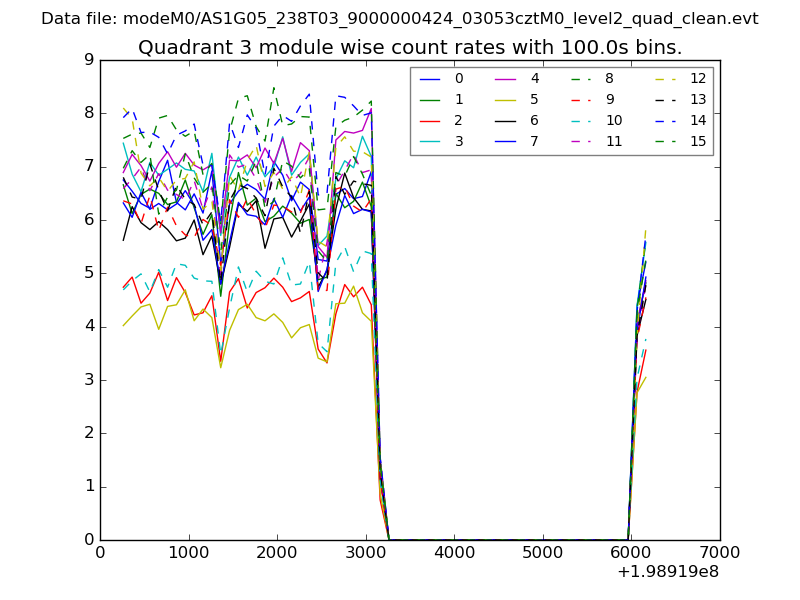 |
 |
| Parameter | Plot |
|---|---|
| CZT HV Monitor |  |
| D_VDD | 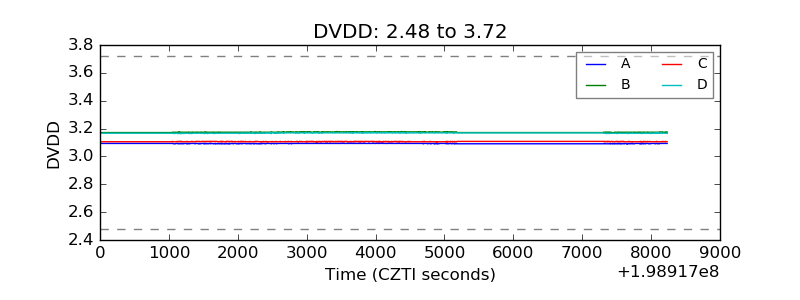 |
| Temperature 1 | 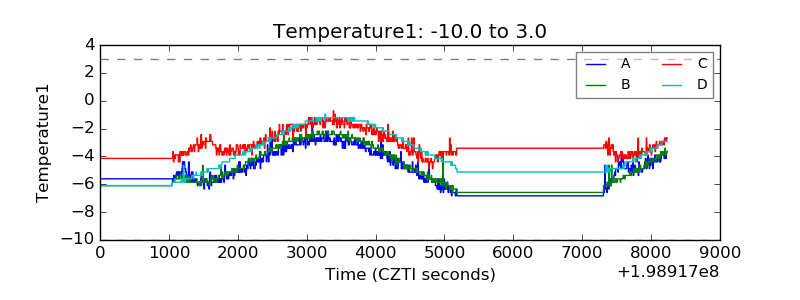 |
| Veto HV Monitor | 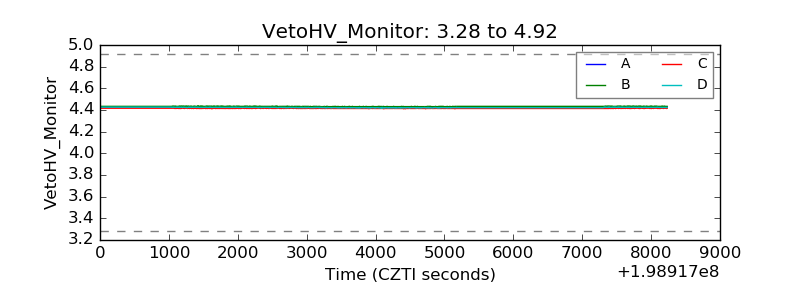 |
| Veto LLD | 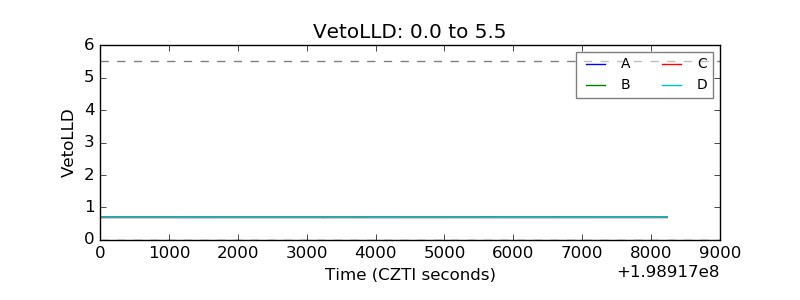 |
| Alpha Counter | 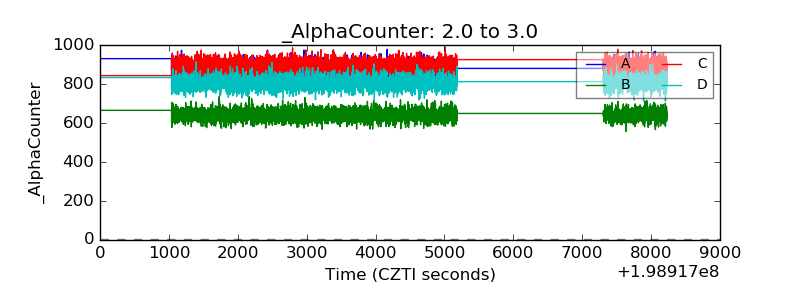 |
| _CPM_Rate | 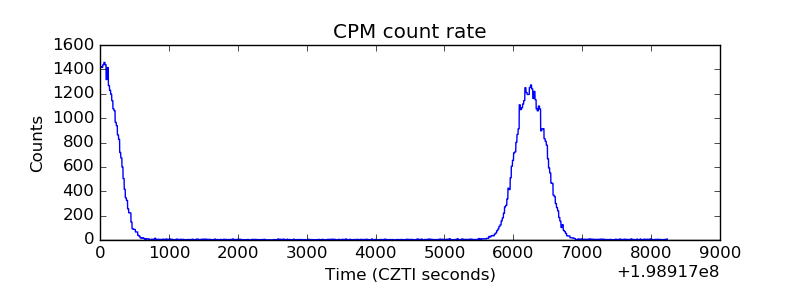 |
| CZT Counter | 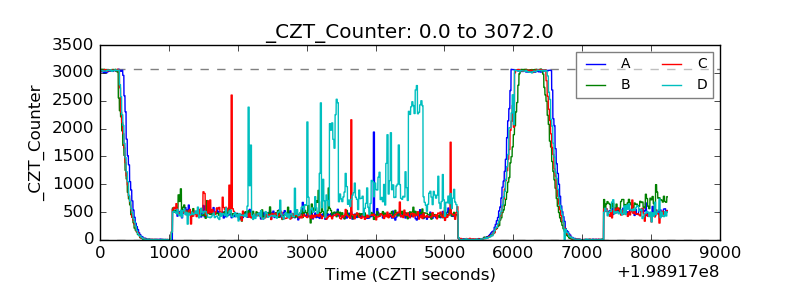 |
| +2.5 Volts monitor |  |
| +5 Volts monitor | 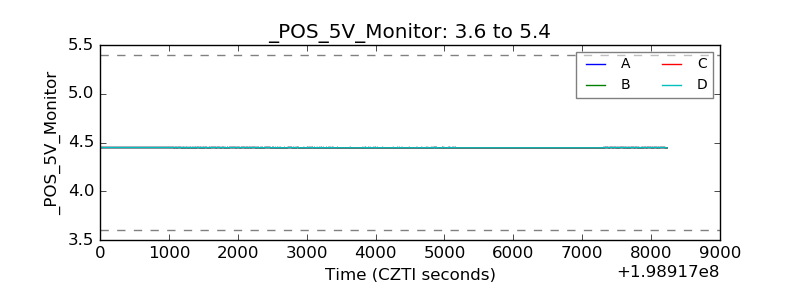 |
| _ROLL_ROT | 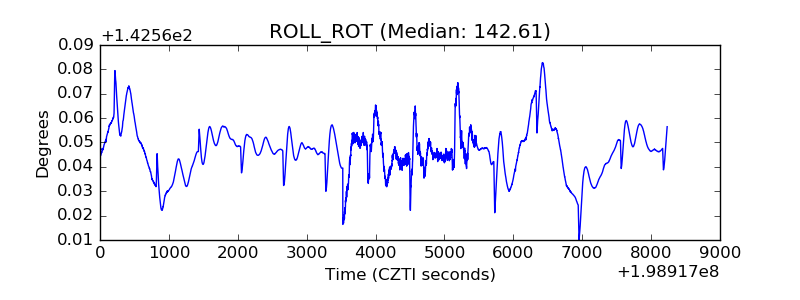 |
| _Roll_DEC | 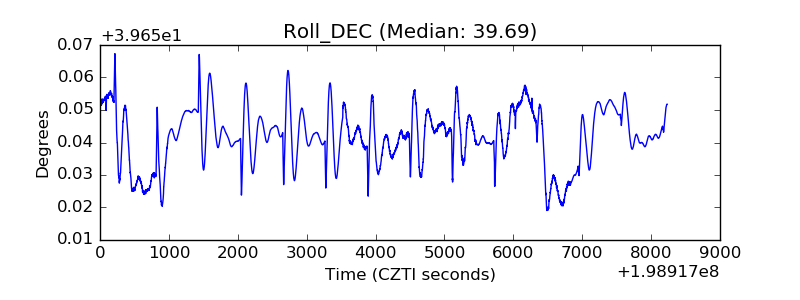 |
| _Roll_RA | 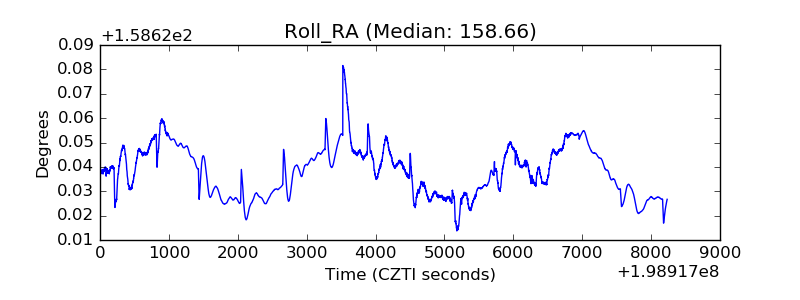 |
| Veto Counter | 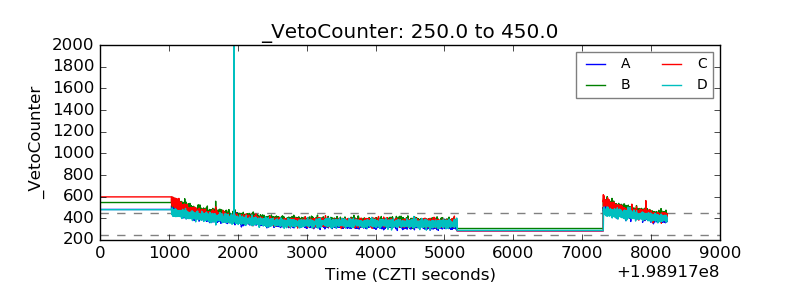 |