| Param | Original file | Final file |
|---|---|---|
| Filename | modeM0/AS1G05_238T03_9000000424_03054cztM0_level2.evt | modeM0/AS1G05_238T03_9000000424_03054cztM0_level2_quad_clean.evt |
| Size (bytes) | 416,093,760 | 66,124,800 |
| Size | 396.8 MB | 63.1 MB |
| Events in quadrant A | 2,322,614 | 428,902 |
| Events in quadrant B | 2,817,230 | 426,856 |
| Events in quadrant C | 2,279,394 | 416,125 |
| Events in quadrant D | 4,843,039 | 380,054 |
| Mode M0 | |||
|---|---|---|---|
| Quadrant | BADHDUFLAG | Total packets | Discarded packets |
| A | 0 | 10058 | 3 |
| B | 0 | 11658 | 2 |
| C | 0 | 10110 | 2 |
| D | 0 | 17692 | 2 |
| Mode M9 | |||
|---|---|---|---|
| Quadrant | BADHDUFLAG | Total packets | Discarded packets |
| A | 0 | 29 | 0 |
| B | 0 | 29 | 0 |
| C | 0 | 29 | 0 |
| D | 0 | 30 | 0 |
| Mode SS | |||
|---|---|---|---|
| Quadrant | BADHDUFLAG | Total packets | Discarded packets |
| A | 0 | 102 | 0 |
| B | 0 | 102 | 0 |
| C | 0 | 102 | 0 |
| D | 0 | 102 | 0 |
| Quadrant | Total seconds | Saturated seconds | Saturation percentage |
|---|---|---|---|
| A | 4990 | 5 | 0.100200% |
| B | 4990 | 15 | 0.300601% |
| C | 4990 | 4 | 0.080160% |
| D | 4990 | 481 | 9.639279% |
Noise dominated data is calculated using 1-second bins in cleaned event files. If a bin has >2000 counts, and if more than 50% of those come from <1% of pixels, then it is considered to be noise-dominated and hence unusable.
| Quadrant | # 1 sec bins | Bins with >0 counts | Bins with >2000 counts | High rate bins dominated by noise | Noise dominated (total time) | Noise dominated (detector-on time) | Marked lightcurve |
|---|---|---|---|---|---|---|---|
| A | 7115 | 4991 | 0 | 0 | 0.00% | 0.00% | 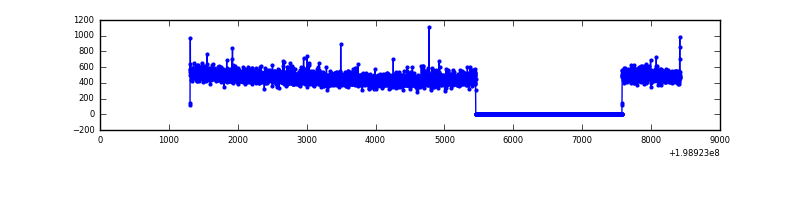 |
| B | 7115 | 4991 | 9 | 9 | 0.13% | 0.18% | 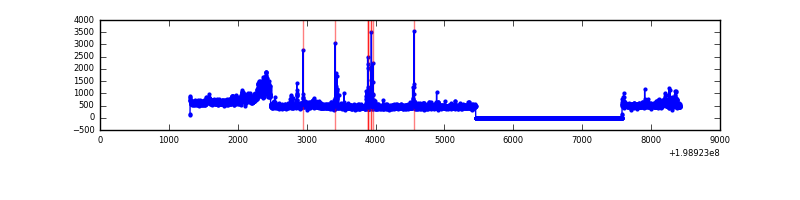 |
| C | 7115 | 4991 | 2 | 2 | 0.03% | 0.04% | 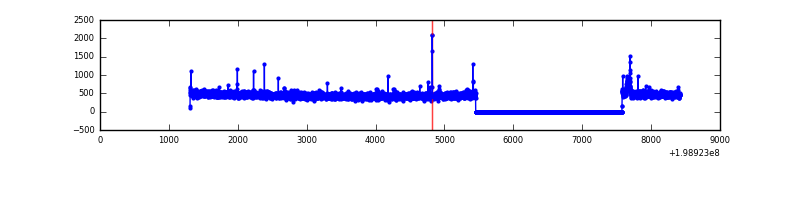 |
| D | 7115 | 4991 | 556 | 556 | 7.81% | 11.14% | 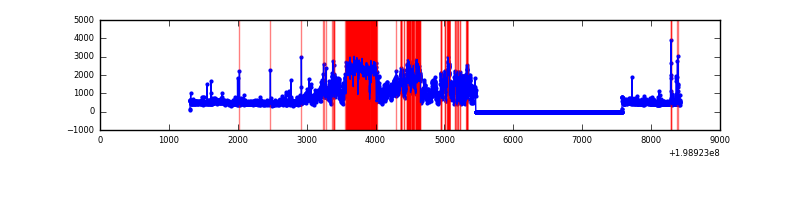 |
Top three noisy pixels from each quadrant. If the there are fewer than three noisy pixels in the level2.evt file, extra rows are filled as -1
| Pixel properties | Quadrant properties | ||||||
|---|---|---|---|---|---|---|---|
| Quadrant | DetID | PixID | Counts | Sigma | Mean | Median | Sigma |
| A | 13 | 251 | 8018 | 62.5 | 595 | 585 | 118.9 |
| A | 3 | 1 | 7126 | 55.0 | 595 | 585 | 118.9 |
| A | 12 | 194 | 6537 | 50.05 | 595 | 585 | 118.9 |
| B | 0 | 230 | 348550 | 3083.2 | 597 | 585 | 112.9 |
| B | 2 | 249 | 47003 | 411.29 | 597 | 585 | 112.9 |
| B | 15 | 204 | 39014 | 340.5 | 597 | 585 | 112.9 |
| C | 6 | 80 | 26764 | 199.18 | 567 | 571 | 131.5 |
| C | 7 | 236 | 10136 | 72.74 | 567 | 571 | 131.5 |
| C | 4 | 207 | 9594 | 68.61 | 567 | 571 | 131.5 |
| D | 13 | 114 | 2380394 | 17350.34 | 561 | 545 | 137.2 |
| D | 2 | 232 | 141153 | 1025.11 | 561 | 545 | 137.2 |
| D | 7 | 80 | 68555 | 495.83 | 561 | 545 | 137.2 |
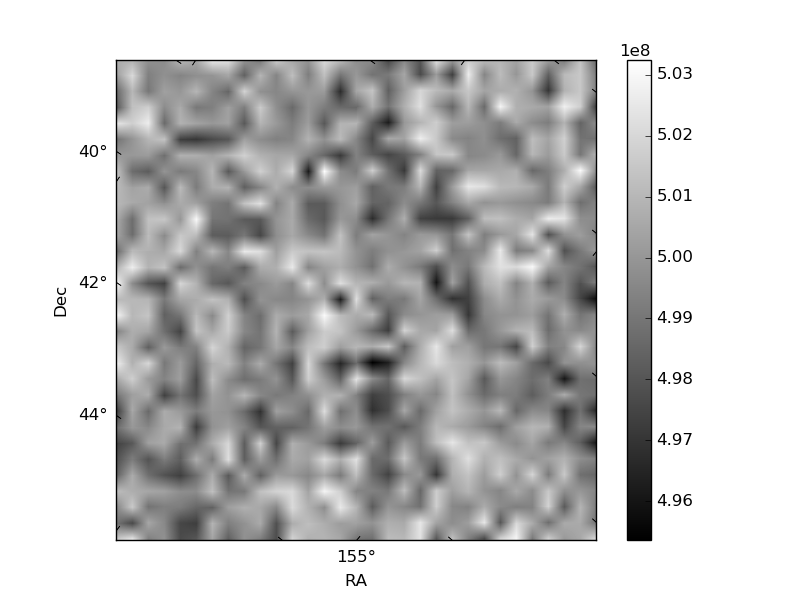
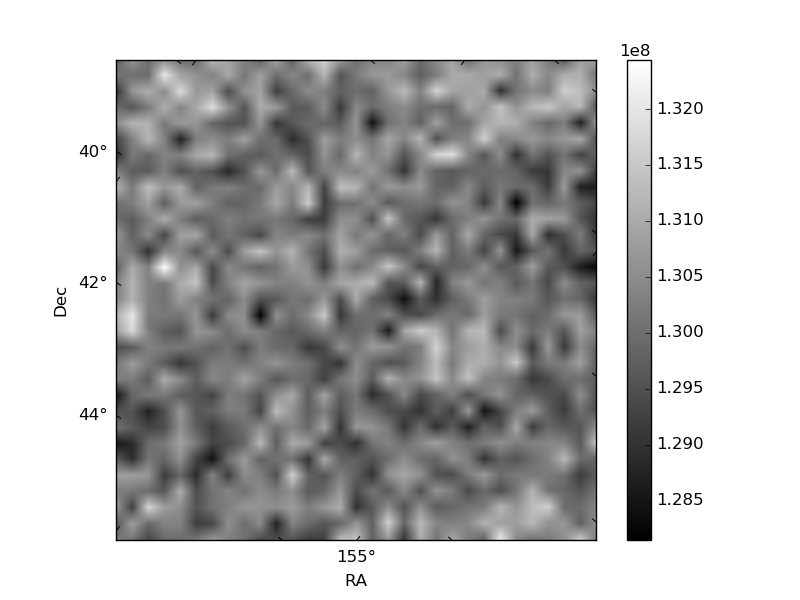
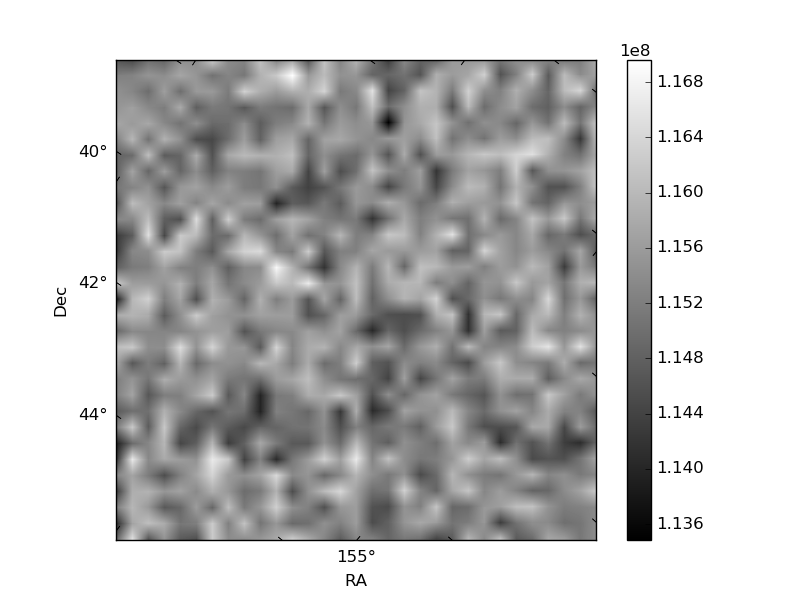
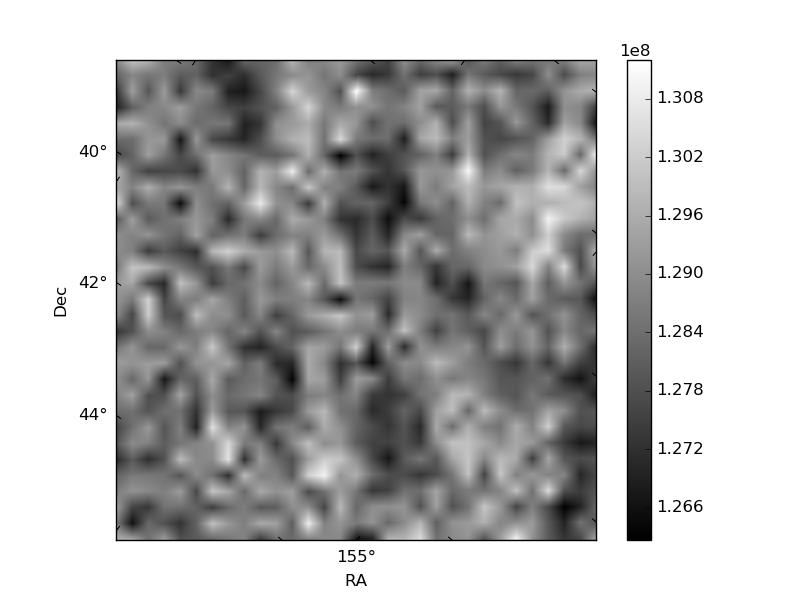
Histogram calculated using DETX and DETY for each event in the final _common_clean file
| Quadrant A | 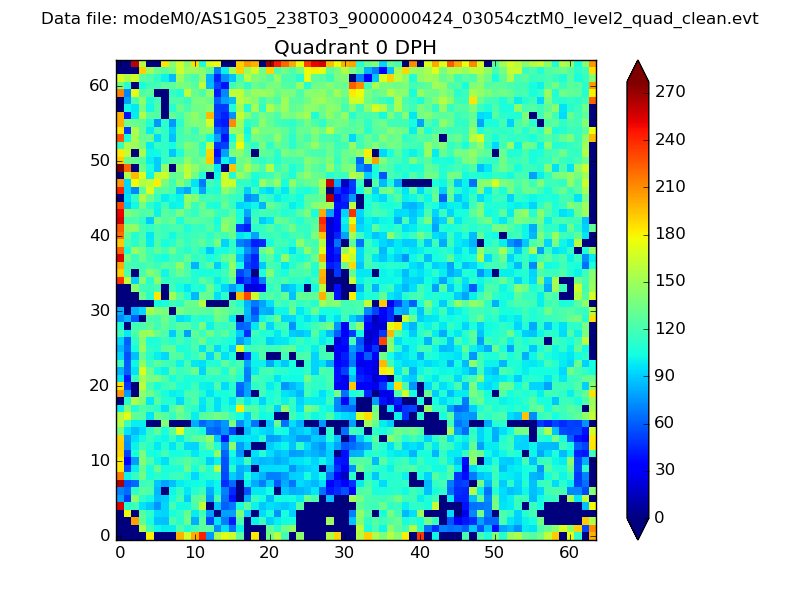 |
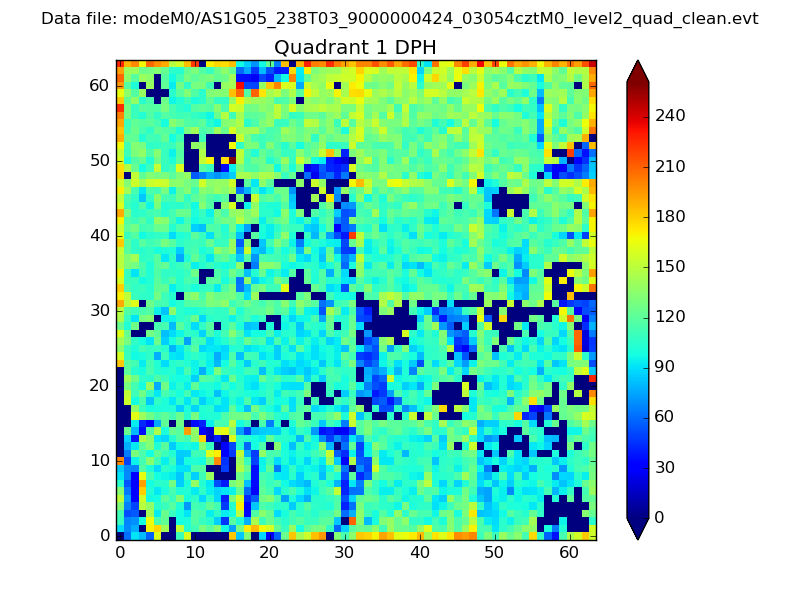 |
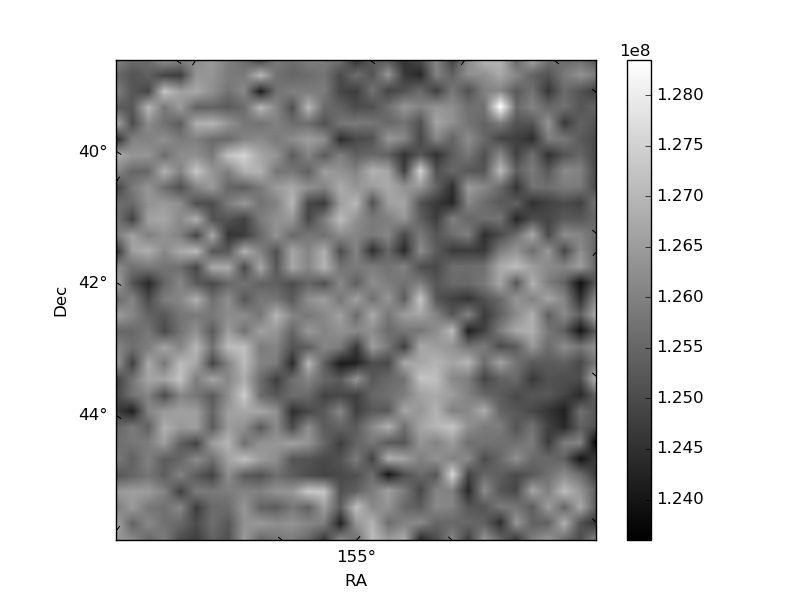
Quadrant B |
|---|---|---|---|
| Quadrant D | 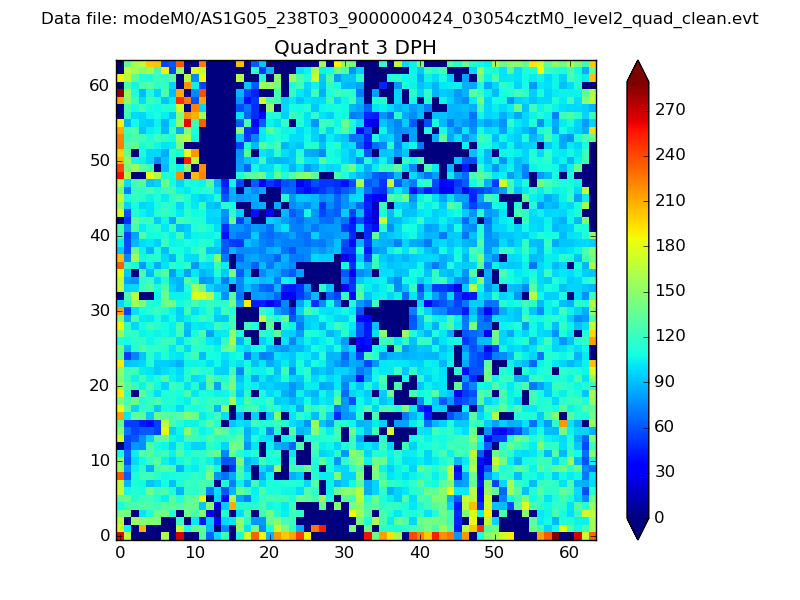 |
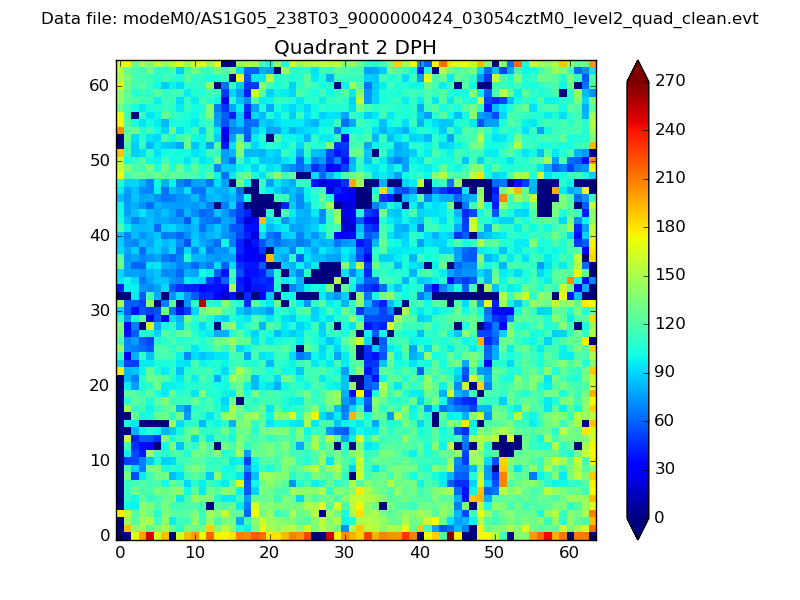 |
Quadrant C |
| Plot type | Count rate plots | Images |
|---|---|---|
| Comparison with Poisson distribution Blue bars denote a histogram of data divided into 1 sec bins. Red curve is a Poisson curve with rate = median count rate of data. |
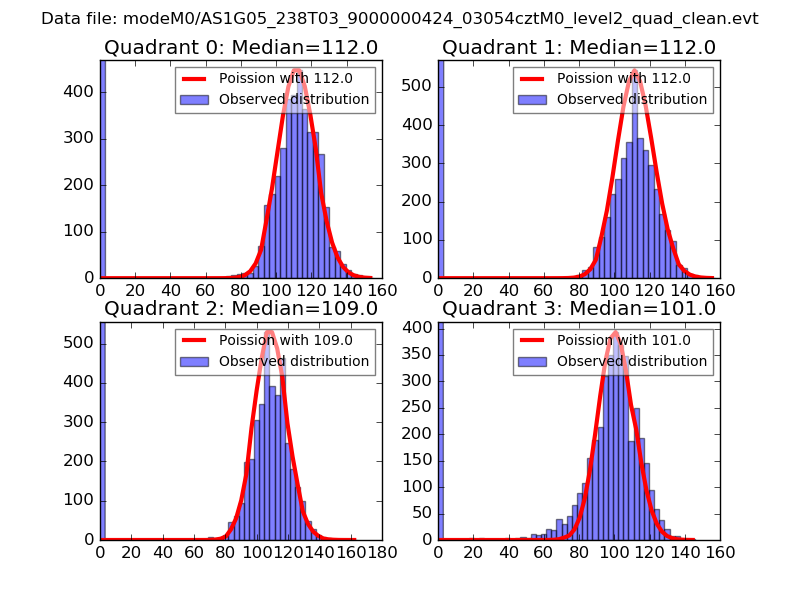 |
 |
| Quadrant-wise count rates Data is divided into 100 sec bins |
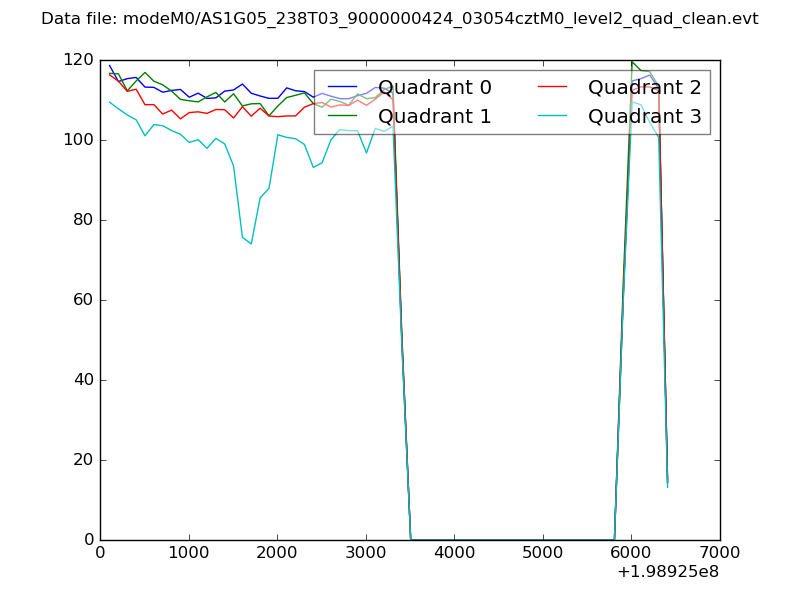 |
|
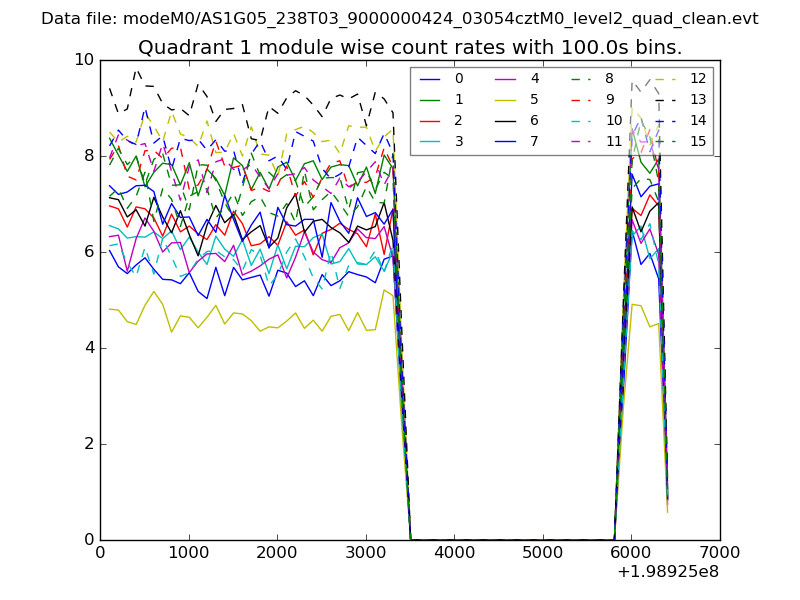
| Module-wise count rates for Quadrant A Data is divided into 100 sec bins |
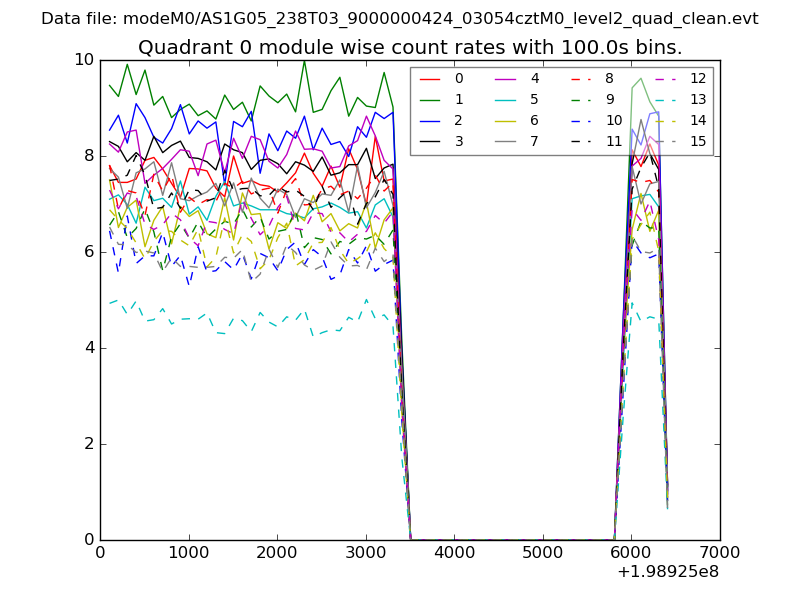 |
 |
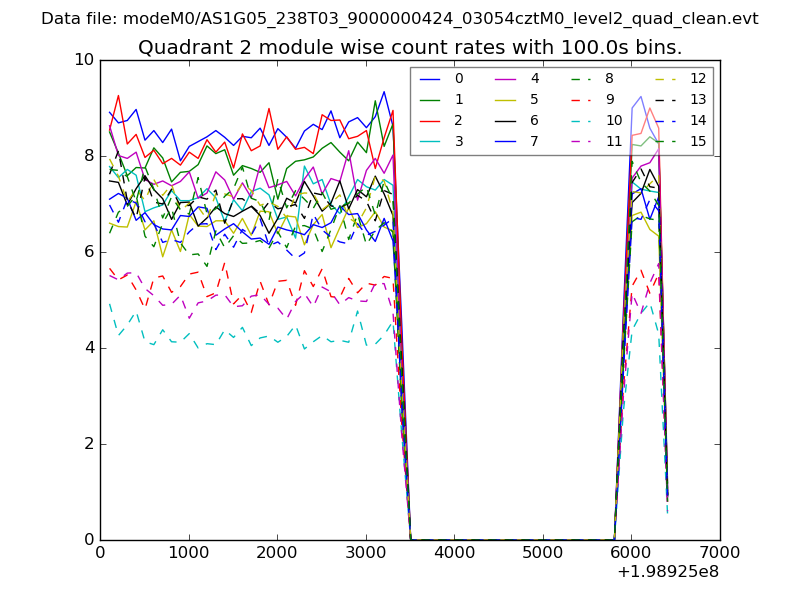
| Module-wise count rates for Quadrant B Data is divided into 100 sec bins |
 |
 |
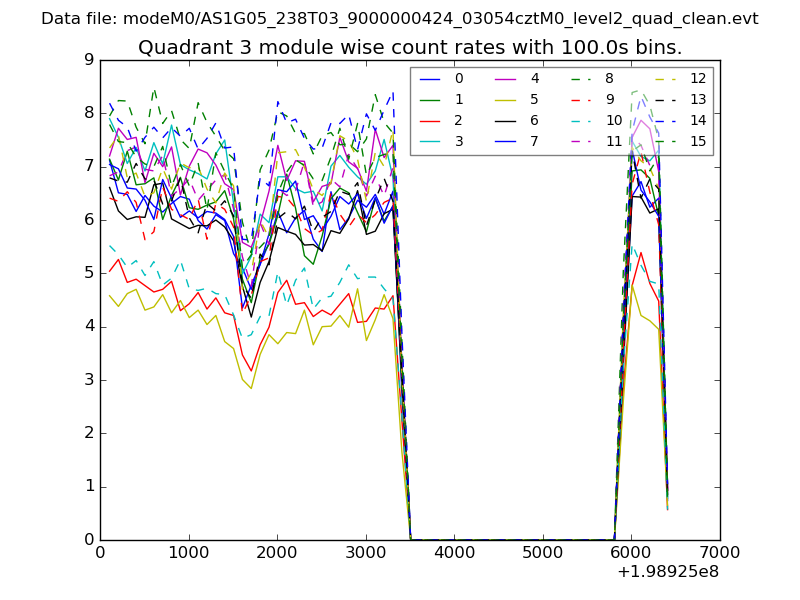
| Module-wise count rates for Quadrant C Data is divided into 100 sec bins |
 |
 |
| Module-wise count rates for Quadrant D Data is divided into 100 sec bins |
 |
 |
| Parameter | Plot |
|---|---|
| CZT HV Monitor | 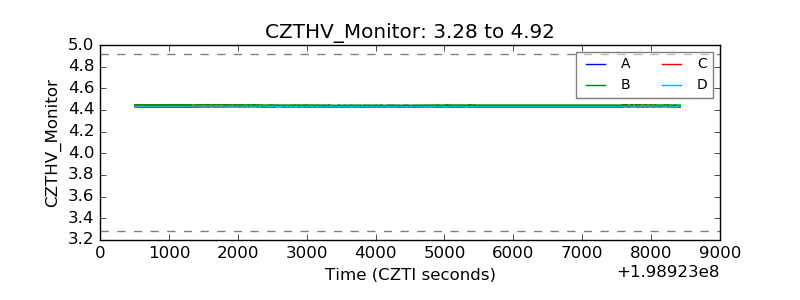 |
| D_VDD | 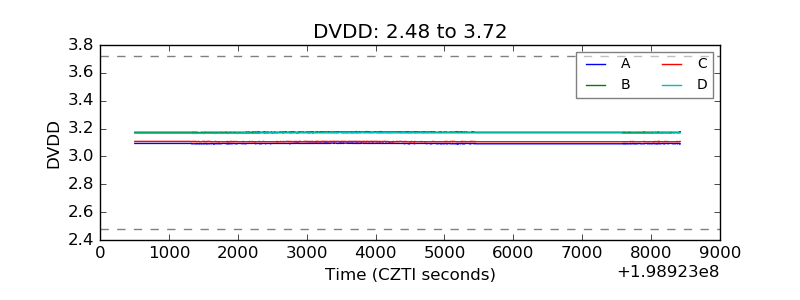 |
| Temperature 1 | 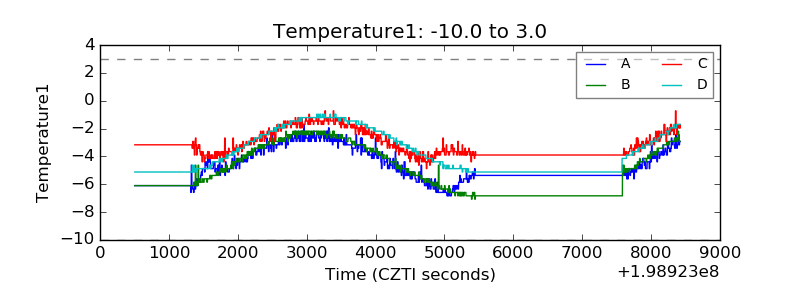 |
| Veto HV Monitor | 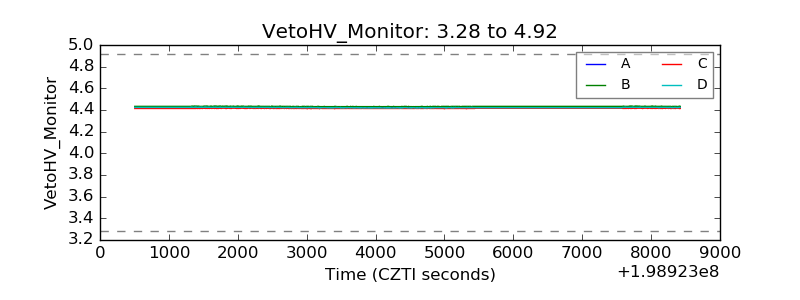 |
| Veto LLD | 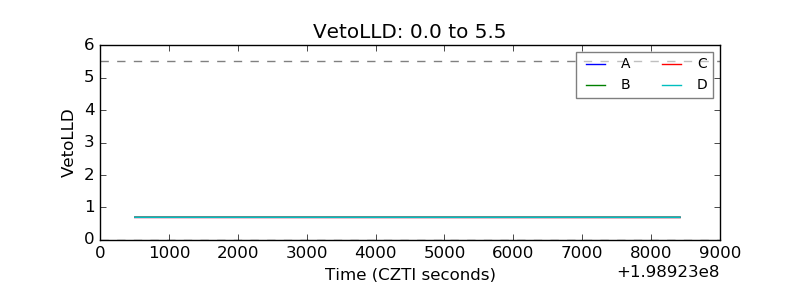 |
| Alpha Counter | 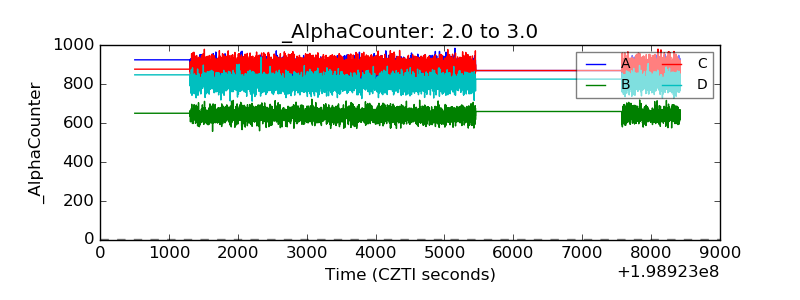 |
| _CPM_Rate | 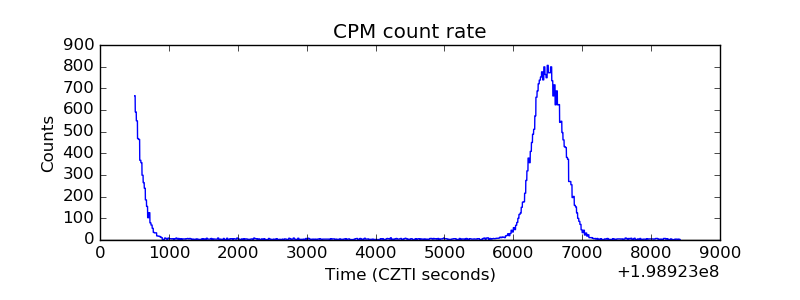 |
| CZT Counter | 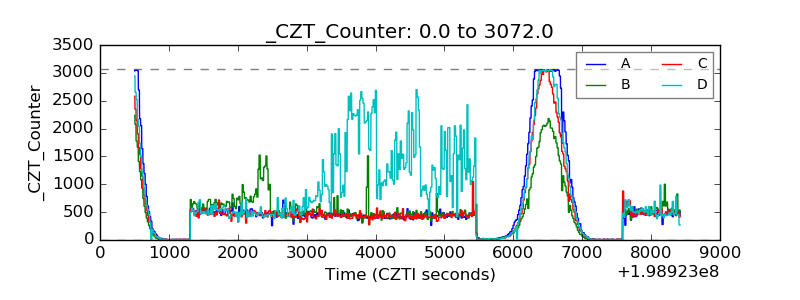 |
| +2.5 Volts monitor |  |
| +5 Volts monitor |  |
| _ROLL_ROT | 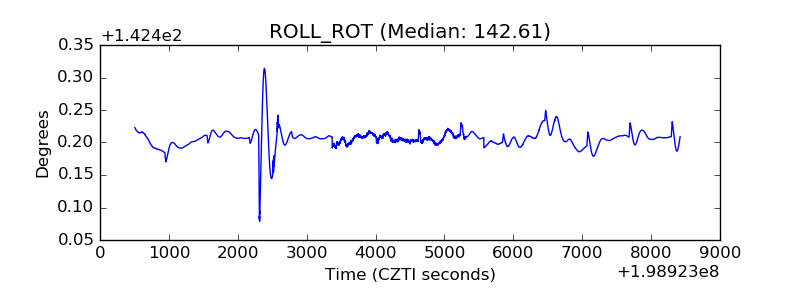 |
| _Roll_DEC | 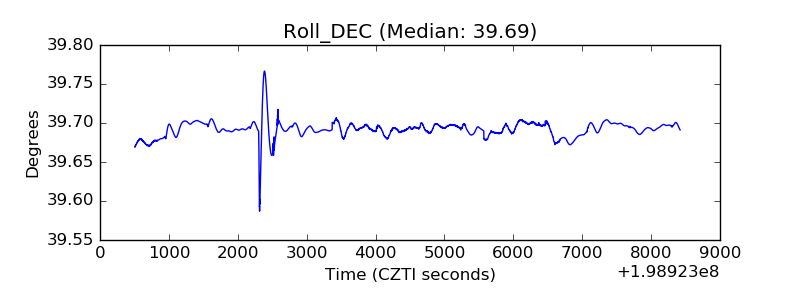 |
| _Roll_RA | 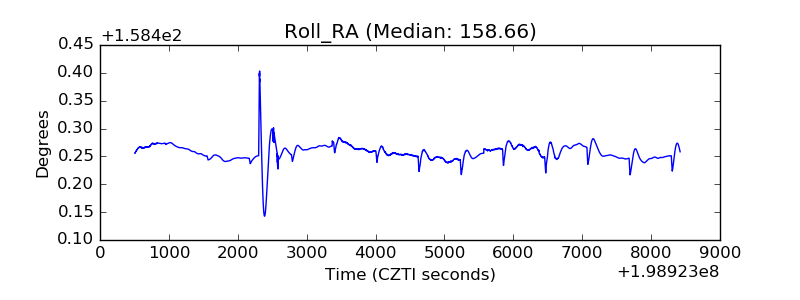 |
| Veto Counter | 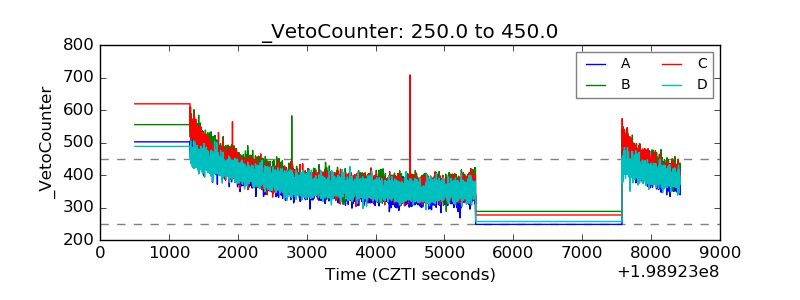 |