| Param | Original file | Final file |
|---|---|---|
| Filename | modeM0/AS1G05_238T03_9000000424_03055cztM0_level2.evt | modeM0/AS1G05_238T03_9000000424_03055cztM0_level2_quad_clean.evt |
| Size (bytes) | 354,291,840 | 80,340,480 |
| Size | 337.9 MB | 76.6 MB |
| Events in quadrant A | 2,405,944 | 529,063 |
| Events in quadrant B | 2,707,724 | 526,862 |
| Events in quadrant C | 2,434,068 | 512,597 |
| Events in quadrant D | 2,823,934 | 496,261 |
| Mode M0 | |||
|---|---|---|---|
| Quadrant | BADHDUFLAG | Total packets | Discarded packets |
| A | 0 | 10686 | 3 |
| B | 0 | 11362 | 2 |
| C | 0 | 10915 | 2 |
| D | 0 | 11913 | 2 |
| Mode M9 | |||
|---|---|---|---|
| Quadrant | BADHDUFLAG | Total packets | Discarded packets |
| A | 0 | 37 | 0 |
| B | 0 | 37 | 0 |
| C | 0 | 37 | 0 |
| D | 0 | 38 | 0 |
| Mode SS | |||
|---|---|---|---|
| Quadrant | BADHDUFLAG | Total packets | Discarded packets |
| A | 0 | 108 | 0 |
| B | 0 | 108 | 0 |
| C | 0 | 108 | 0 |
| D | 0 | 108 | 0 |
| Quadrant | Total seconds | Saturated seconds | Saturation percentage |
|---|---|---|---|
| A | 5253 | 12 | 0.228441% |
| B | 5253 | 30 | 0.571102% |
| C | 5253 | 23 | 0.437845% |
| D | 5253 | 21 | 0.399772% |
Noise dominated data is calculated using 1-second bins in cleaned event files. If a bin has >2000 counts, and if more than 50% of those come from <1% of pixels, then it is considered to be noise-dominated and hence unusable.
| Quadrant | # 1 sec bins | Bins with >0 counts | Bins with >2000 counts | High rate bins dominated by noise | Noise dominated (total time) | Noise dominated (detector-on time) | Marked lightcurve |
|---|---|---|---|---|---|---|---|
| A | 7408 | 5254 | 5 | 5 | 0.07% | 0.10% | 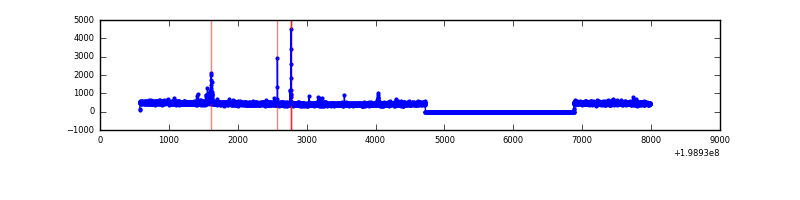 |
| B | 7408 | 5254 | 19 | 19 | 0.26% | 0.36% | 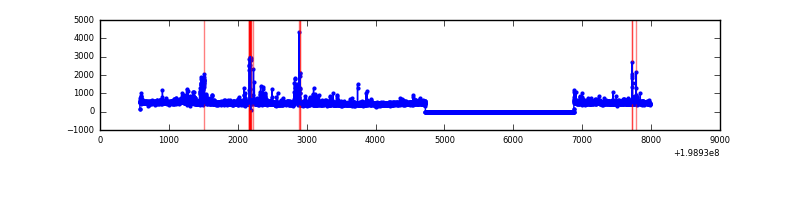 |
| C | 7408 | 5254 | 14 | 14 | 0.19% | 0.27% | 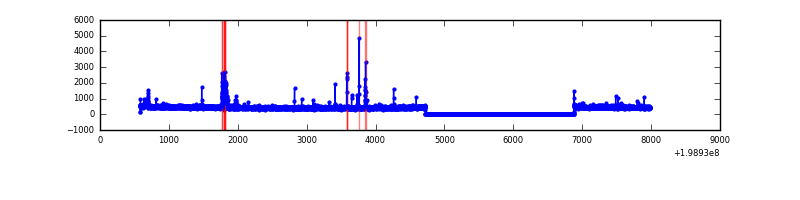 |
| D | 7408 | 5254 | 12 | 12 | 0.16% | 0.23% |  |
Top three noisy pixels from each quadrant. If the there are fewer than three noisy pixels in the level2.evt file, extra rows are filled as -1
| Pixel properties | Quadrant properties | ||||||
|---|---|---|---|---|---|---|---|
| Quadrant | DetID | PixID | Counts | Sigma | Mean | Median | Sigma |
| A | 0 | 50 | 32091 | 261.01 | 602 | 589 | 120.7 |
| A | 14 | 249 | 26817 | 217.31 | 602 | 589 | 120.7 |
| A | 13 | 251 | 11830 | 93.14 | 602 | 589 | 120.7 |
| B | 2 | 249 | 87914 | 762.0 | 605 | 593 | 114.6 |
| B | 0 | 230 | 77907 | 674.67 | 605 | 593 | 114.6 |
| B | 0 | 219 | 67827 | 586.71 | 605 | 593 | 114.6 |
| C | 12 | 206 | 64966 | 476.73 | 578 | 582 | 135.1 |
| C | 6 | 80 | 36423 | 265.38 | 578 | 582 | 135.1 |
| C | 1 | 16 | 14277 | 101.4 | 578 | 582 | 135.1 |
| D | 13 | 114 | 232176 | 1623.87 | 584 | 566 | 142.6 |
| D | 2 | 152 | 100773 | 702.57 | 584 | 566 | 142.6 |
| D | 2 | 232 | 93144 | 649.09 | 584 | 566 | 142.6 |
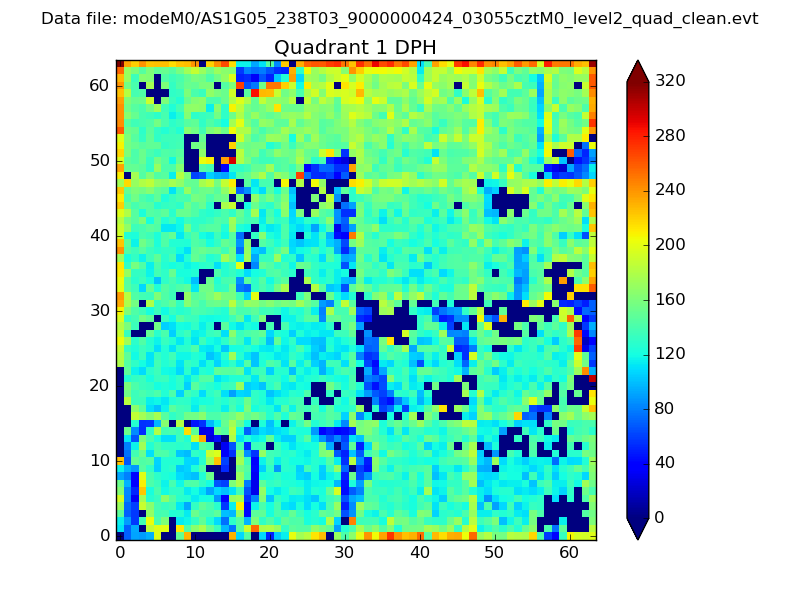
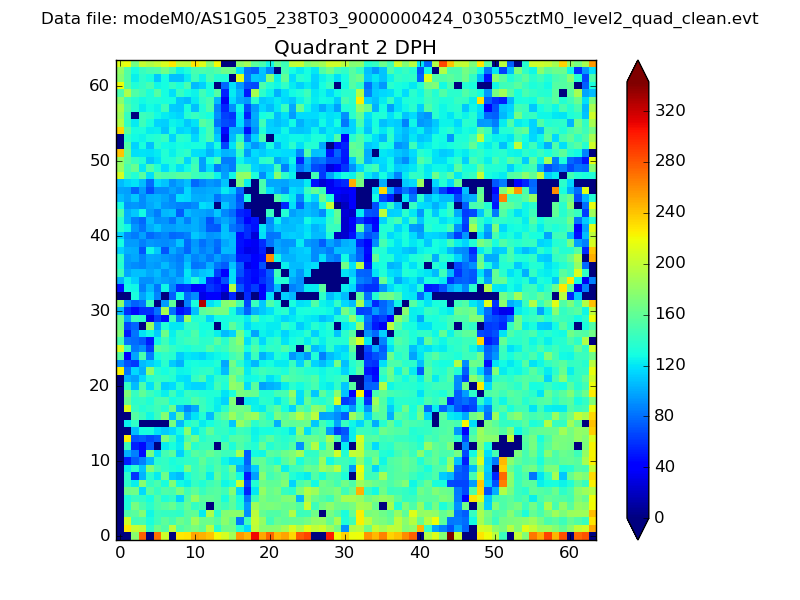
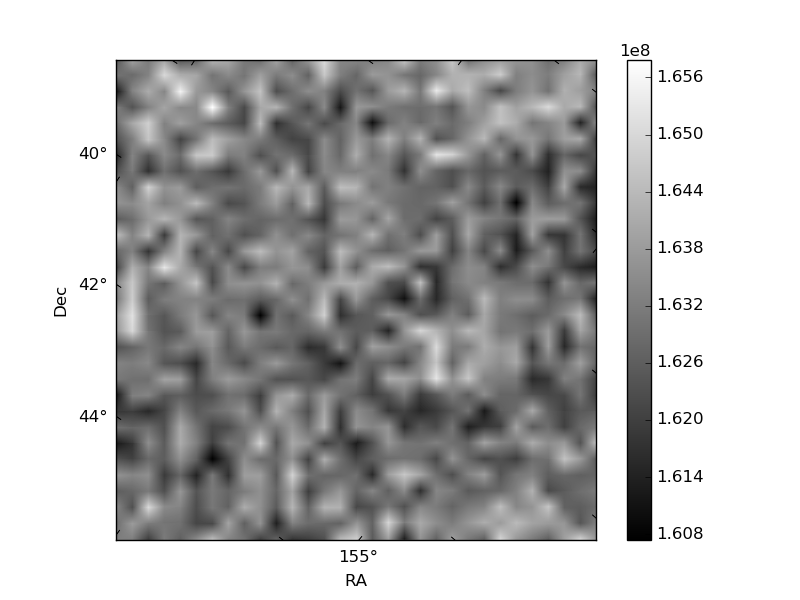
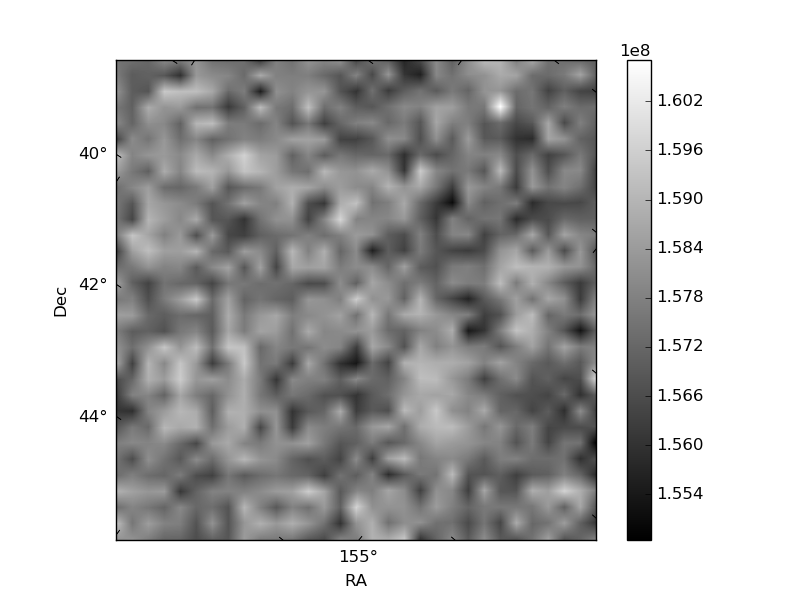
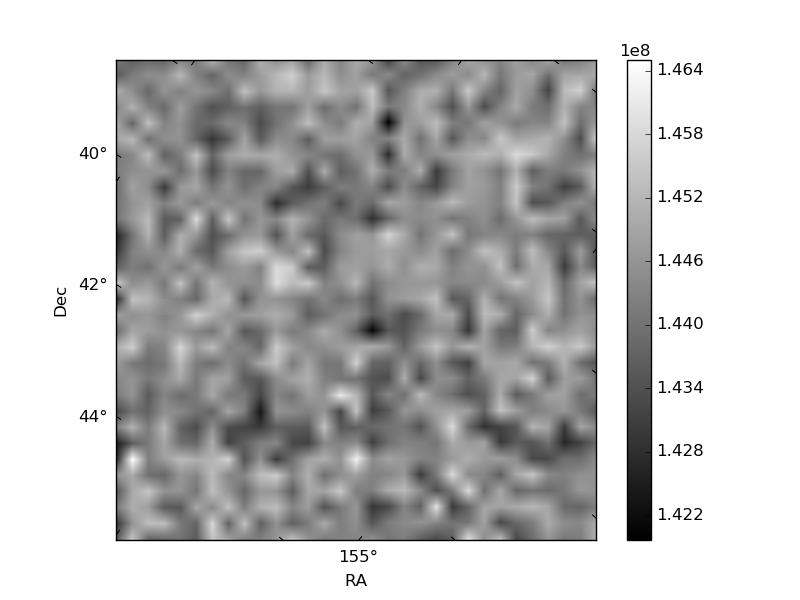
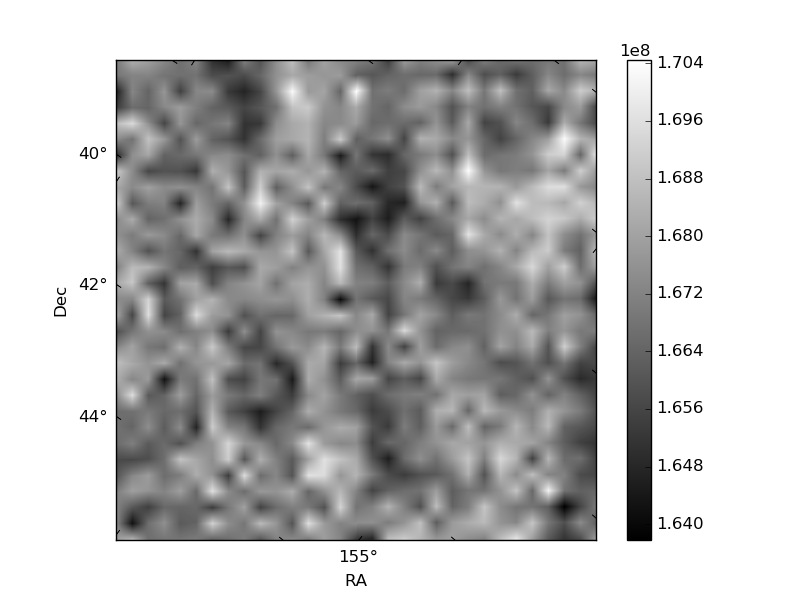
Histogram calculated using DETX and DETY for each event in the final _common_clean file
| Quadrant A | 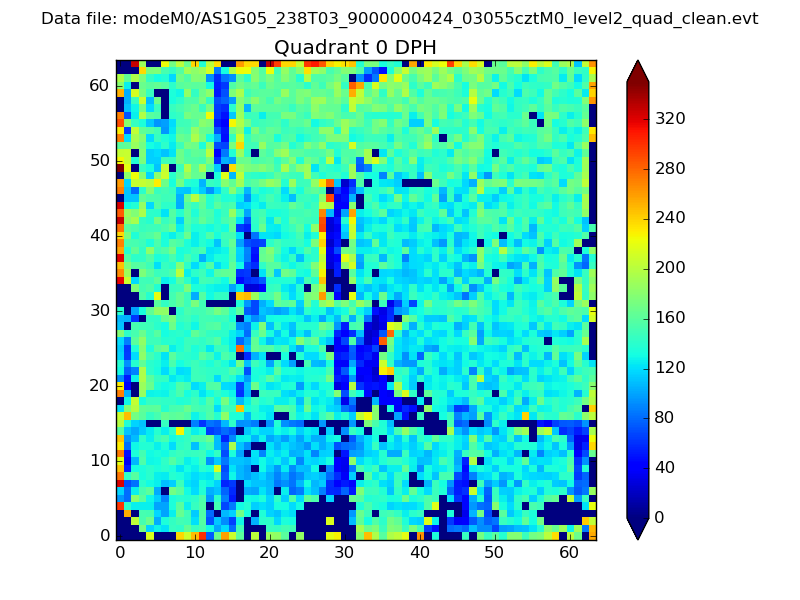 |
 |
Quadrant B |
|---|---|---|---|
| Quadrant D |  |
 |
Quadrant C |
| Plot type | Count rate plots | Images |
|---|---|---|
| Comparison with Poisson distribution Blue bars denote a histogram of data divided into 1 sec bins. Red curve is a Poisson curve with rate = median count rate of data. |
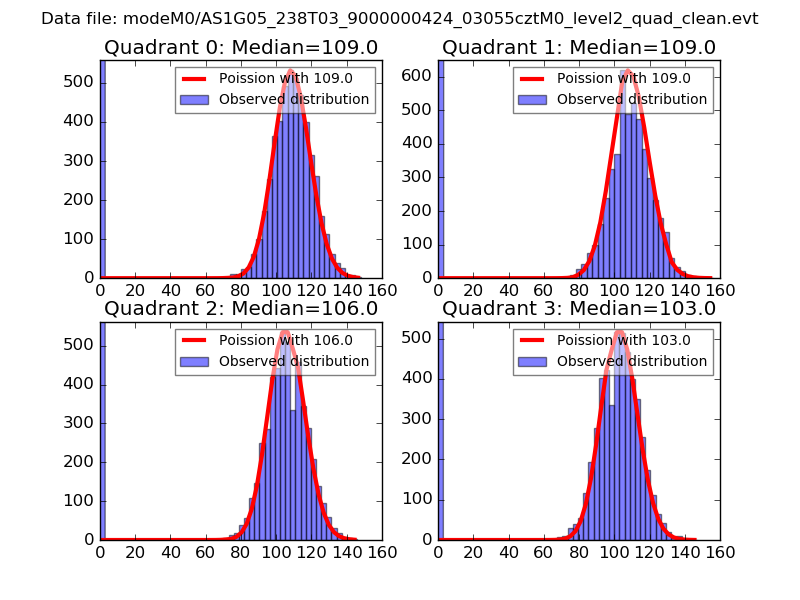 |
 |
| Quadrant-wise count rates Data is divided into 100 sec bins |
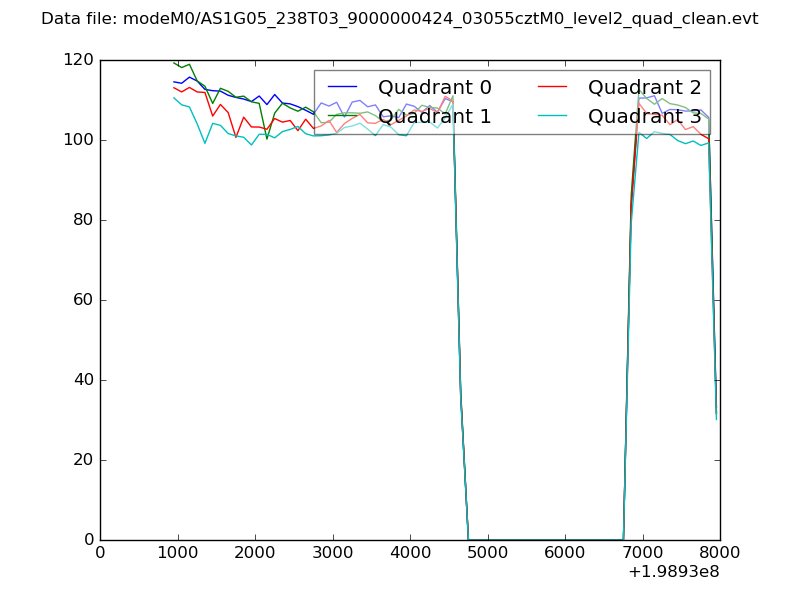 |
|
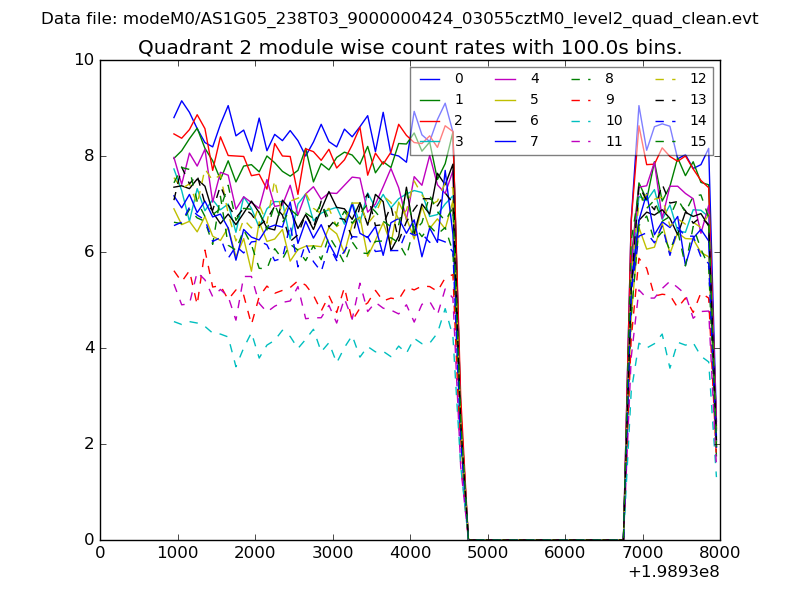
| Module-wise count rates for Quadrant A Data is divided into 100 sec bins |
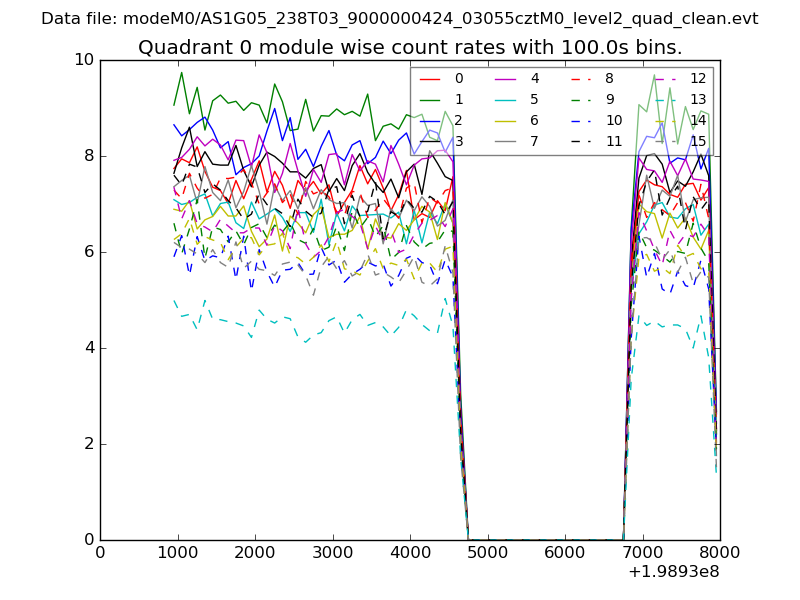 |
 |
| Module-wise count rates for Quadrant B Data is divided into 100 sec bins |
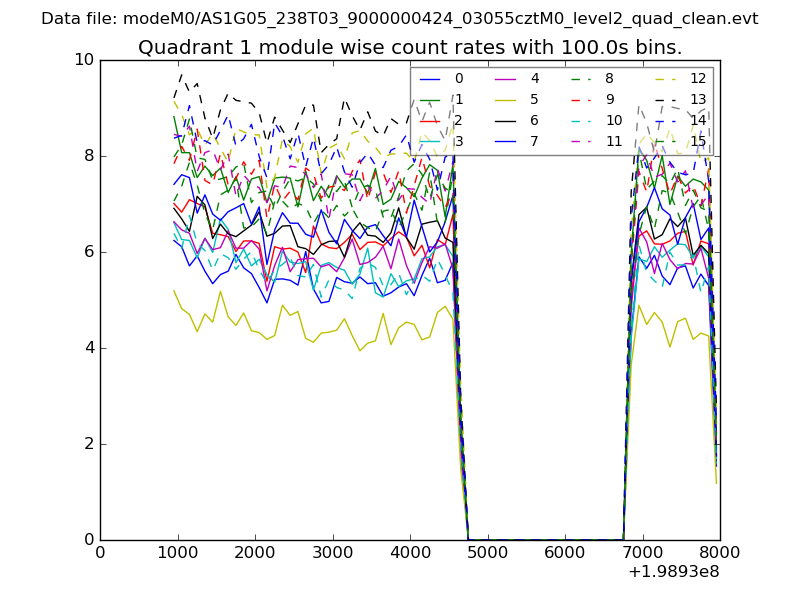 |
 |
| Module-wise count rates for Quadrant C Data is divided into 100 sec bins |
 |
 |
| Module-wise count rates for Quadrant D Data is divided into 100 sec bins |
 |
 |
| Parameter | Plot |
|---|---|
| CZT HV Monitor | 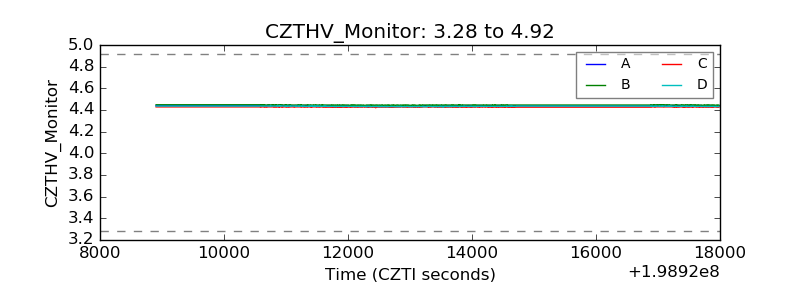 |
| D_VDD | 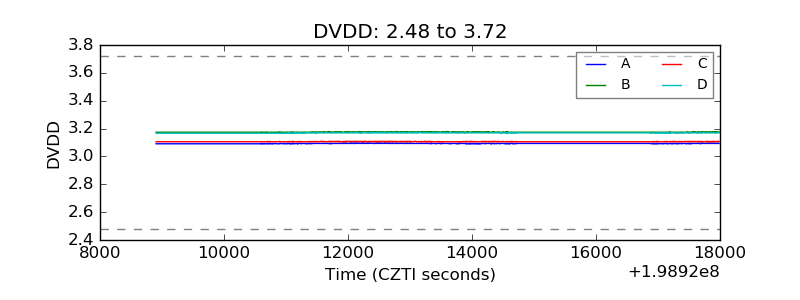 |
| Temperature 1 |  |
| Veto HV Monitor | 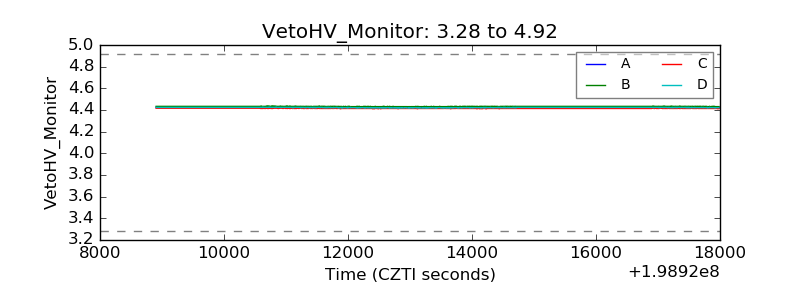 |
| Veto LLD |  |
| Alpha Counter | 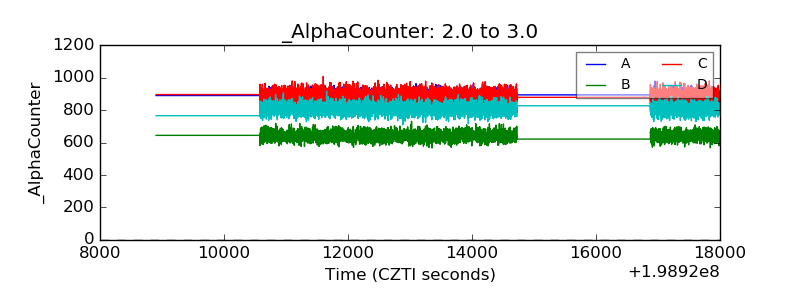 |
| _CPM_Rate | 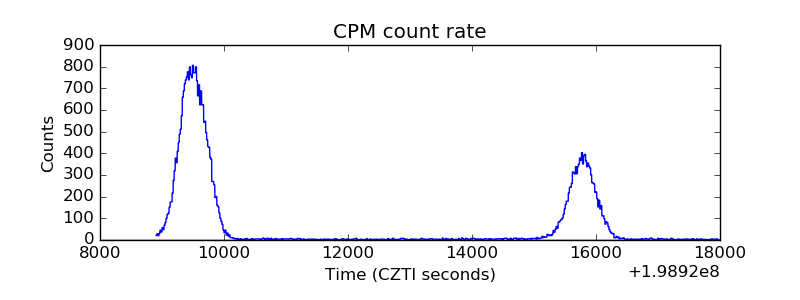 |
| CZT Counter | 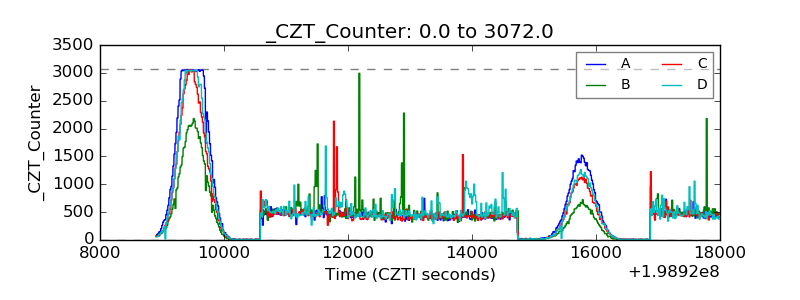 |
| +2.5 Volts monitor |  |
| +5 Volts monitor |  |
| _ROLL_ROT | 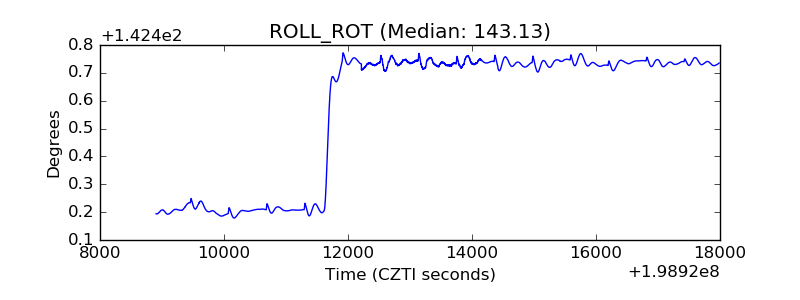 |
| _Roll_DEC | 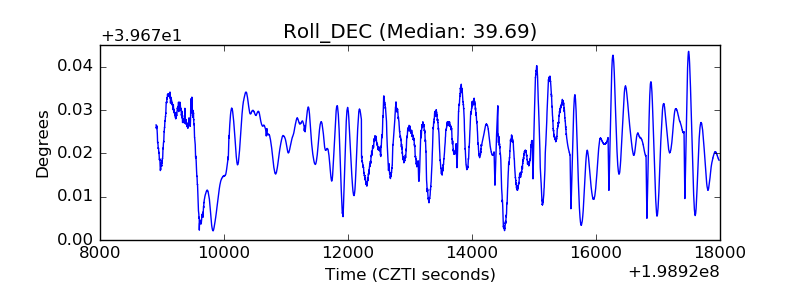 |
| _Roll_RA | 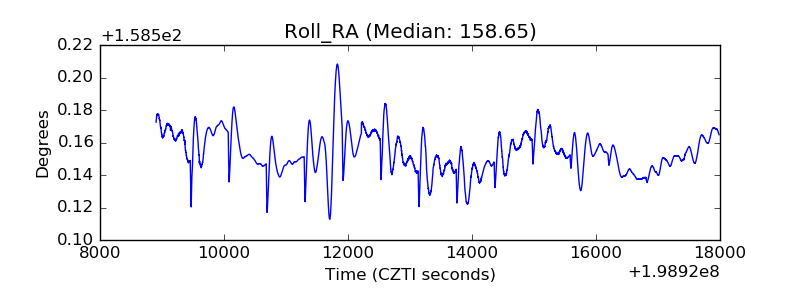 |
| Veto Counter | 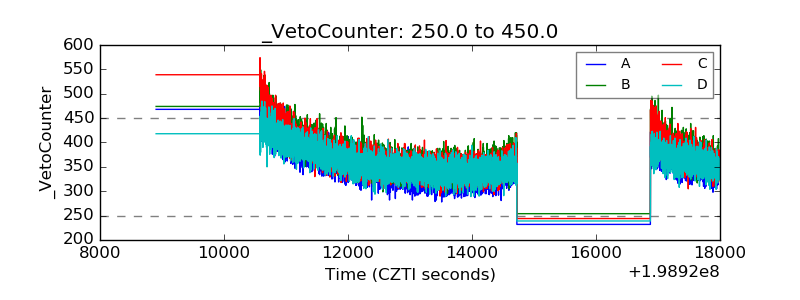 |