| Param | Original file | Final file |
|---|---|---|
| Filename | modeM0/AS1G05_238T03_9000000424_03058cztM0_level2.evt | modeM0/AS1G05_238T03_9000000424_03058cztM0_level2_quad_clean.evt |
| Size (bytes) | 324,777,600 | 60,445,440 |
| Size | 309.7 MB | 57.6 MB |
| Events in quadrant A | 2,255,633 | 374,037 |
| Events in quadrant B | 2,438,236 | 369,127 |
| Events in quadrant C | 2,139,258 | 367,497 |
| Events in quadrant D | 2,653,951 | 360,969 |
| Mode M0 | |||
|---|---|---|---|
| Quadrant | BADHDUFLAG | Total packets | Discarded packets |
| A | 0 | 10651 | 3 |
| B | 0 | 10851 | 2 |
| C | 0 | 10370 | 2 |
| D | 0 | 11713 | 2 |
| Mode M9 | |||
|---|---|---|---|
| Quadrant | BADHDUFLAG | Total packets | Discarded packets |
| A | 0 | 24 | 0 |
| B | 0 | 24 | 0 |
| C | 0 | 24 | 0 |
| D | 0 | 25 | 0 |
| Mode SS | |||
|---|---|---|---|
| Quadrant | BADHDUFLAG | Total packets | Discarded packets |
| A | 0 | 106 | 0 |
| B | 0 | 106 | 0 |
| C | 0 | 106 | 0 |
| D | 0 | 106 | 0 |
| Quadrant | Total seconds | Saturated seconds | Saturation percentage |
|---|---|---|---|
| A | 5109 | 33 | 0.645919% |
| B | 5109 | 18 | 0.352319% |
| C | 5109 | 9 | 0.176160% |
| D | 5109 | 48 | 0.939518% |
Noise dominated data is calculated using 1-second bins in cleaned event files. If a bin has >2000 counts, and if more than 50% of those come from <1% of pixels, then it is considered to be noise-dominated and hence unusable.
| Quadrant | # 1 sec bins | Bins with >0 counts | Bins with >2000 counts | High rate bins dominated by noise | Noise dominated (total time) | Noise dominated (detector-on time) | Marked lightcurve |
|---|---|---|---|---|---|---|---|
| A | 7235 | 5110 | 17 | 17 | 0.23% | 0.33% | 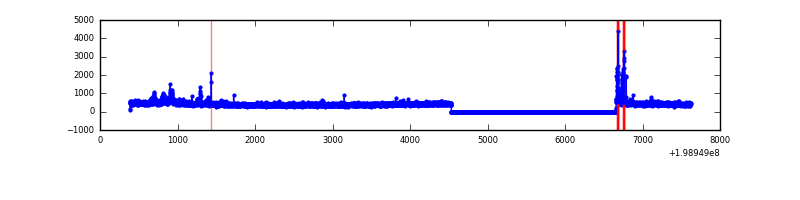 |
| B | 7235 | 5110 | 10 | 10 | 0.14% | 0.20% | 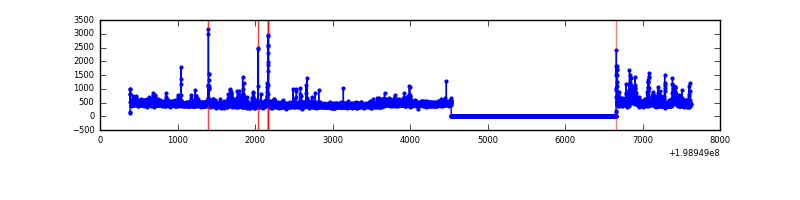 |
| C | 7235 | 5110 | 7 | 7 | 0.10% | 0.14% | 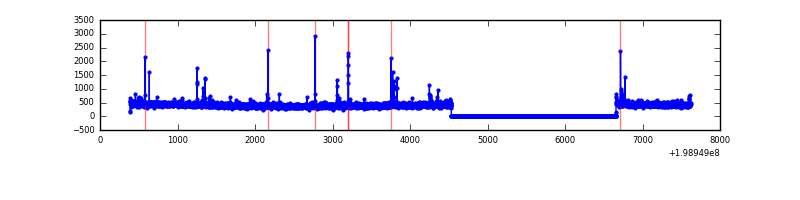 |
| D | 7235 | 5110 | 53 | 53 | 0.73% | 1.04% | 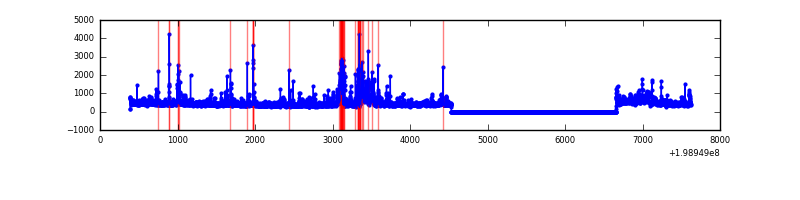 |
Top three noisy pixels from each quadrant. If the there are fewer than three noisy pixels in the level2.evt file, extra rows are filled as -1
| Pixel properties | Quadrant properties | ||||||
|---|---|---|---|---|---|---|---|
| Quadrant | DetID | PixID | Counts | Sigma | Mean | Median | Sigma |
| A | 14 | 238 | 157493 | 1450.27 | 532 | 519 | 108.2 |
| A | 0 | 50 | 13870 | 123.35 | 532 | 519 | 108.2 |
| A | 3 | 1 | 8442 | 73.2 | 532 | 519 | 108.2 |
| B | 15 | 204 | 156593 | 1501.76 | 541 | 529 | 103.9 |
| B | 0 | 219 | 55574 | 529.68 | 541 | 529 | 103.9 |
| B | 0 | 230 | 41704 | 396.22 | 541 | 529 | 103.9 |
| C | 1 | 16 | 51628 | 411.96 | 523 | 524 | 124.1 |
| C | 6 | 80 | 27412 | 216.75 | 523 | 524 | 124.1 |
| C | 4 | 207 | 6115 | 45.07 | 523 | 524 | 124.1 |
| D | 2 | 152 | 369117 | 2843.13 | 522 | 505 | 129.6 |
| D | 13 | 114 | 84763 | 649.89 | 522 | 505 | 129.6 |
| D | 10 | 213 | 55800 | 426.49 | 522 | 505 | 129.6 |
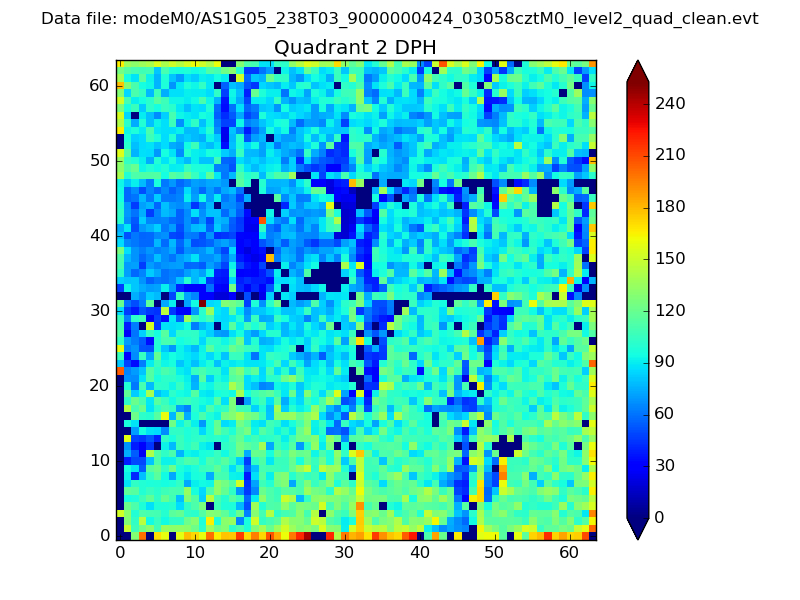
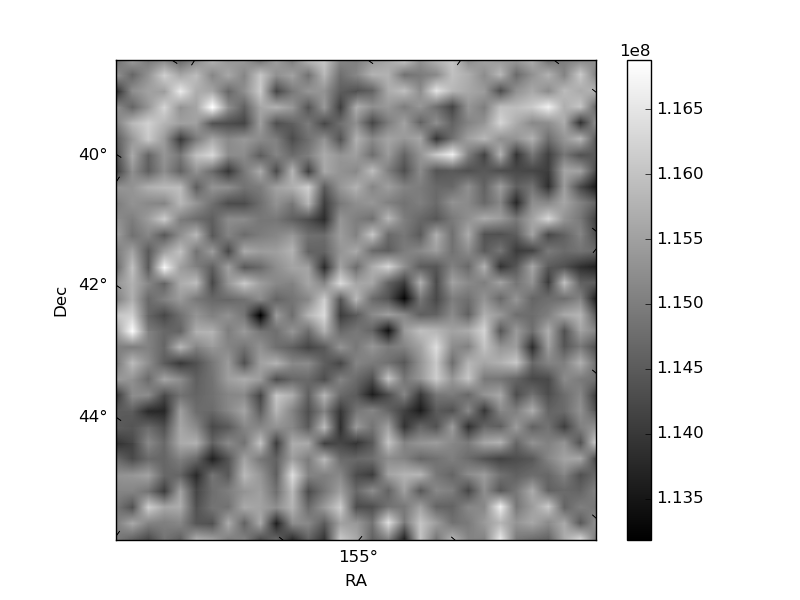
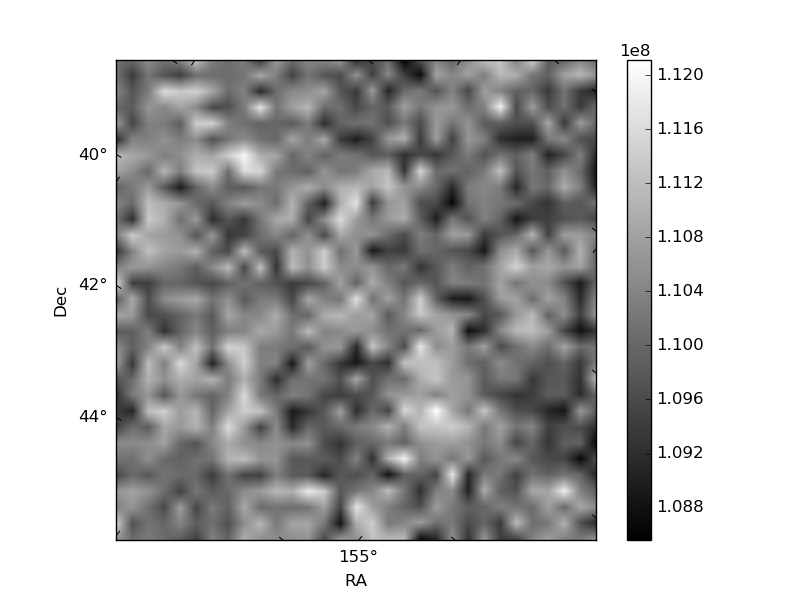
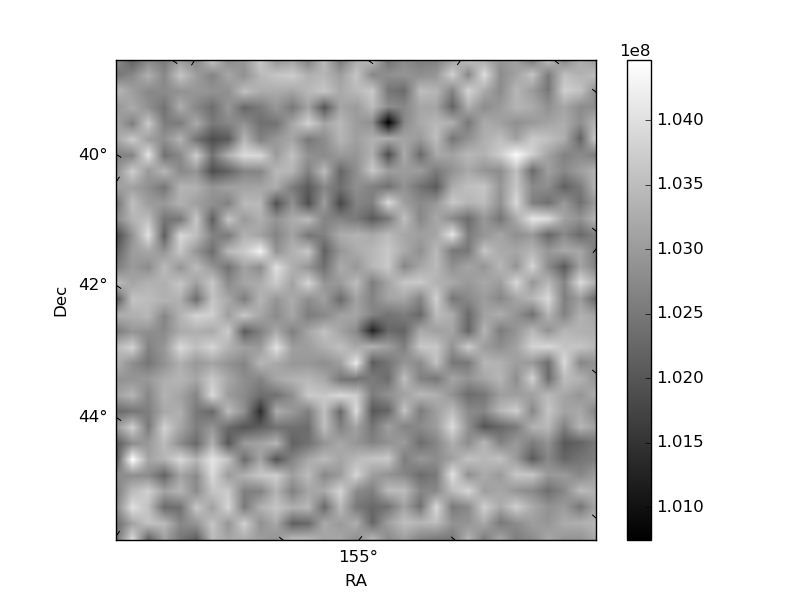
Histogram calculated using DETX and DETY for each event in the final _common_clean file
| Quadrant A | 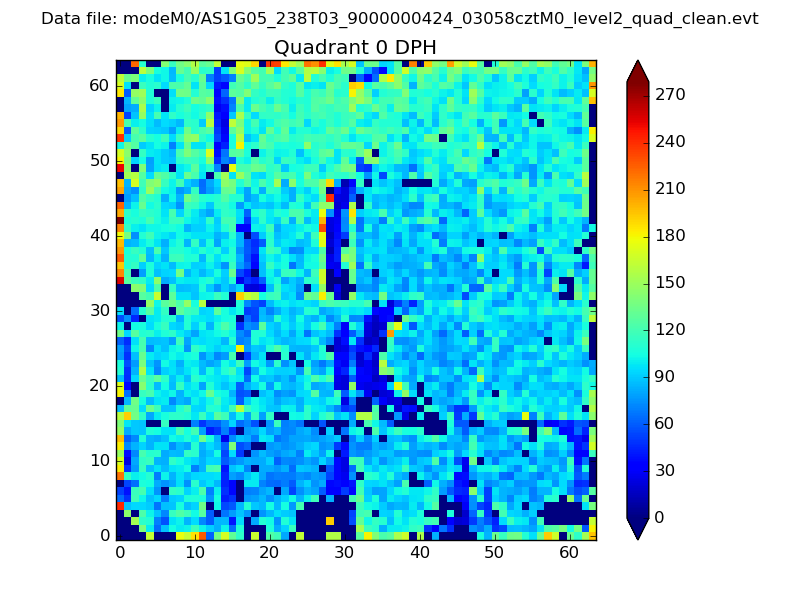 |
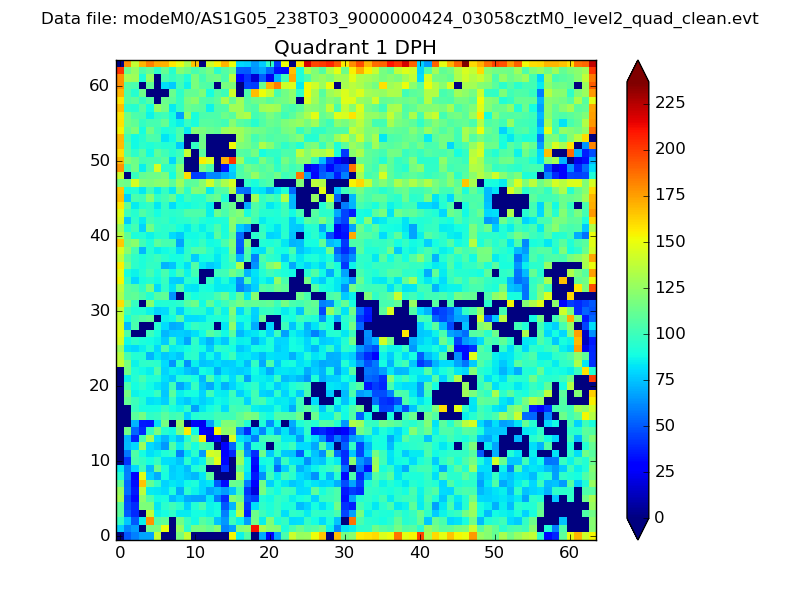 |
Quadrant B |
|---|---|---|---|
| Quadrant D | 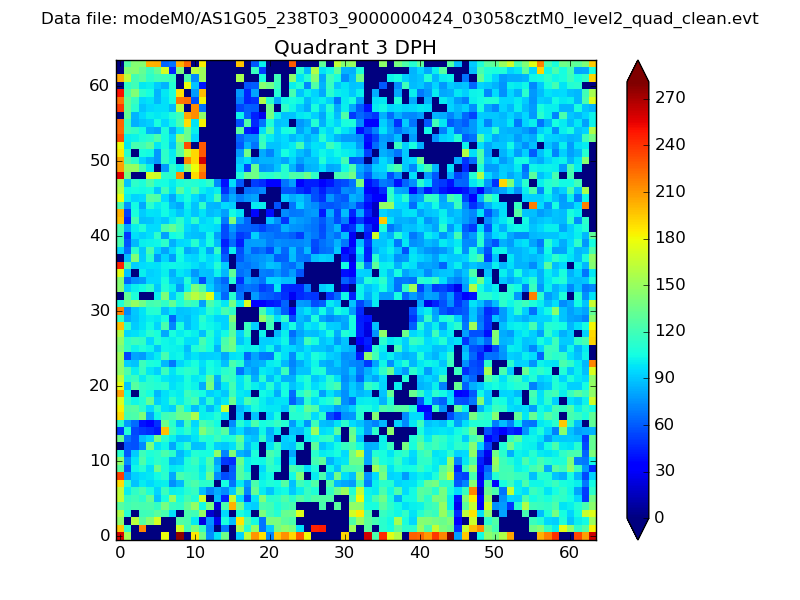 |
 |
Quadrant C |
| Plot type | Count rate plots | Images |
|---|---|---|
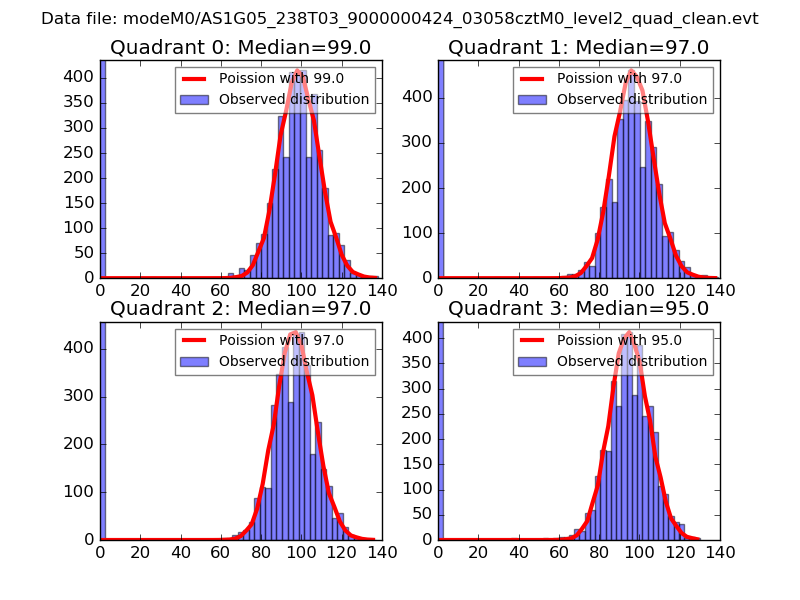
| Comparison with Poisson distribution Blue bars denote a histogram of data divided into 1 sec bins. Red curve is a Poisson curve with rate = median count rate of data. |
 |
 |
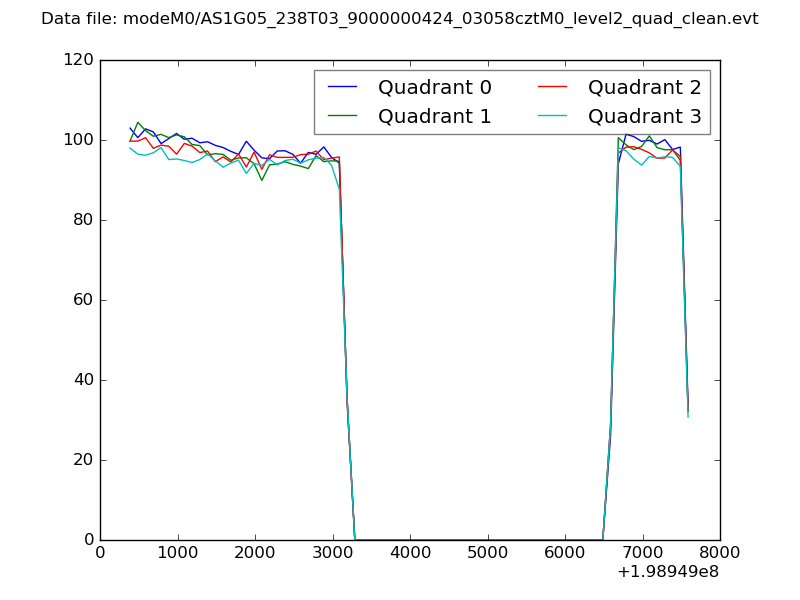
| Quadrant-wise count rates Data is divided into 100 sec bins |
 |
|
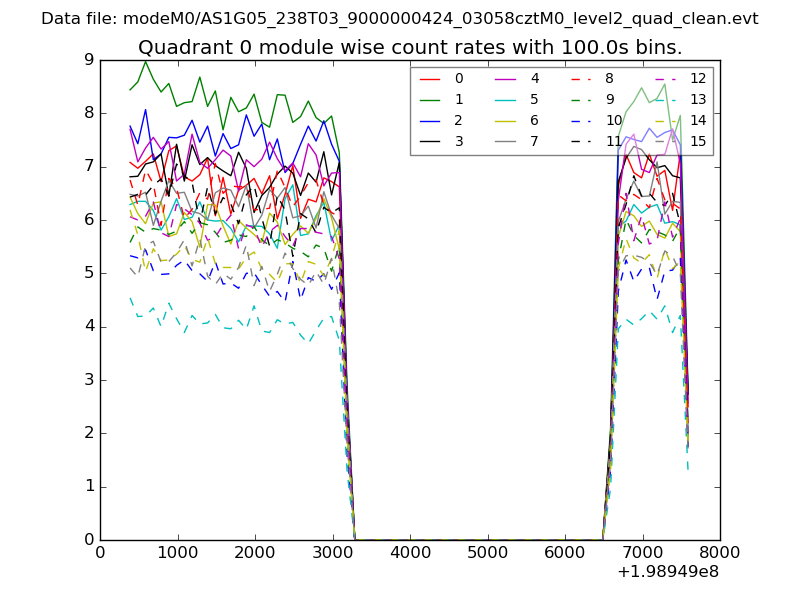
| Module-wise count rates for Quadrant A Data is divided into 100 sec bins |
 |
 |
| Module-wise count rates for Quadrant B Data is divided into 100 sec bins |
 |
 |
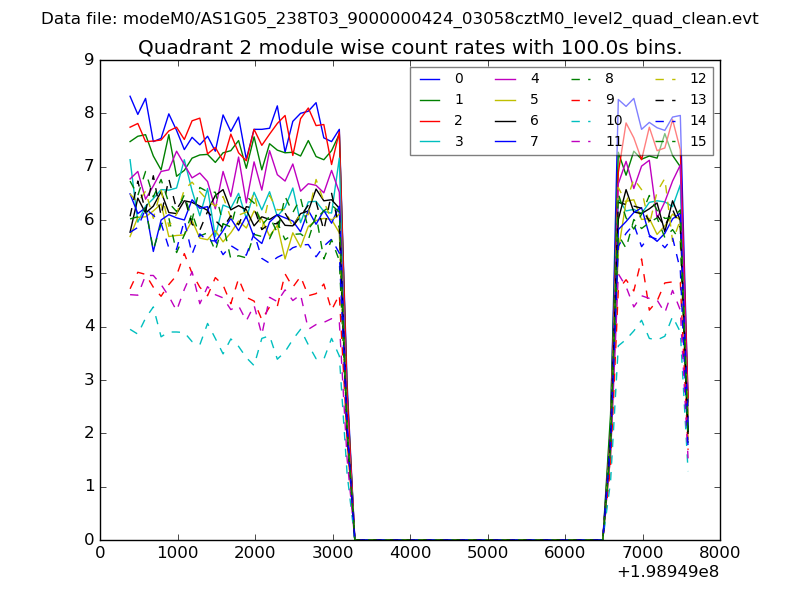
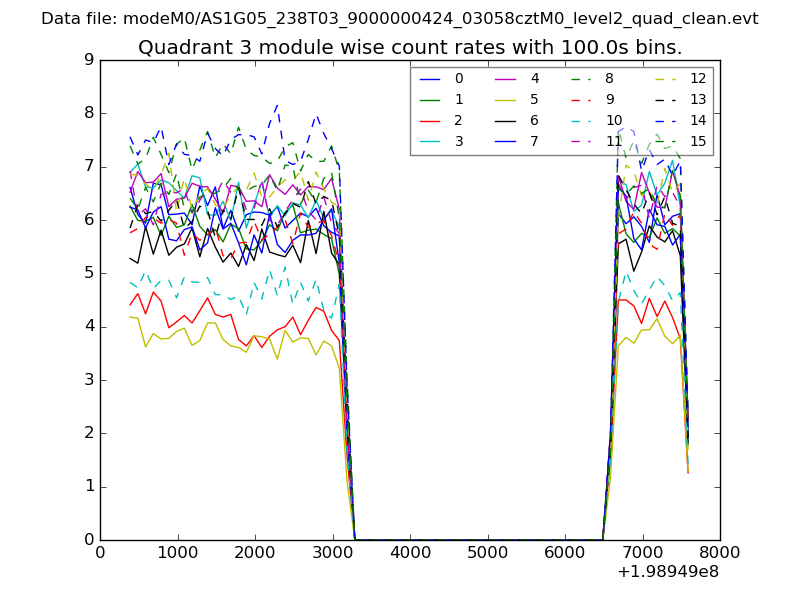
| Module-wise count rates for Quadrant C Data is divided into 100 sec bins |
 |
 |
| Module-wise count rates for Quadrant D Data is divided into 100 sec bins |
 |
 |
| Parameter | Plot |
|---|---|
| CZT HV Monitor | 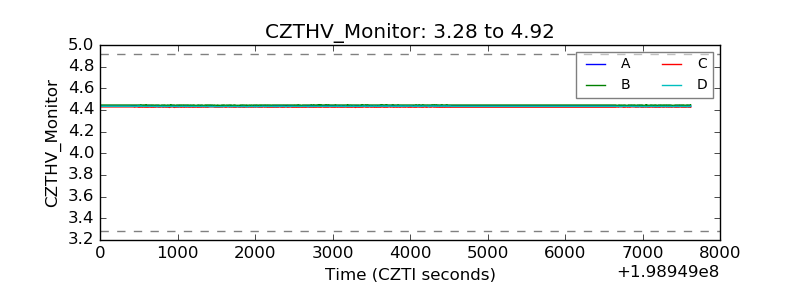 |
| D_VDD | 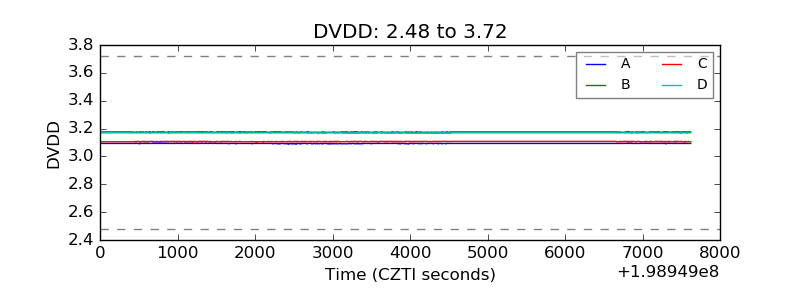 |
| Temperature 1 | 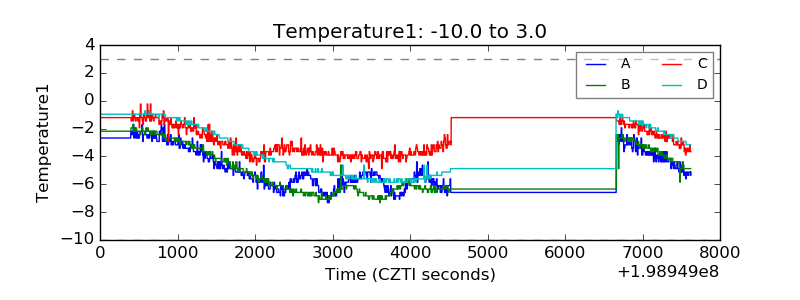 |
| Veto HV Monitor | 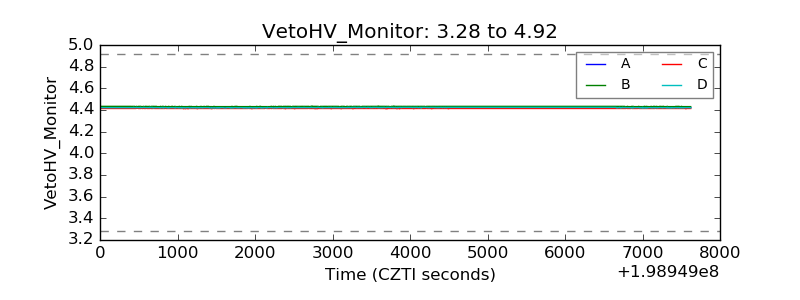 |
| Veto LLD |  |
| Alpha Counter | 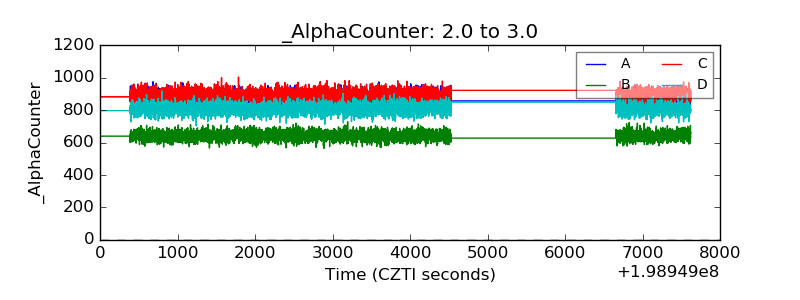 |
| _CPM_Rate | 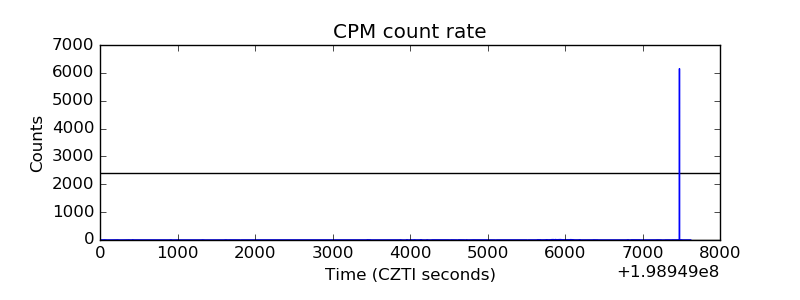 |
| CZT Counter | 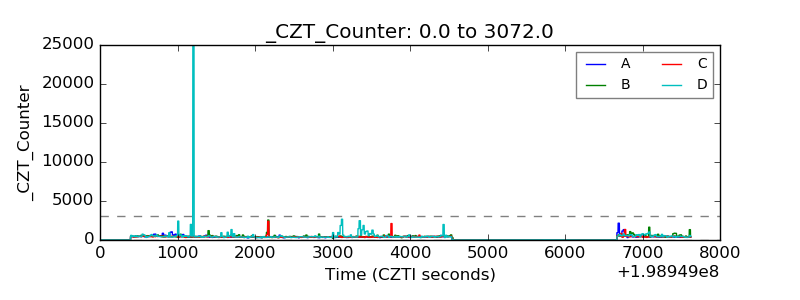 |
| +2.5 Volts monitor |  |
| +5 Volts monitor | 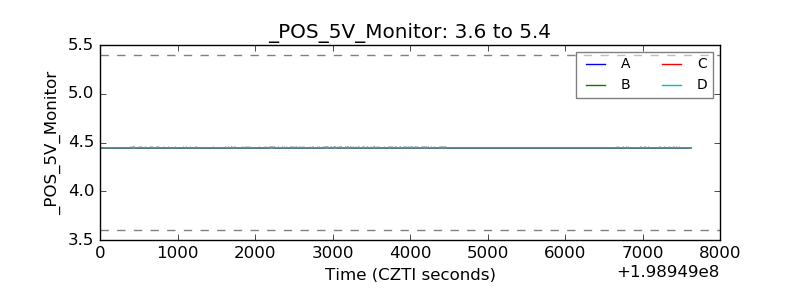 |
| _ROLL_ROT | 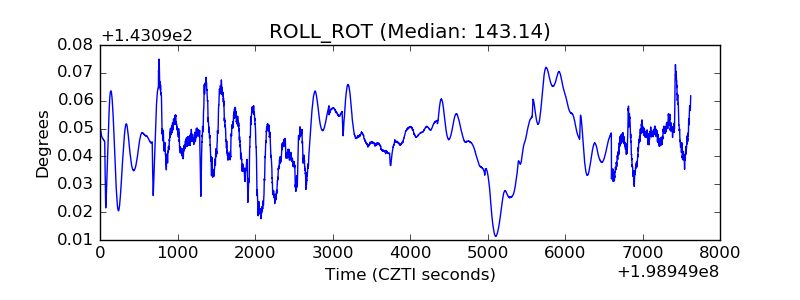 |
| _Roll_DEC | 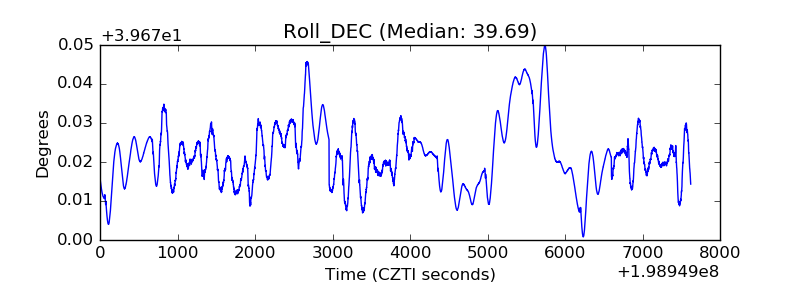 |
| _Roll_RA | 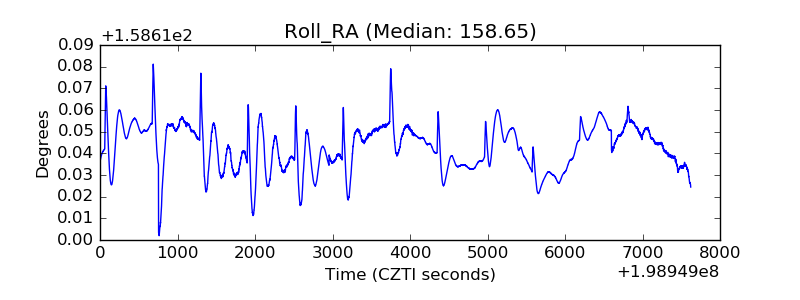 |
| Veto Counter | 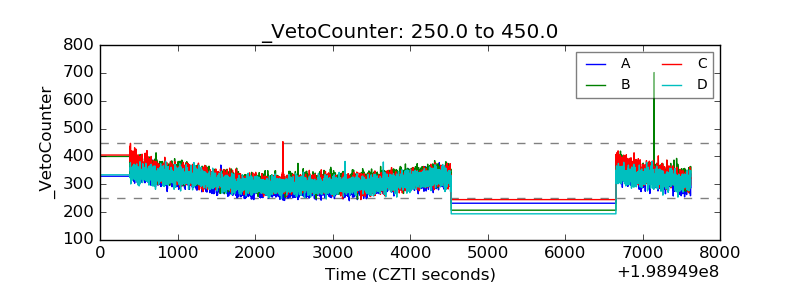 |