| Param | Original file | Final file |
|---|---|---|
| Filename | modeM0/AS1G05_238T03_9000000424_03060cztM0_level2.evt | modeM0/AS1G05_238T03_9000000424_03060cztM0_level2_quad_clean.evt |
| Size (bytes) | 386,412,480 | 51,707,520 |
| Size | 368.5 MB | 49.3 MB |
| Events in quadrant A | 2,180,815 | 304,673 |
| Events in quadrant B | 3,647,225 | 296,464 |
| Events in quadrant C | 2,255,194 | 302,397 |
| Events in quadrant D | 3,262,269 | 294,186 |
| Mode M0 | |||
|---|---|---|---|
| Quadrant | BADHDUFLAG | Total packets | Discarded packets |
| A | 0 | 10673 | 3 |
| B | 0 | 14562 | 2 |
| C | 0 | 10841 | 2 |
| D | 0 | 13559 | 2 |
| Mode M9 | |||
|---|---|---|---|
| Quadrant | BADHDUFLAG | Total packets | Discarded packets |
| A | 0 | 28 | 0 |
| B | 0 | 28 | 0 |
| C | 0 | 28 | 0 |
| D | 0 | 29 | 0 |
| Mode SS | |||
|---|---|---|---|
| Quadrant | BADHDUFLAG | Total packets | Discarded packets |
| A | 0 | 106 | 0 |
| B | 0 | 106 | 0 |
| C | 0 | 106 | 0 |
| D | 0 | 106 | 0 |
| Quadrant | Total seconds | Saturated seconds | Saturation percentage |
|---|---|---|---|
| A | 5252 | 5 | 0.095202% |
| B | 5252 | 42 | 0.799695% |
| C | 5252 | 30 | 0.571211% |
| D | 5252 | 124 | 2.361005% |
Noise dominated data is calculated using 1-second bins in cleaned event files. If a bin has >2000 counts, and if more than 50% of those come from <1% of pixels, then it is considered to be noise-dominated and hence unusable.
| Quadrant | # 1 sec bins | Bins with >0 counts | Bins with >2000 counts | High rate bins dominated by noise | Noise dominated (total time) | Noise dominated (detector-on time) | Marked lightcurve |
|---|---|---|---|---|---|---|---|
| A | 7409 | 5253 | 2 | 2 | 0.03% | 0.04% | 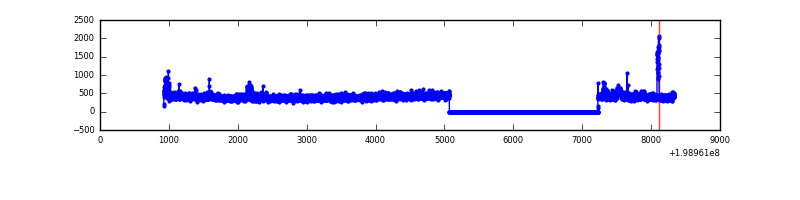 |
| B | 7409 | 5253 | 16 | 16 | 0.22% | 0.30% | 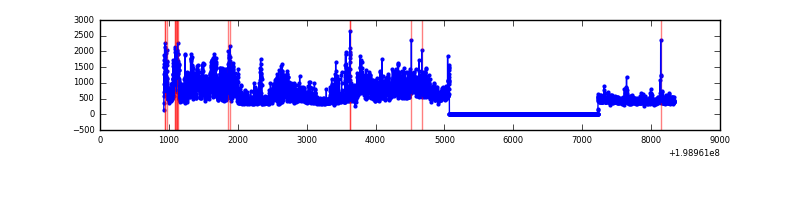 |
| C | 7409 | 5253 | 20 | 20 | 0.27% | 0.38% | 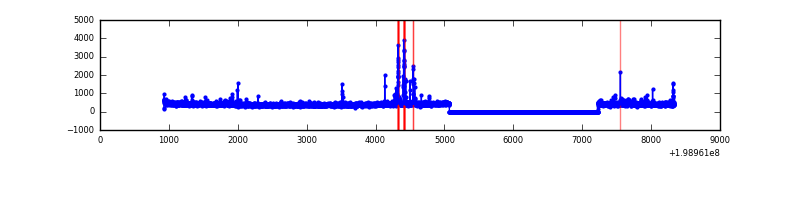 |
| D | 7409 | 5253 | 103 | 103 | 1.39% | 1.96% | 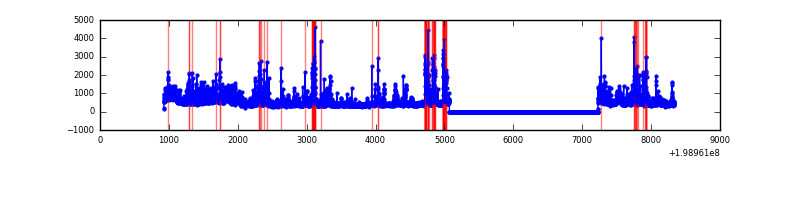 |
Top three noisy pixels from each quadrant. If the there are fewer than three noisy pixels in the level2.evt file, extra rows are filled as -1
| Pixel properties | Quadrant properties | ||||||
|---|---|---|---|---|---|---|---|
| Quadrant | DetID | PixID | Counts | Sigma | Mean | Median | Sigma |
| A | 12 | 247 | 44014 | 393.27 | 536 | 525 | 110.6 |
| A | 0 | 118 | 28653 | 254.36 | 536 | 525 | 110.6 |
| A | 0 | 50 | 20448 | 180.16 | 536 | 525 | 110.6 |
| B | 15 | 204 | 1380825 | 13076.73 | 547 | 535 | 105.6 |
| B | 15 | 255 | 35940 | 335.42 | 547 | 535 | 105.6 |
| B | 0 | 219 | 29406 | 273.52 | 547 | 535 | 105.6 |
| C | 5 | 250 | 78482 | 626.17 | 528 | 531 | 124.5 |
| C | 6 | 80 | 52671 | 418.84 | 528 | 531 | 124.5 |
| C | 1 | 16 | 10994 | 84.05 | 528 | 531 | 124.5 |
| D | 7 | 80 | 778962 | 5514.24 | 514 | 502 | 141.2 |
| D | 2 | 152 | 226494 | 1600.82 | 514 | 502 | 141.2 |
| D | 13 | 114 | 173232 | 1223.54 | 514 | 502 | 141.2 |
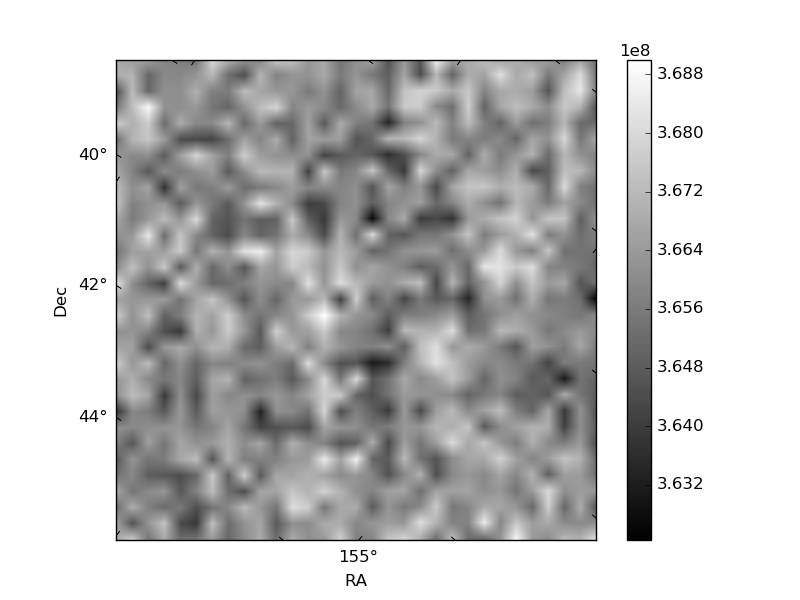
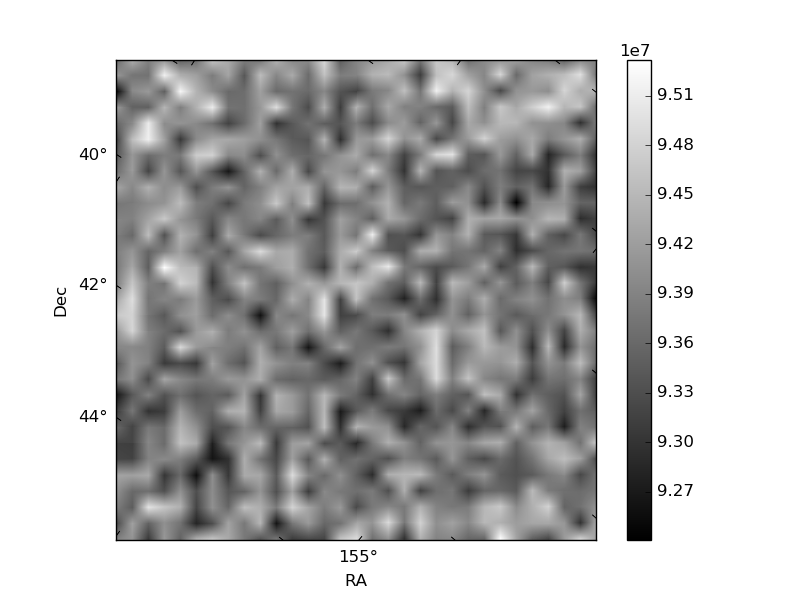
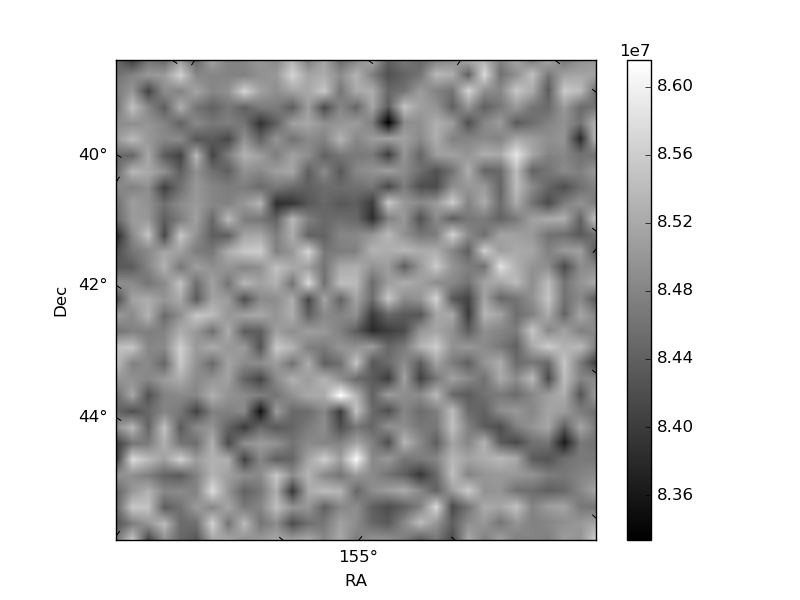
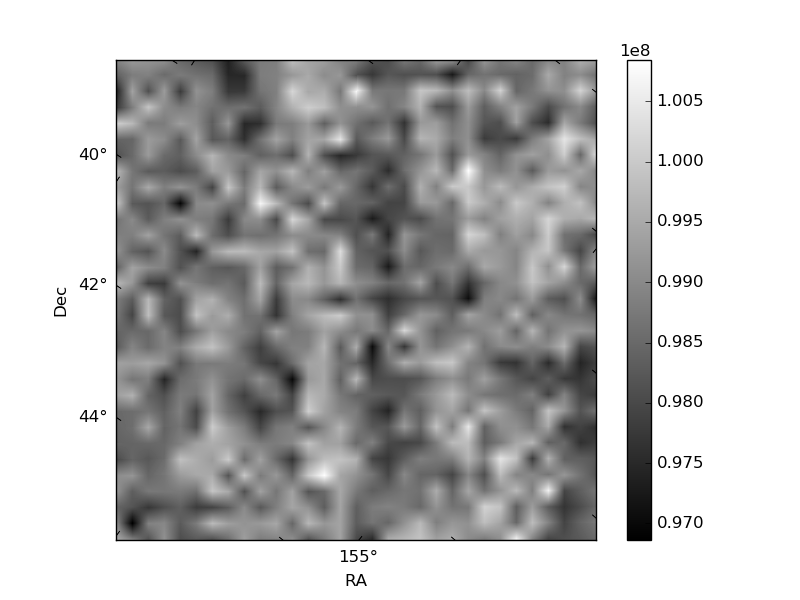
Histogram calculated using DETX and DETY for each event in the final _common_clean file
| Quadrant A | 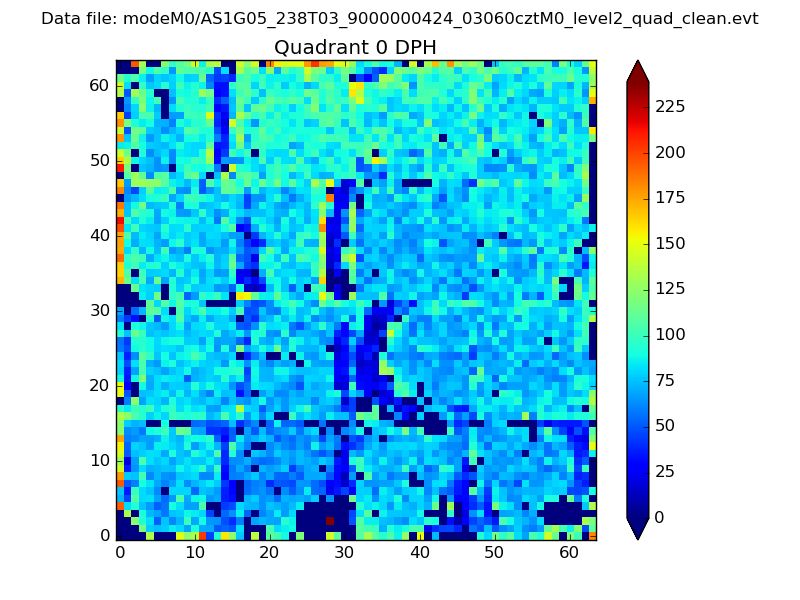 |
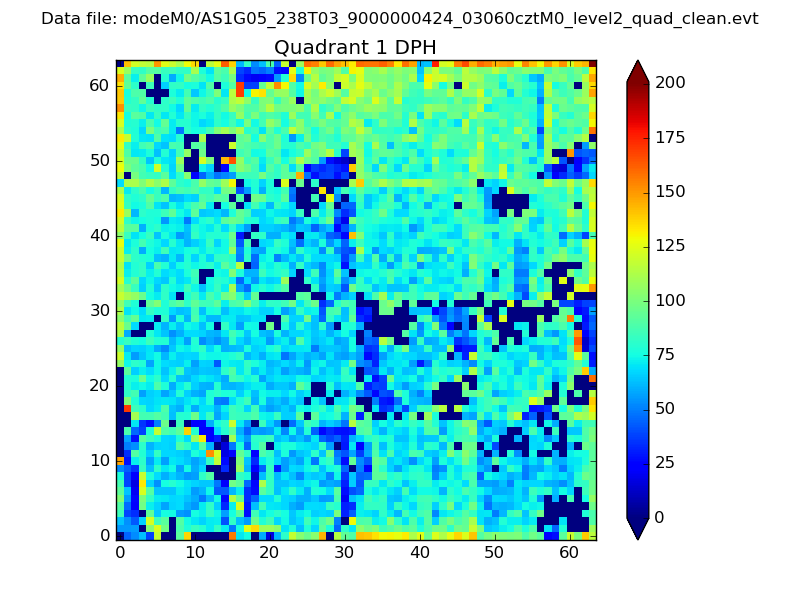 |
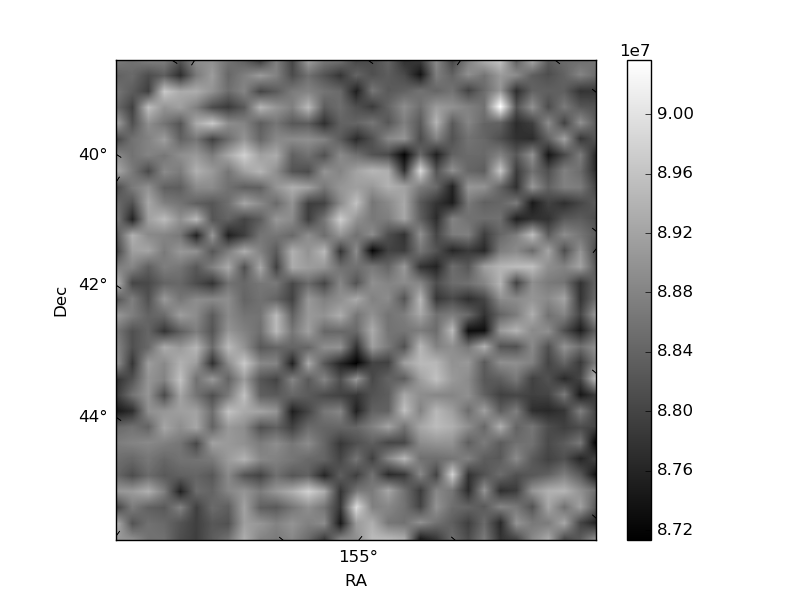
Quadrant B |
|---|---|---|---|
| Quadrant D | 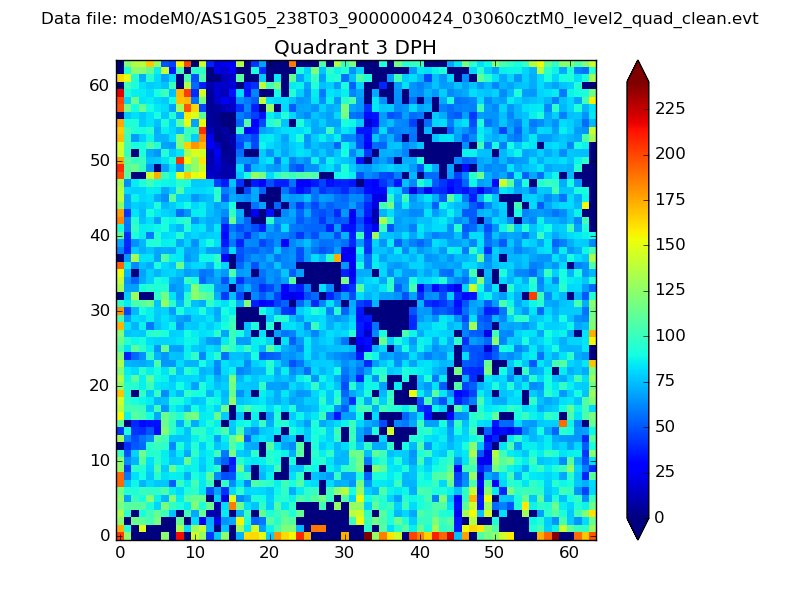 |
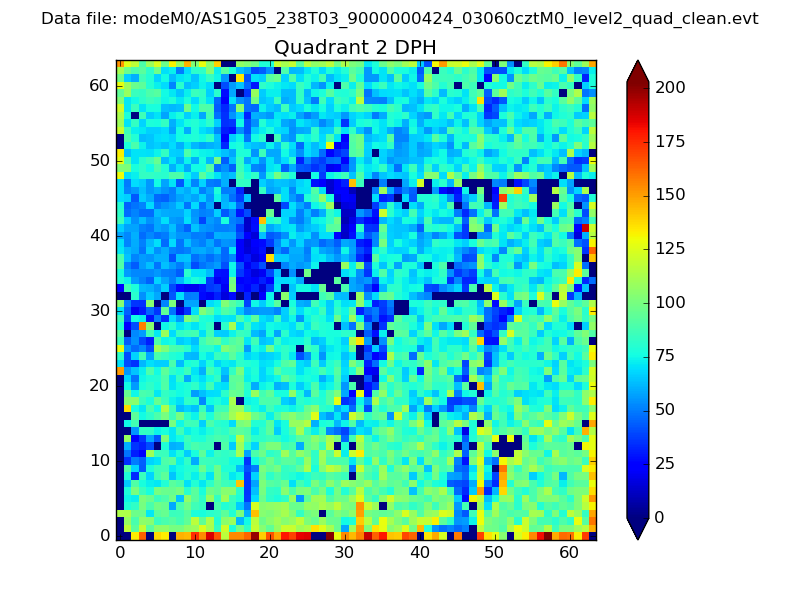 |
Quadrant C |
| Plot type | Count rate plots | Images |
|---|---|---|
| Comparison with Poisson distribution Blue bars denote a histogram of data divided into 1 sec bins. Red curve is a Poisson curve with rate = median count rate of data. |
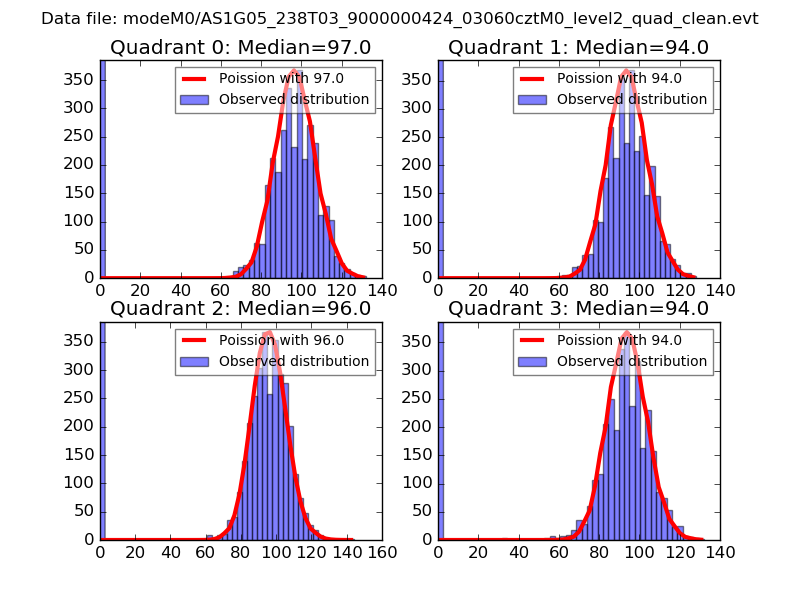 |
 |
| Quadrant-wise count rates Data is divided into 100 sec bins |
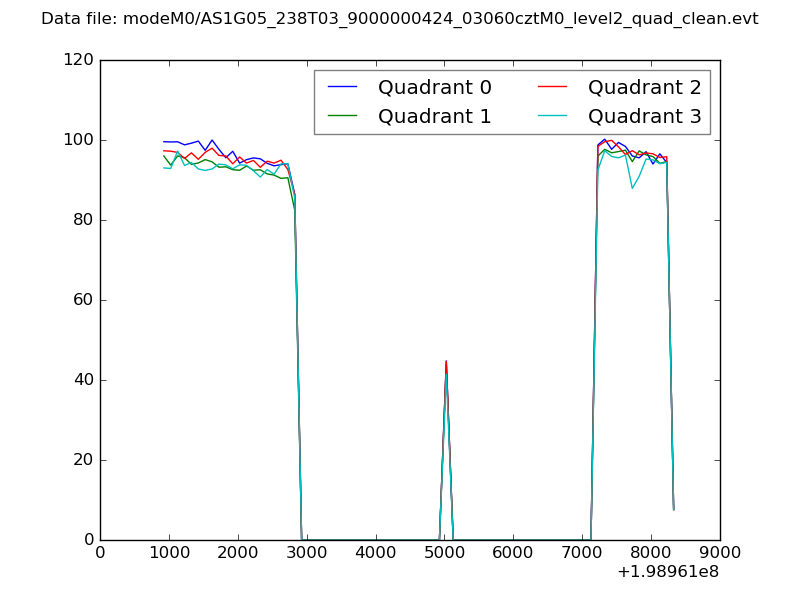 |
|
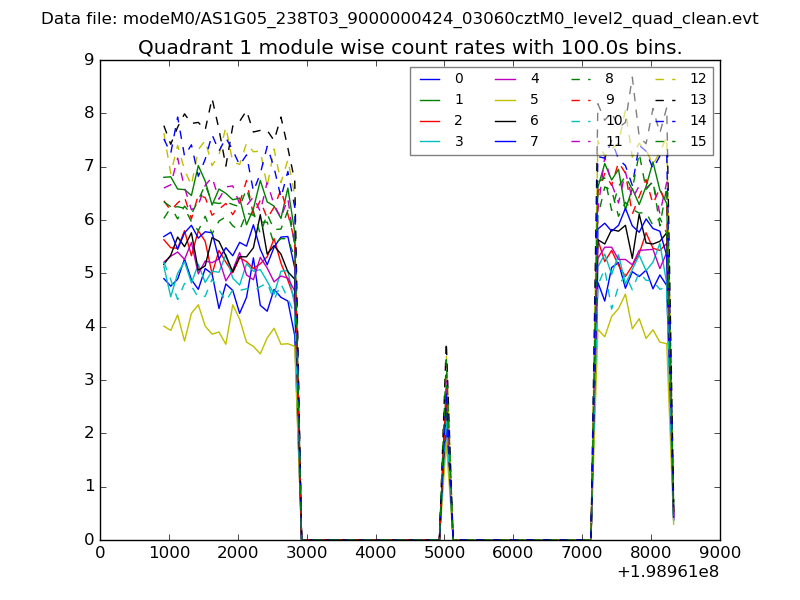
| Module-wise count rates for Quadrant A Data is divided into 100 sec bins |
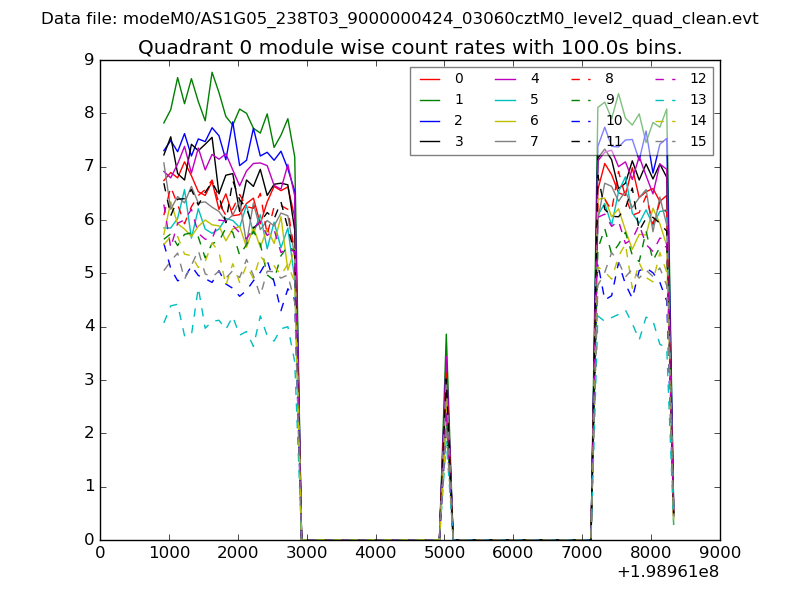 |
 |
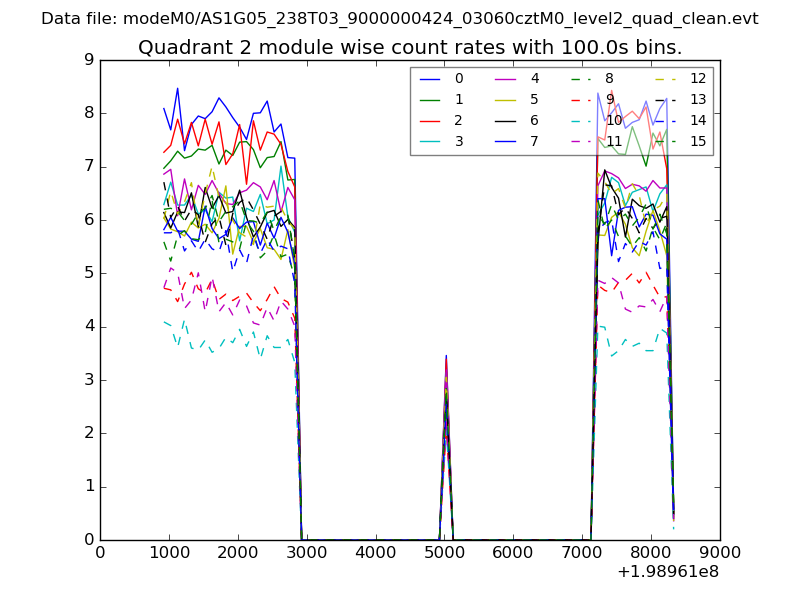
| Module-wise count rates for Quadrant B Data is divided into 100 sec bins |
 |
 |
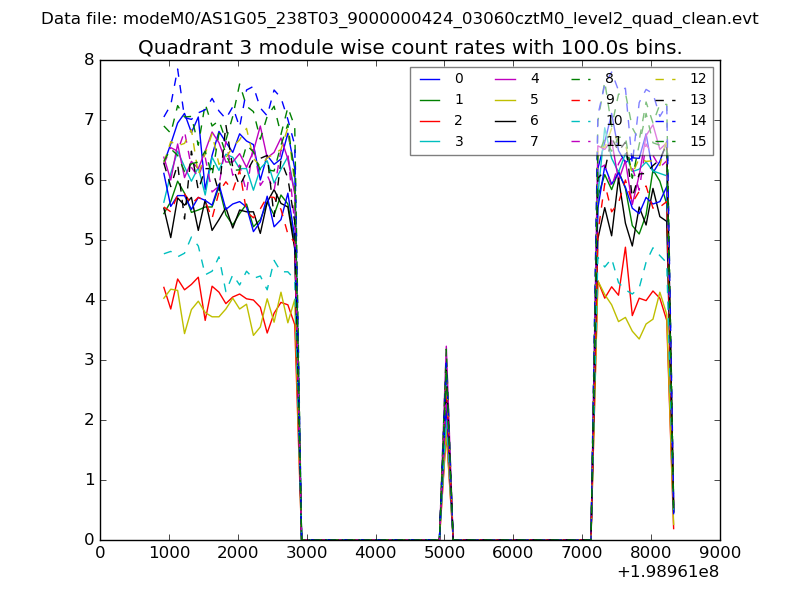
| Module-wise count rates for Quadrant C Data is divided into 100 sec bins |
 |
 |
| Module-wise count rates for Quadrant D Data is divided into 100 sec bins |
 |
 |
| Parameter | Plot |
|---|---|
| CZT HV Monitor |  |
| D_VDD | 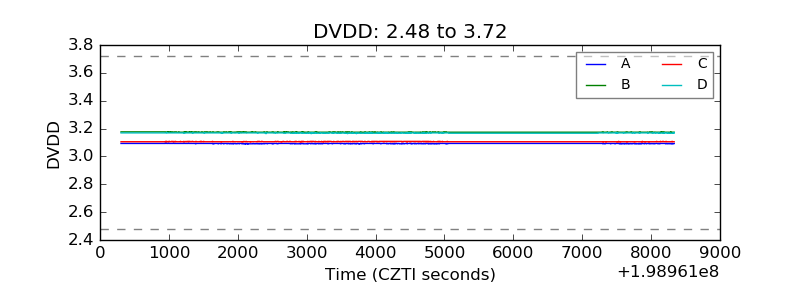 |
| Temperature 1 | 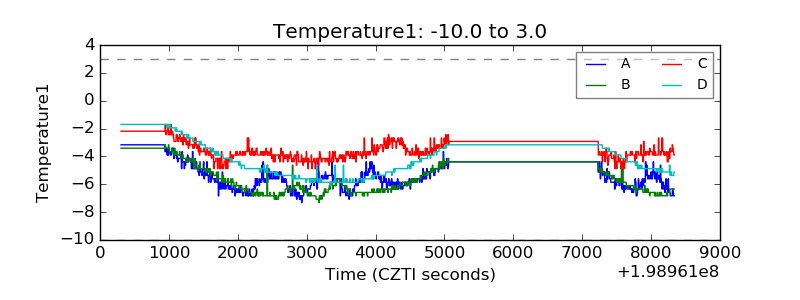 |
| Veto HV Monitor | 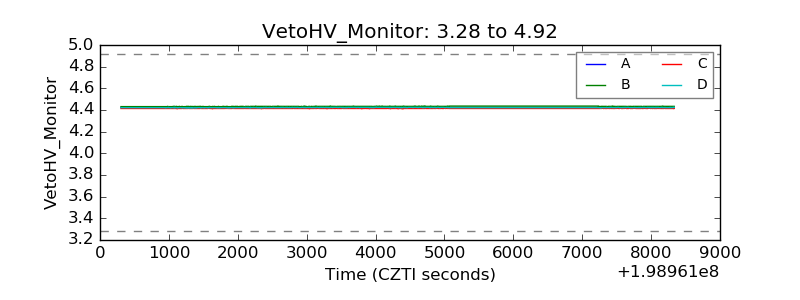 |
| Veto LLD | 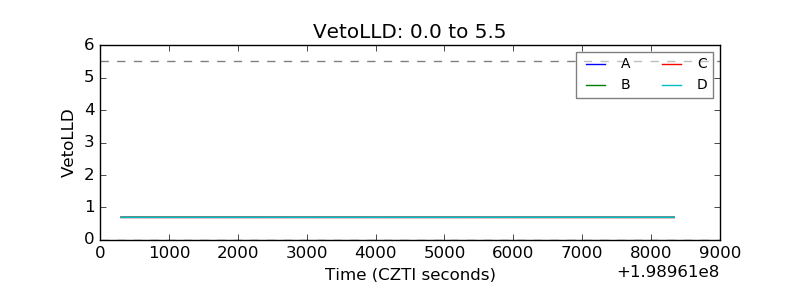 |
| Alpha Counter | 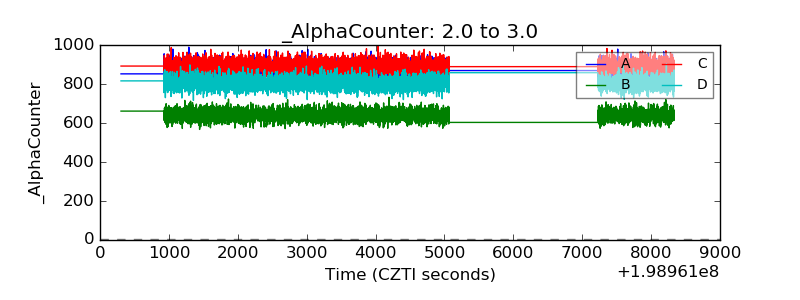 |
| _CPM_Rate | 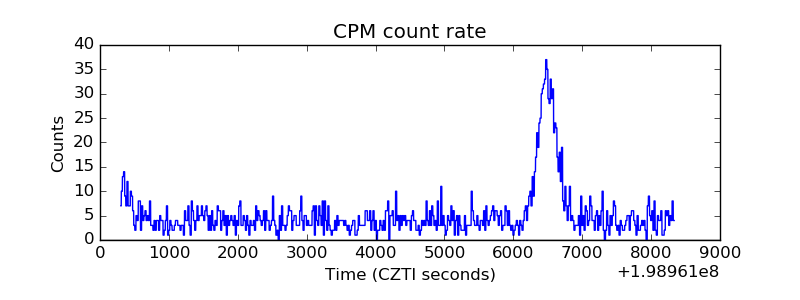 |
| CZT Counter | 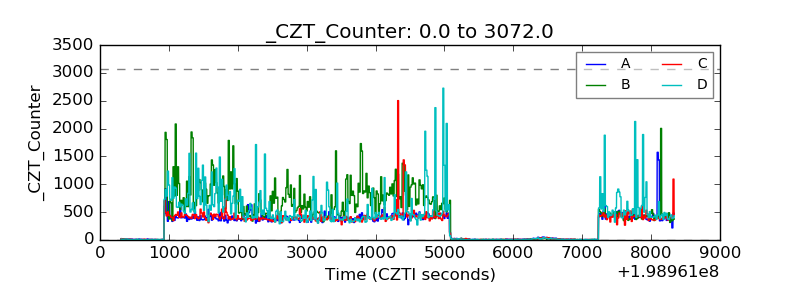 |
| +2.5 Volts monitor |  |
| +5 Volts monitor | 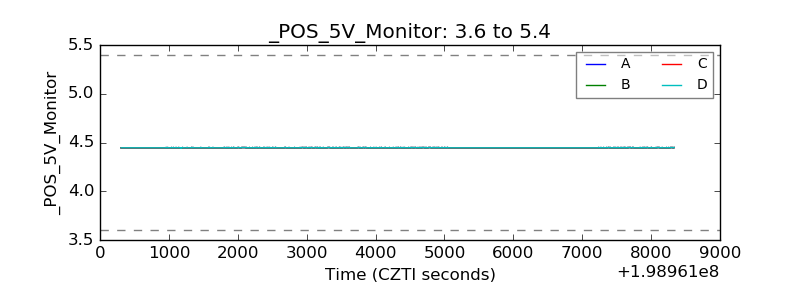 |
| _ROLL_ROT | 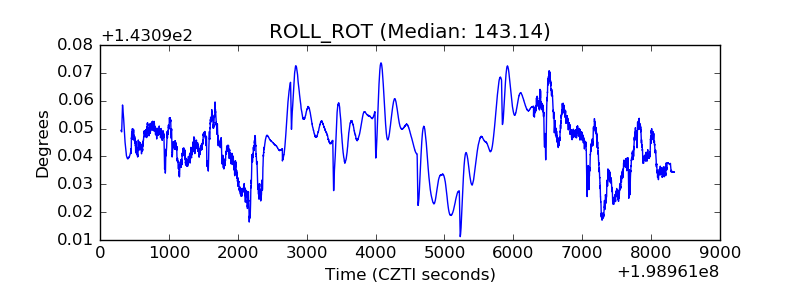 |
| _Roll_DEC | 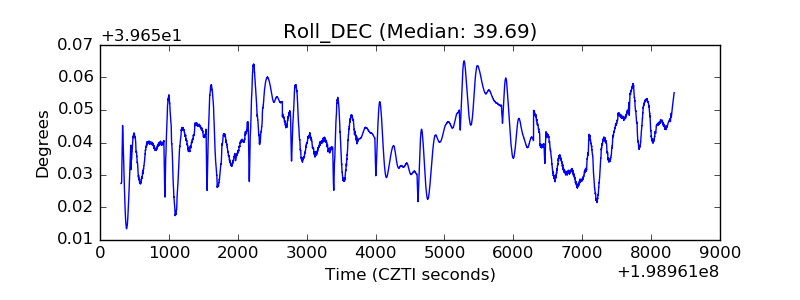 |
| _Roll_RA | 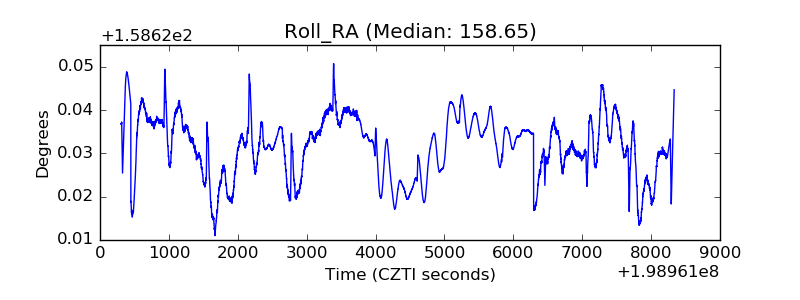 |
| Veto Counter | 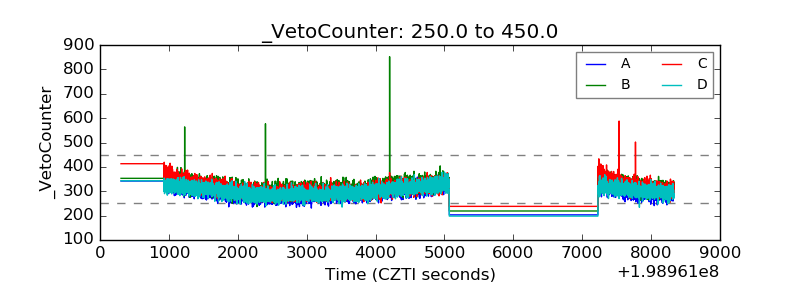 |