| Param | Original file | Final file |
|---|---|---|
| Filename | modeM0/AS1G05_238T03_9000000424_03063cztM0_level2.evt | modeM0/AS1G05_238T03_9000000424_03063cztM0_level2_quad_clean.evt |
| Size (bytes) | 339,454,080 | 41,474,880 |
| Size | 323.7 MB | 39.6 MB |
| Events in quadrant A | 2,187,266 | 228,102 |
| Events in quadrant B | 2,280,897 | 228,184 |
| Events in quadrant C | 2,613,214 | 224,301 |
| Events in quadrant D | 2,851,484 | 217,634 |
| Mode M0 | |||
|---|---|---|---|
| Quadrant | BADHDUFLAG | Total packets | Discarded packets |
| A | 0 | 10344 | 3 |
| B | 0 | 10449 | 2 |
| C | 0 | 11597 | 2 |
| D | 0 | 12399 | 2 |
| Mode M9 | |||
|---|---|---|---|
| Quadrant | BADHDUFLAG | Total packets | Discarded packets |
| A | 0 | 33 | 0 |
| B | 0 | 33 | 0 |
| C | 0 | 33 | 0 |
| D | 0 | 34 | 0 |
| Mode SS | |||
|---|---|---|---|
| Quadrant | BADHDUFLAG | Total packets | Discarded packets |
| A | 0 | 104 | 0 |
| B | 0 | 104 | 0 |
| C | 0 | 104 | 0 |
| D | 0 | 104 | 0 |
| Quadrant | Total seconds | Saturated seconds | Saturation percentage |
|---|---|---|---|
| A | 5092 | 9 | 0.176748% |
| B | 5092 | 21 | 0.412412% |
| C | 5092 | 141 | 2.769049% |
| D | 5092 | 180 | 3.534957% |
Noise dominated data is calculated using 1-second bins in cleaned event files. If a bin has >2000 counts, and if more than 50% of those come from <1% of pixels, then it is considered to be noise-dominated and hence unusable.
| Quadrant | # 1 sec bins | Bins with >0 counts | Bins with >2000 counts | High rate bins dominated by noise | Noise dominated (total time) | Noise dominated (detector-on time) | Marked lightcurve |
|---|---|---|---|---|---|---|---|
| A | 7246 | 5093 | 4 | 4 | 0.06% | 0.08% |  |
| B | 7246 | 5093 | 10 | 10 | 0.14% | 0.20% | 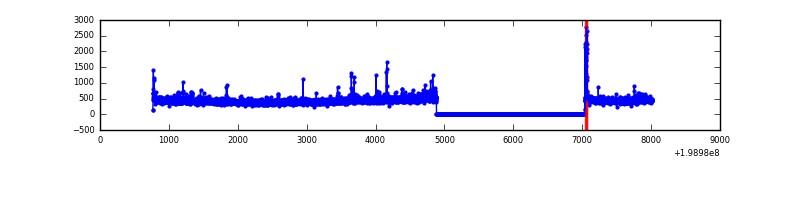 |
| C | 7246 | 5093 | 129 | 129 | 1.78% | 2.53% | 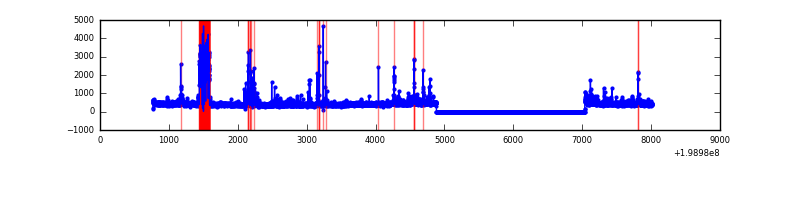 |
| D | 7246 | 5093 | 158 | 158 | 2.18% | 3.10% |  |
Top three noisy pixels from each quadrant. If the there are fewer than three noisy pixels in the level2.evt file, extra rows are filled as -1
| Pixel properties | Quadrant properties | ||||||
|---|---|---|---|---|---|---|---|
| Quadrant | DetID | PixID | Counts | Sigma | Mean | Median | Sigma |
| A | 12 | 247 | 46598 | 411.97 | 541 | 528 | 111.8 |
| A | 0 | 50 | 18842 | 163.77 | 541 | 528 | 111.8 |
| A | 0 | 118 | 11165 | 95.12 | 541 | 528 | 111.8 |
| B | 15 | 204 | 40698 | 373.03 | 552 | 541 | 107.7 |
| B | 5 | 200 | 26334 | 239.6 | 552 | 541 | 107.7 |
| B | 0 | 219 | 25393 | 230.86 | 552 | 541 | 107.7 |
| C | 14 | 234 | 317605 | 2578.59 | 518 | 520 | 123.0 |
| C | 14 | 223 | 205582 | 1667.6 | 518 | 520 | 123.0 |
| C | 1 | 16 | 36931 | 296.1 | 518 | 520 | 123.0 |
| D | 2 | 152 | 368656 | 2651.16 | 509 | 498 | 138.9 |
| D | 2 | 136 | 141289 | 1013.86 | 509 | 498 | 138.9 |
| D | 10 | 85 | 108455 | 777.42 | 509 | 498 | 138.9 |
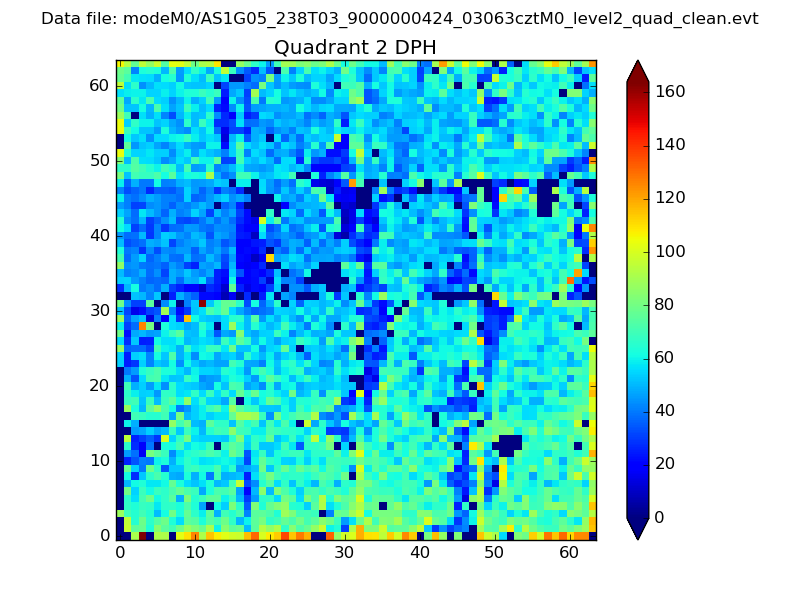
Histogram calculated using DETX and DETY for each event in the final _common_clean file
| Quadrant A | 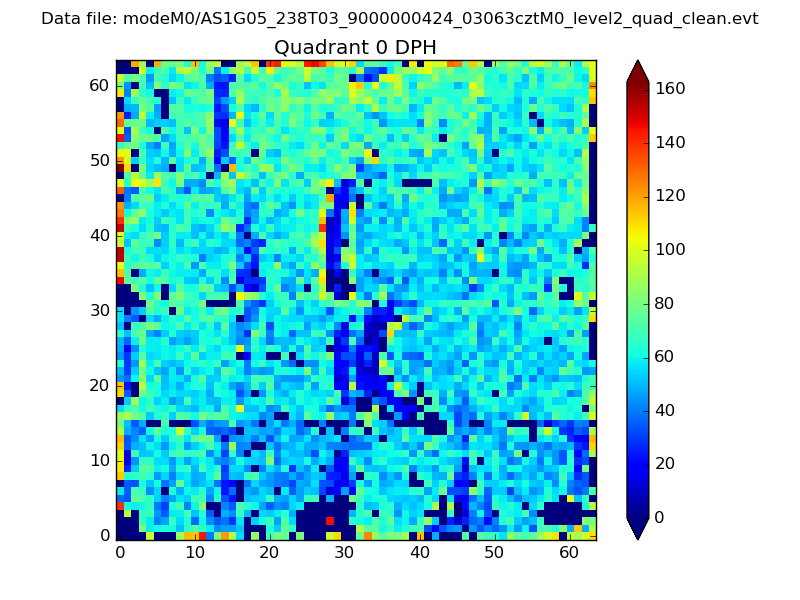 |
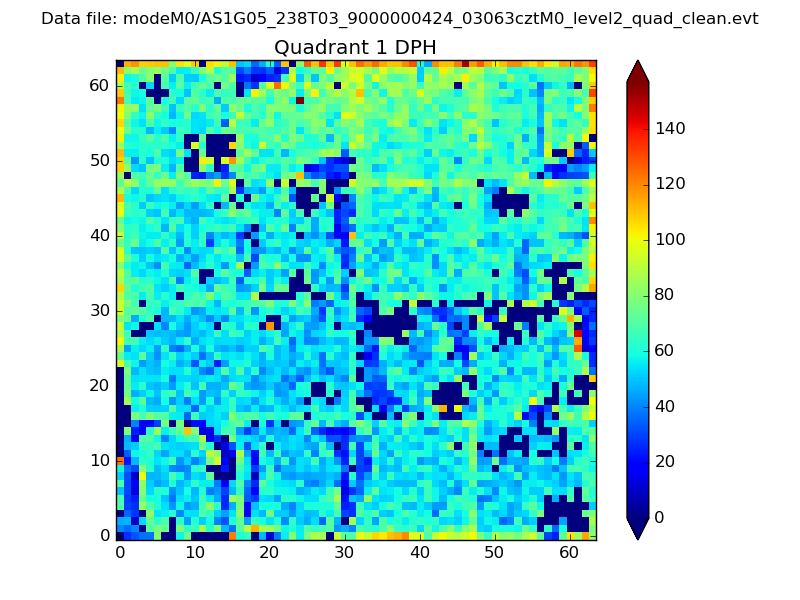 |
Quadrant B |
|---|---|---|---|
| Quadrant D | 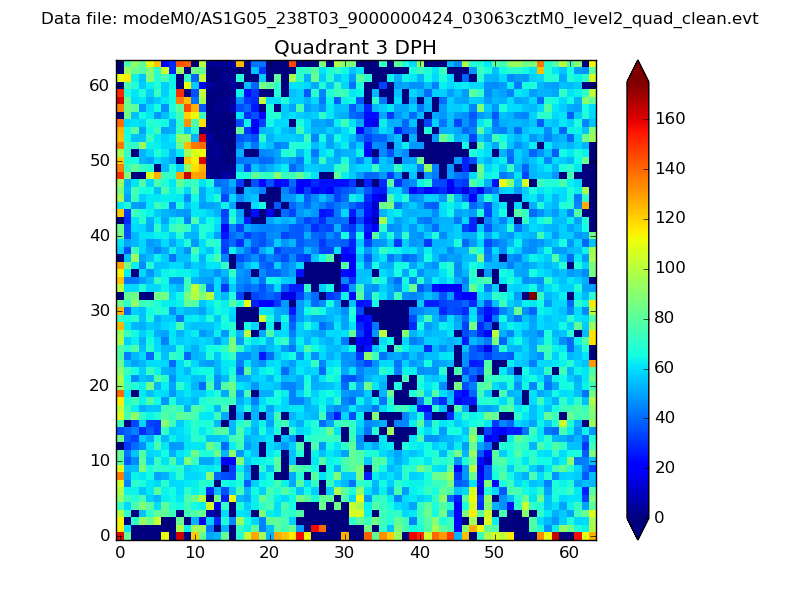 |
 |
Quadrant C |
| Plot type | Count rate plots | Images |
|---|---|---|
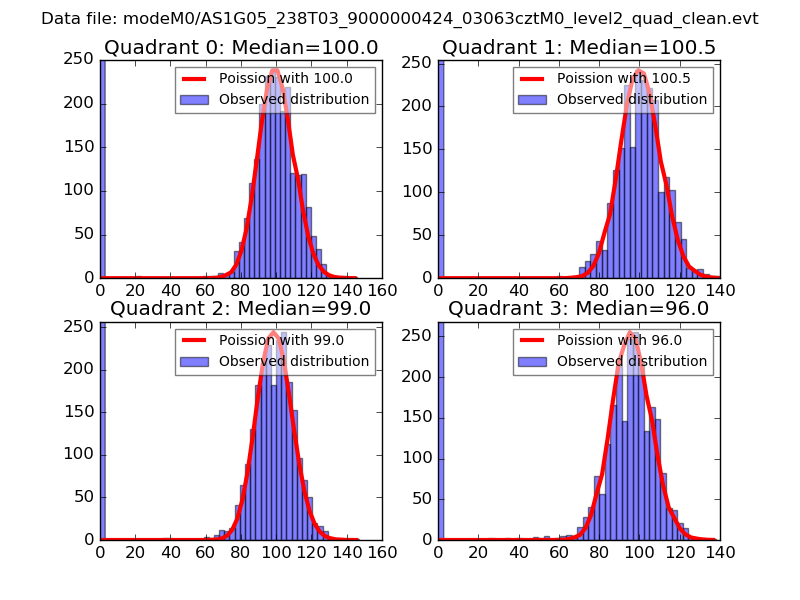
| Comparison with Poisson distribution Blue bars denote a histogram of data divided into 1 sec bins. Red curve is a Poisson curve with rate = median count rate of data. |
 |
 |
| Quadrant-wise count rates Data is divided into 100 sec bins |
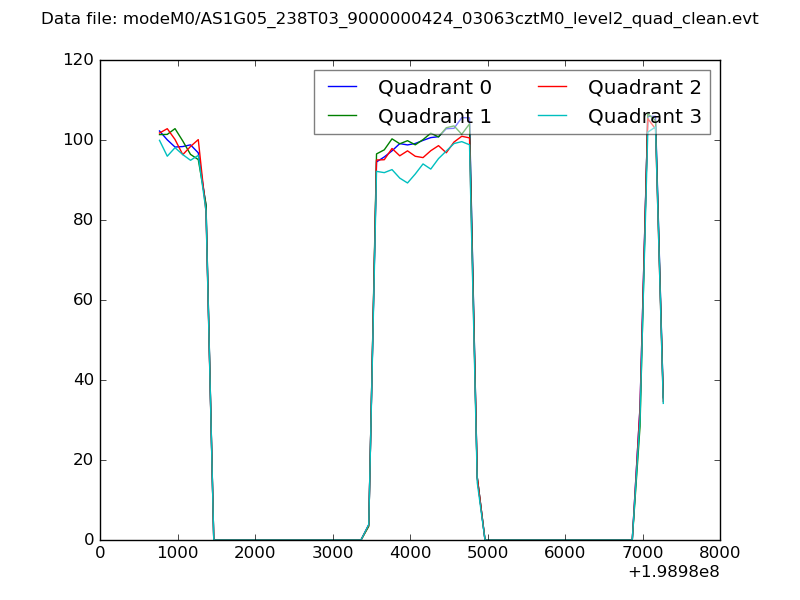 |
|
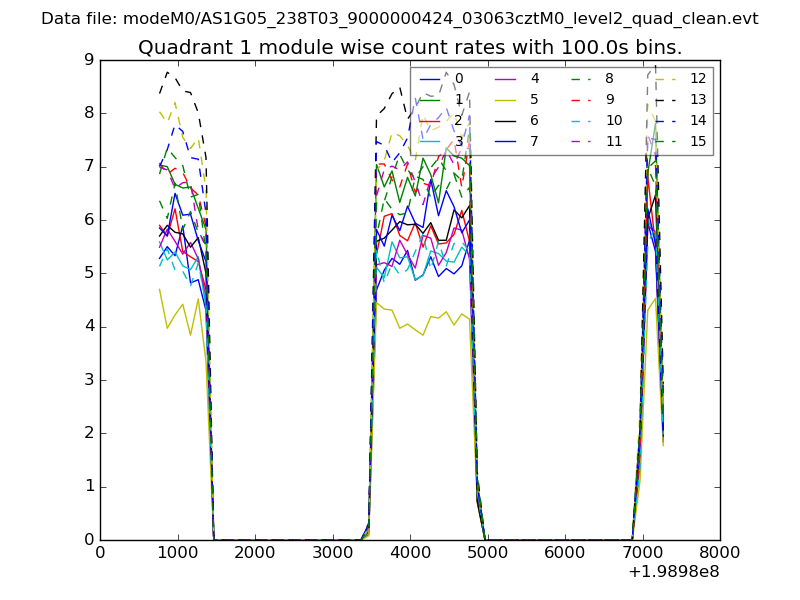
| Module-wise count rates for Quadrant A Data is divided into 100 sec bins |
 |
 |
| Module-wise count rates for Quadrant B Data is divided into 100 sec bins |
 |
 |
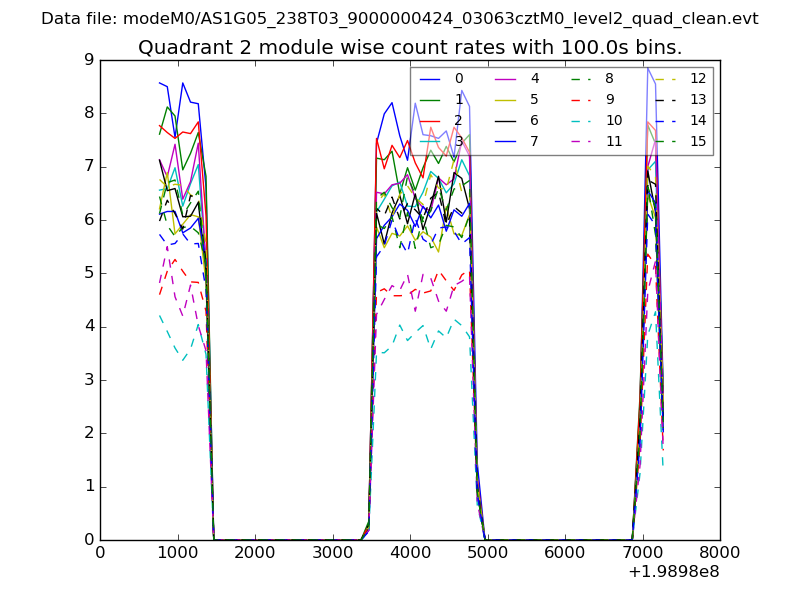
| Module-wise count rates for Quadrant C Data is divided into 100 sec bins |
 |
 |
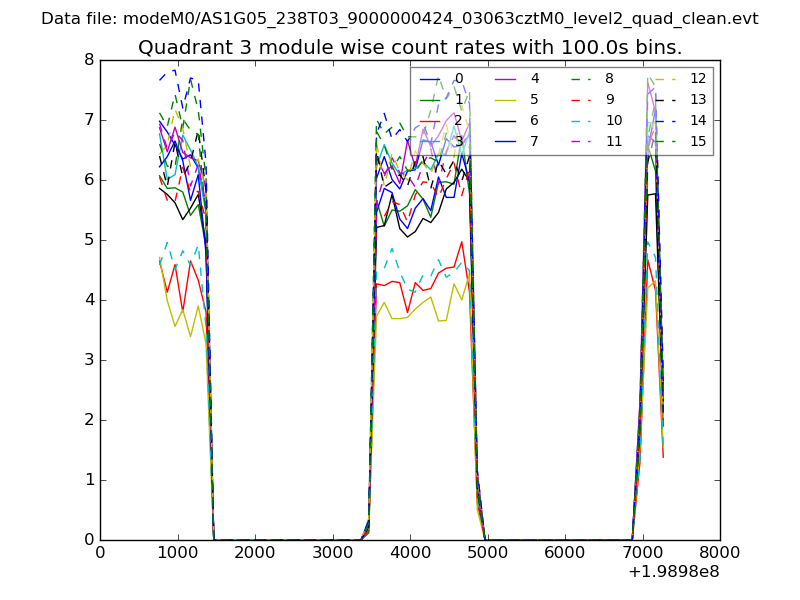
| Module-wise count rates for Quadrant D Data is divided into 100 sec bins |
 |
 |
| Parameter | Plot |
|---|---|
| CZT HV Monitor | 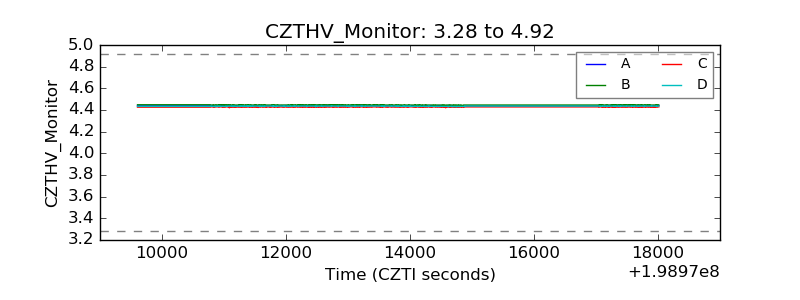 |
| D_VDD | 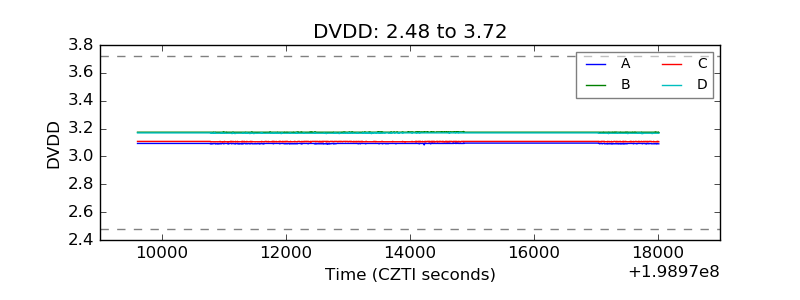 |
| Temperature 1 | 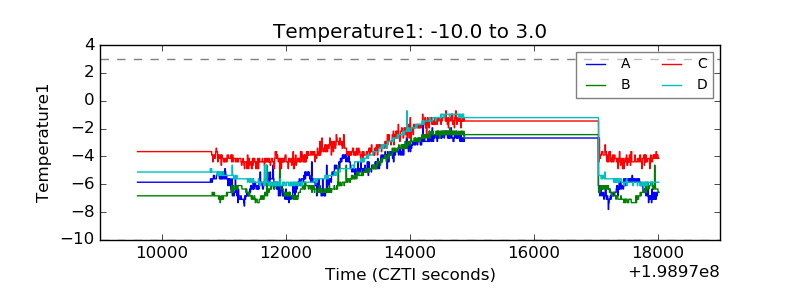 |
| Veto HV Monitor | 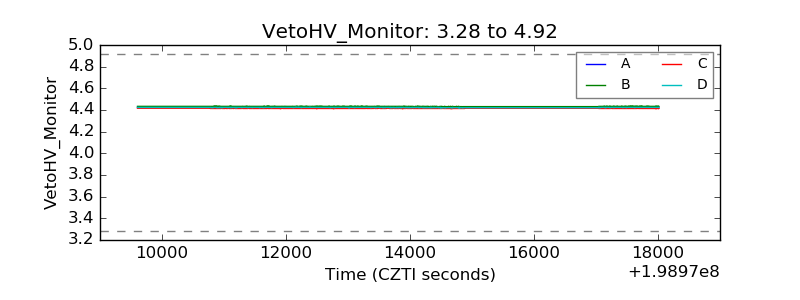 |
| Veto LLD | 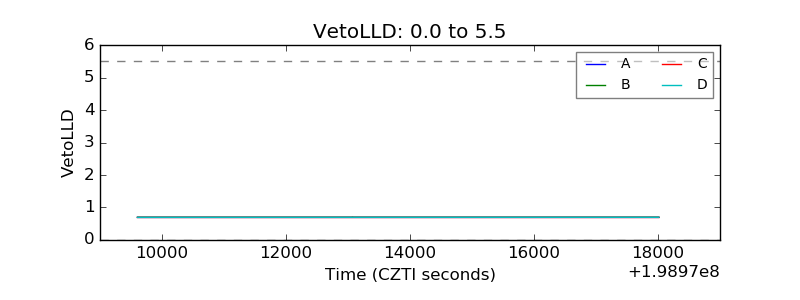 |
| Alpha Counter | 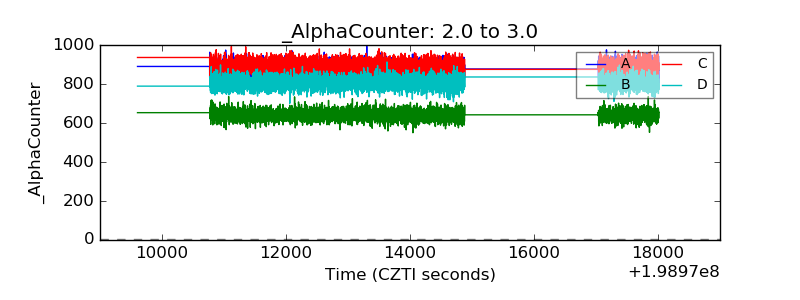 |
| _CPM_Rate | 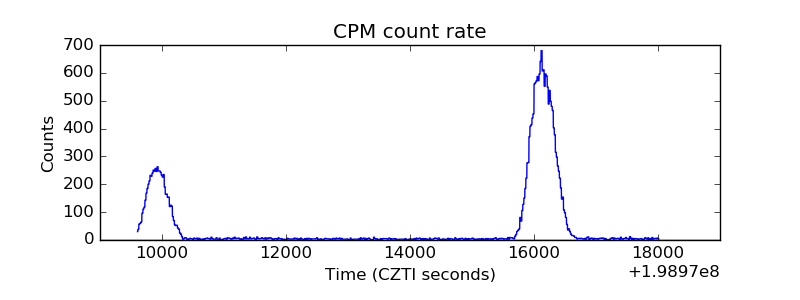 |
| CZT Counter | 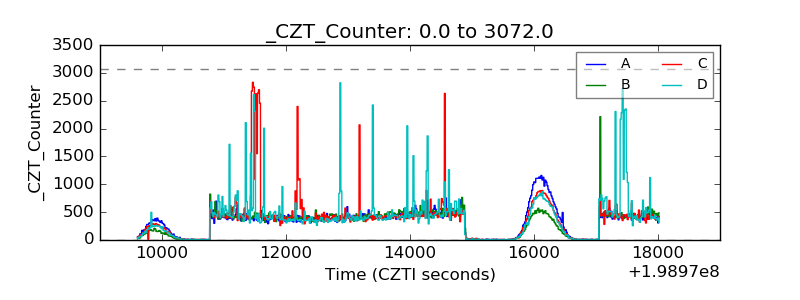 |
| +2.5 Volts monitor |  |
| +5 Volts monitor |  |
| _ROLL_ROT | 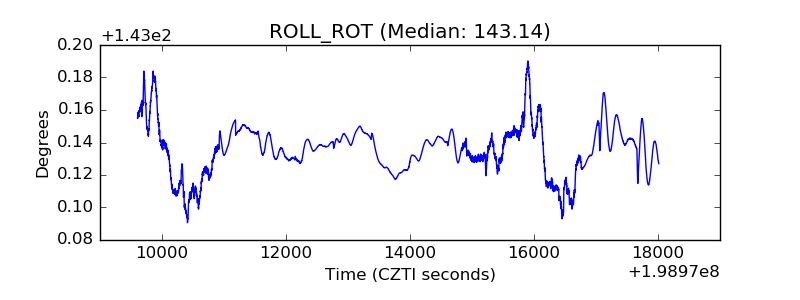 |
| _Roll_DEC | 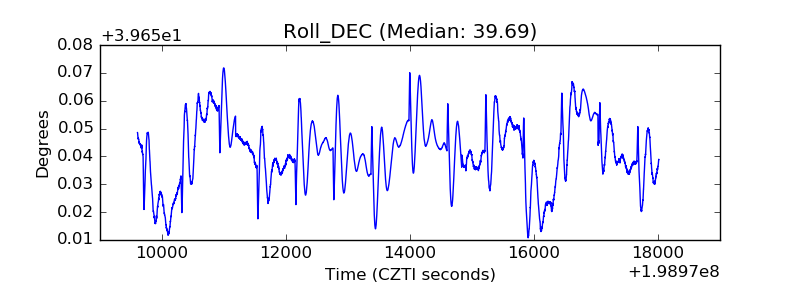 |
| _Roll_RA | 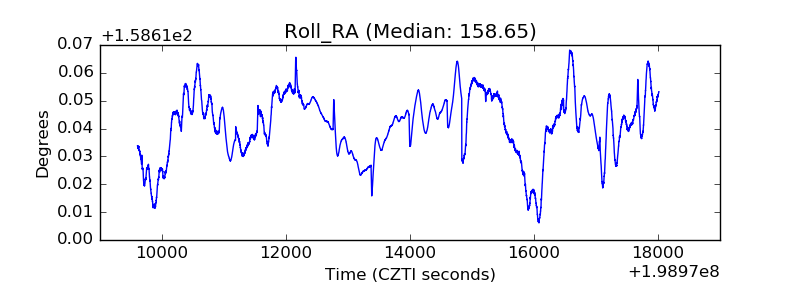 |
| Veto Counter |  |