| Param | Original file | Final file |
|---|---|---|
| Filename | modeM0/AS1G05_238T03_9000000424_03064cztM0_level2.evt | modeM0/AS1G05_238T03_9000000424_03064cztM0_level2_quad_clean.evt |
| Size (bytes) | 337,547,520 | 39,055,680 |
| Size | 321.9 MB | 37.2 MB |
| Events in quadrant A | 2,320,045 | 210,671 |
| Events in quadrant B | 2,445,572 | 210,867 |
| Events in quadrant C | 2,409,564 | 204,626 |
| Events in quadrant D | 2,702,129 | 200,564 |
| Mode M0 | |||
|---|---|---|---|
| Quadrant | BADHDUFLAG | Total packets | Discarded packets |
| A | 0 | 10370 | 3 |
| B | 0 | 10672 | 2 |
| C | 0 | 10800 | 2 |
| D | 0 | 11794 | 2 |
| Mode M9 | |||
|---|---|---|---|
| Quadrant | BADHDUFLAG | Total packets | Discarded packets |
| A | 0 | 44 | 0 |
| B | 0 | 44 | 0 |
| C | 0 | 44 | 0 |
| D | 0 | 44 | 0 |
| Mode SS | |||
|---|---|---|---|
| Quadrant | BADHDUFLAG | Total packets | Discarded packets |
| A | 0 | 102 | 0 |
| B | 0 | 102 | 0 |
| C | 0 | 102 | 0 |
| D | 0 | 102 | 0 |
| Quadrant | Total seconds | Saturated seconds | Saturation percentage |
|---|---|---|---|
| A | 5077 | 9 | 0.177270% |
| B | 5077 | 17 | 0.334843% |
| C | 5077 | 22 | 0.433327% |
| D | 5077 | 103 | 2.028757% |
Noise dominated data is calculated using 1-second bins in cleaned event files. If a bin has >2000 counts, and if more than 50% of those come from <1% of pixels, then it is considered to be noise-dominated and hence unusable.
| Quadrant | # 1 sec bins | Bins with >0 counts | Bins with >2000 counts | High rate bins dominated by noise | Noise dominated (total time) | Noise dominated (detector-on time) | Marked lightcurve |
|---|---|---|---|---|---|---|---|
| A | 9386 | 5079 | 3 | 3 | 0.03% | 0.06% |  |
| B | 9386 | 5079 | 10 | 10 | 0.11% | 0.20% | 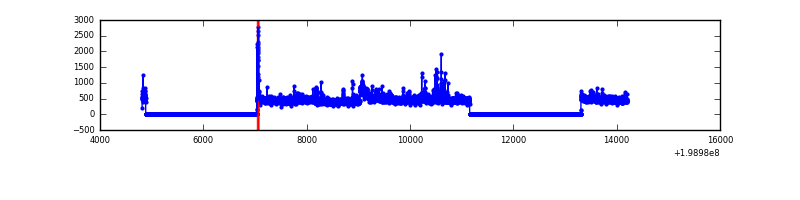 |
| C | 9386 | 5079 | 18 | 18 | 0.19% | 0.35% | 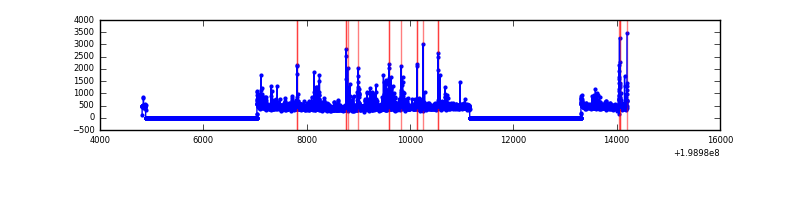 |
| D | 9386 | 5079 | 105 | 105 | 1.12% | 2.07% | 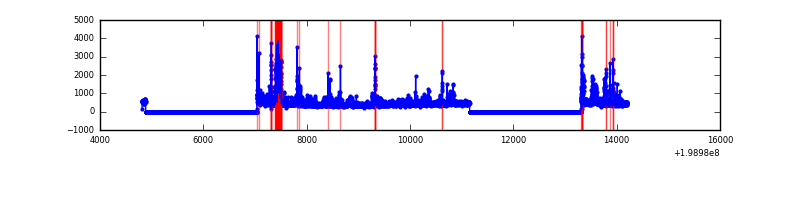 |
Top three noisy pixels from each quadrant. If the there are fewer than three noisy pixels in the level2.evt file, extra rows are filled as -1
| Pixel properties | Quadrant properties | ||||||
|---|---|---|---|---|---|---|---|
| Quadrant | DetID | PixID | Counts | Sigma | Mean | Median | Sigma |
| A | 8 | 15 | 78949 | 686.16 | 556 | 543 | 114.3 |
| A | 12 | 247 | 37903 | 326.95 | 556 | 543 | 114.3 |
| A | 14 | 238 | 30133 | 258.95 | 556 | 543 | 114.3 |
| B | 0 | 230 | 144854 | 1317.94 | 565 | 553 | 109.5 |
| B | 5 | 200 | 37064 | 333.47 | 565 | 553 | 109.5 |
| B | 15 | 204 | 29915 | 268.17 | 565 | 553 | 109.5 |
| C | 14 | 223 | 214188 | 1673.56 | 537 | 537 | 127.7 |
| C | 6 | 80 | 36435 | 281.19 | 537 | 537 | 127.7 |
| C | 1 | 16 | 28606 | 219.87 | 537 | 537 | 127.7 |
| D | 2 | 152 | 403675 | 2858.64 | 528 | 514 | 141.0 |
| D | 7 | 80 | 116265 | 820.74 | 528 | 514 | 141.0 |
| D | 2 | 136 | 29594 | 206.19 | 528 | 514 | 141.0 |
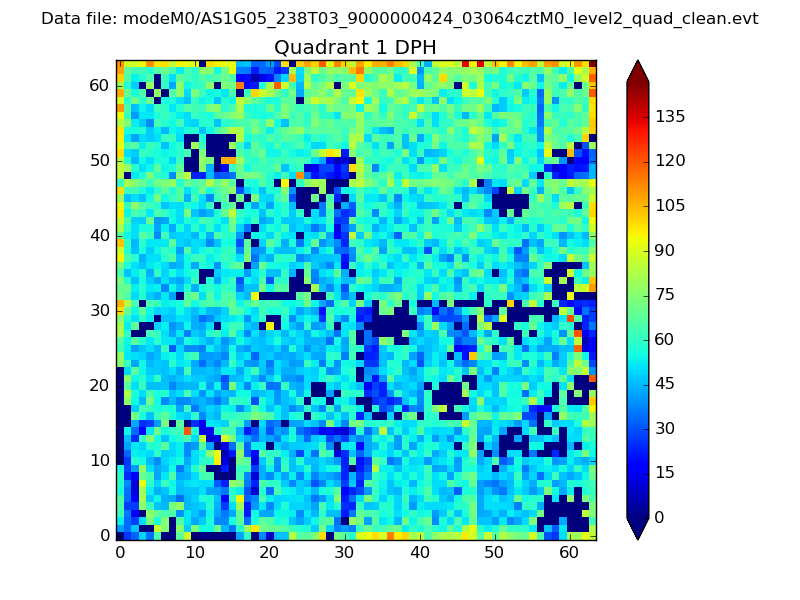
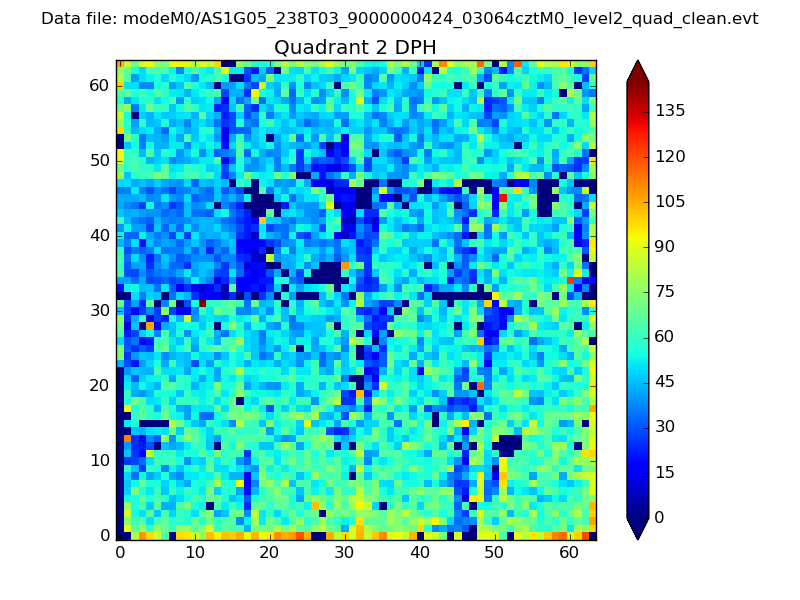
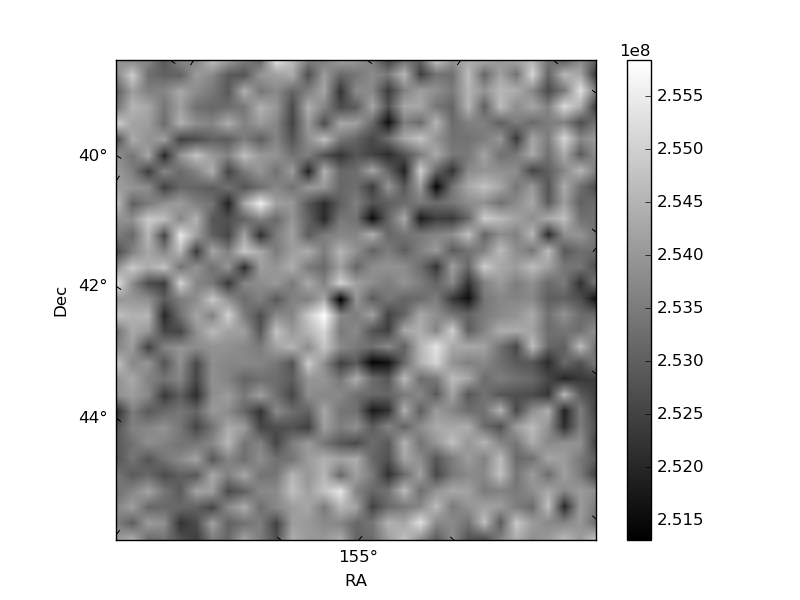
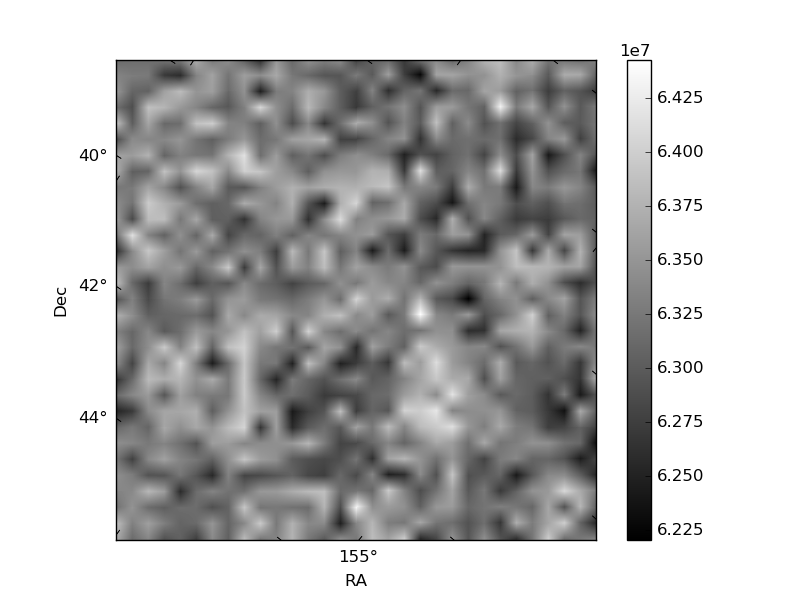
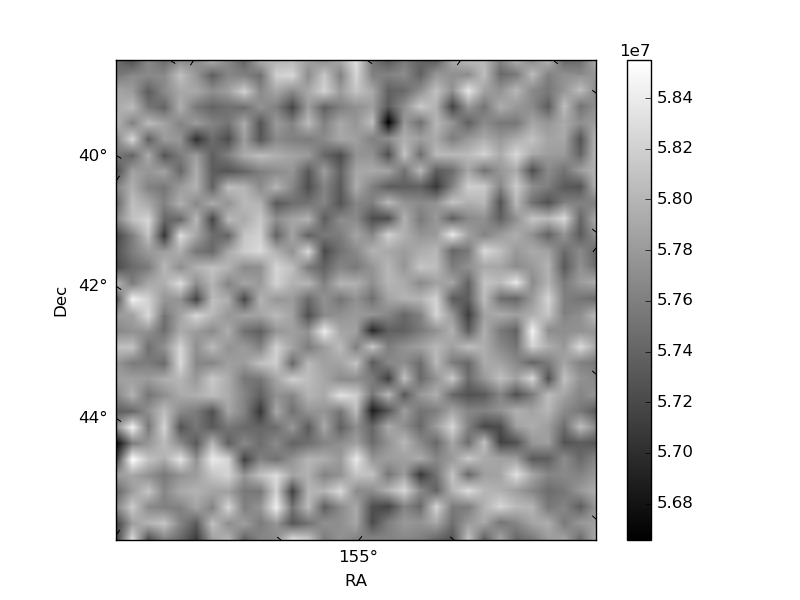
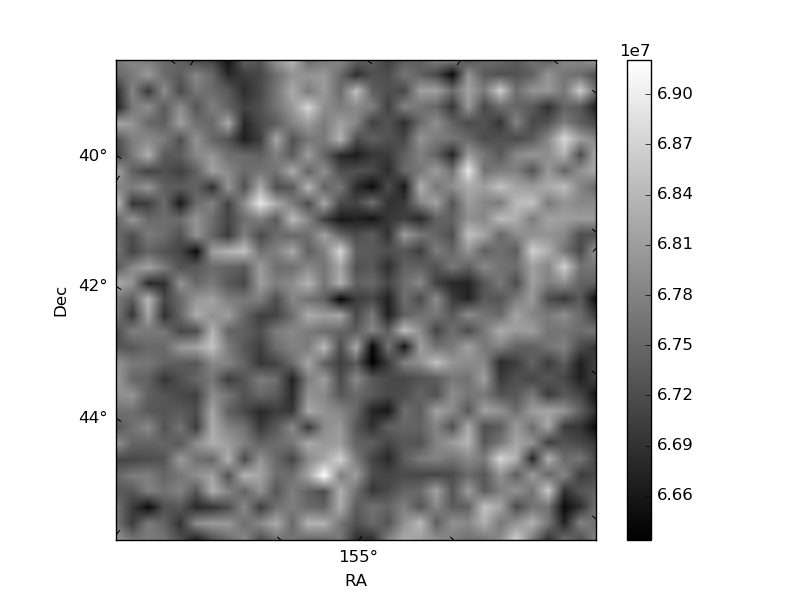
Histogram calculated using DETX and DETY for each event in the final _common_clean file
| Quadrant A | 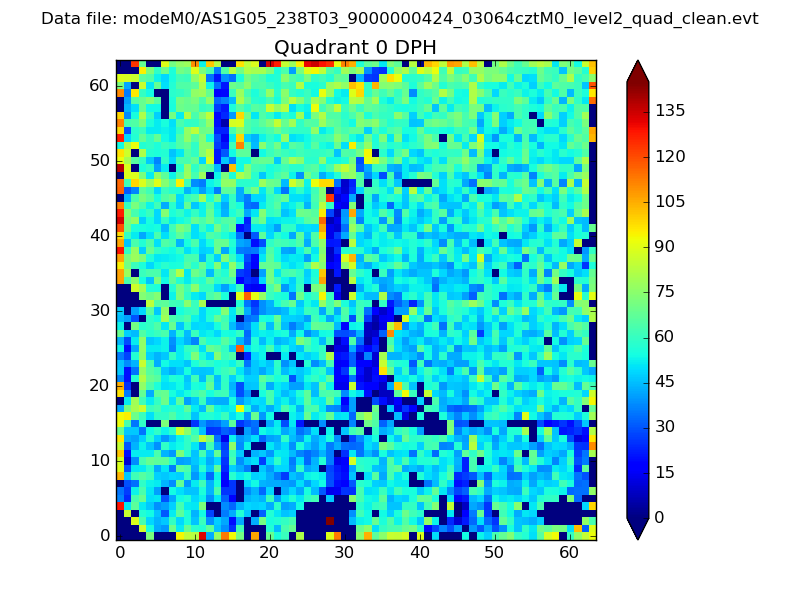 |
 |
Quadrant B |
|---|---|---|---|
| Quadrant D | 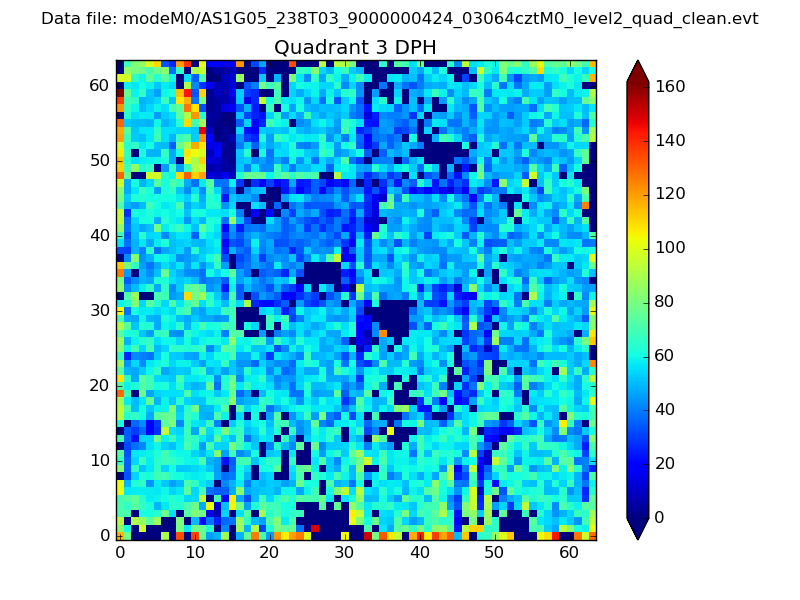 |
 |
Quadrant C |
| Plot type | Count rate plots | Images |
|---|---|---|
| Comparison with Poisson distribution Blue bars denote a histogram of data divided into 1 sec bins. Red curve is a Poisson curve with rate = median count rate of data. |
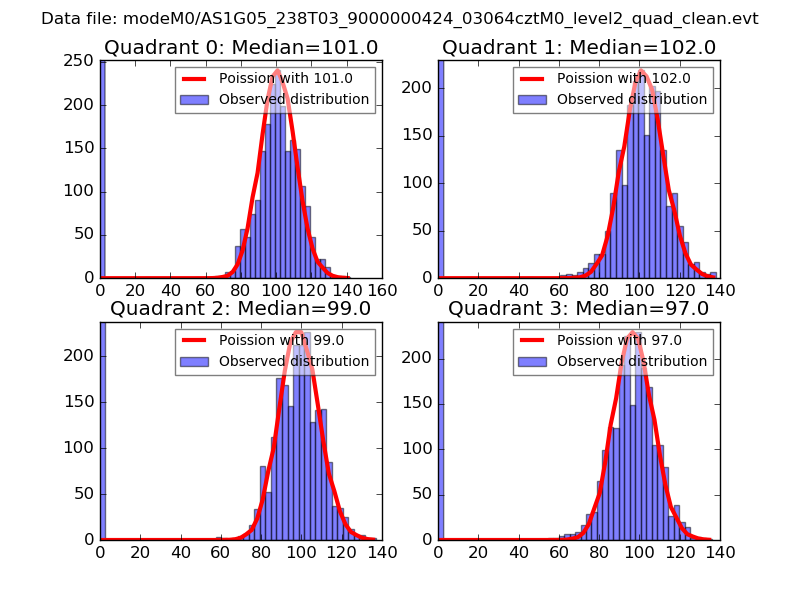 |
 |
| Quadrant-wise count rates Data is divided into 100 sec bins |
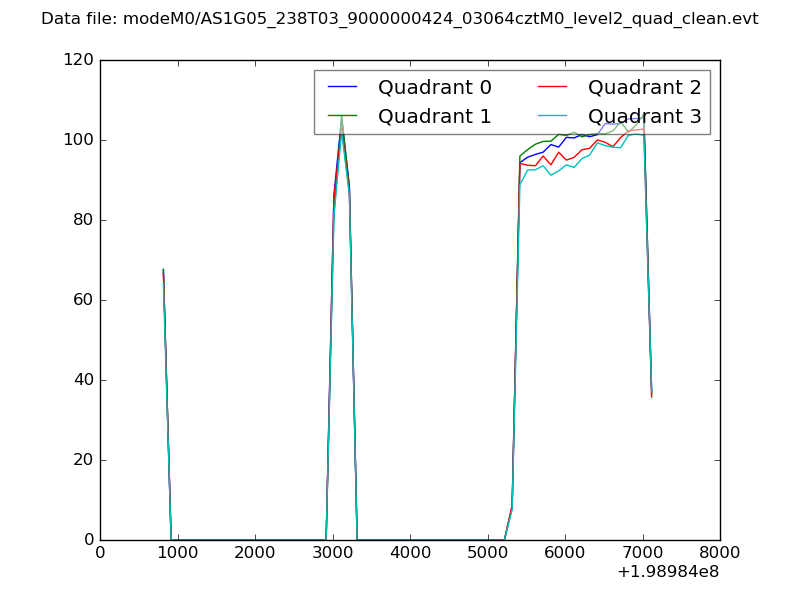 |
|
| Module-wise count rates for Quadrant A Data is divided into 100 sec bins |
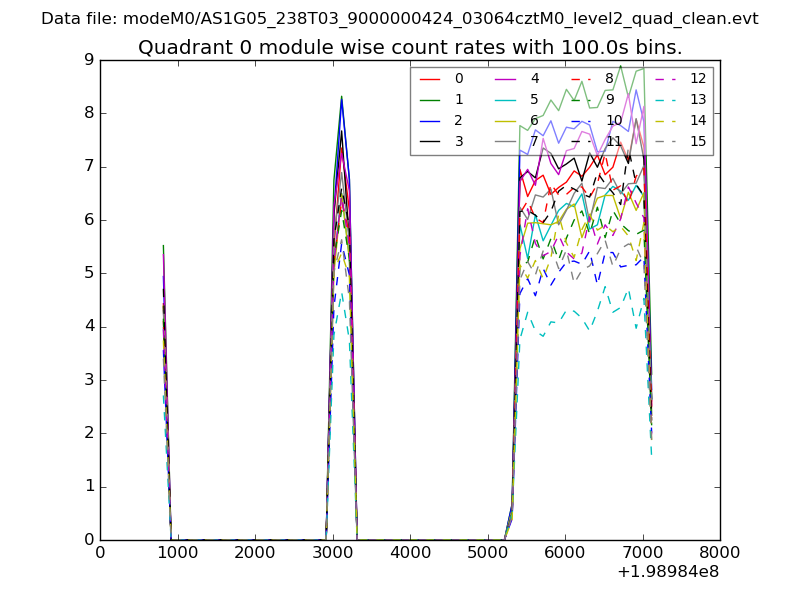 |
 |
| Module-wise count rates for Quadrant B Data is divided into 100 sec bins |
 |
 |
| Module-wise count rates for Quadrant C Data is divided into 100 sec bins |
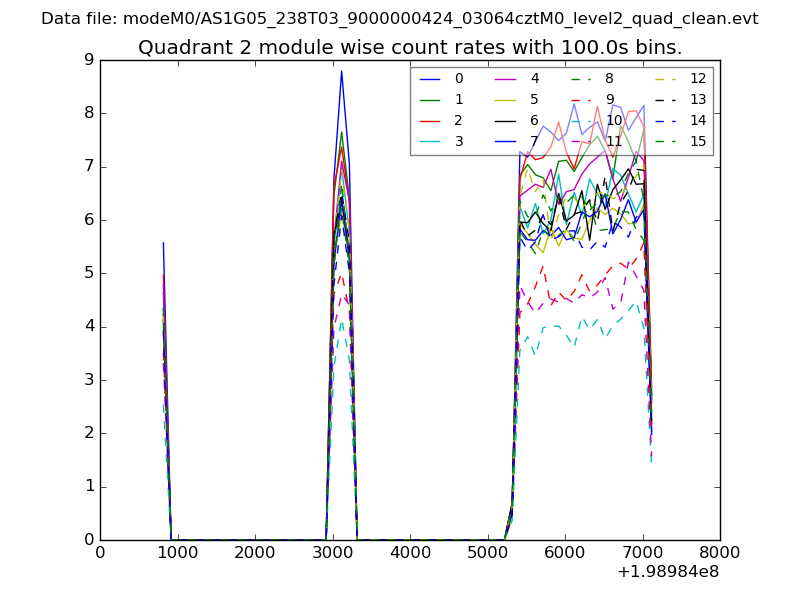 |
 |
| Module-wise count rates for Quadrant D Data is divided into 100 sec bins |
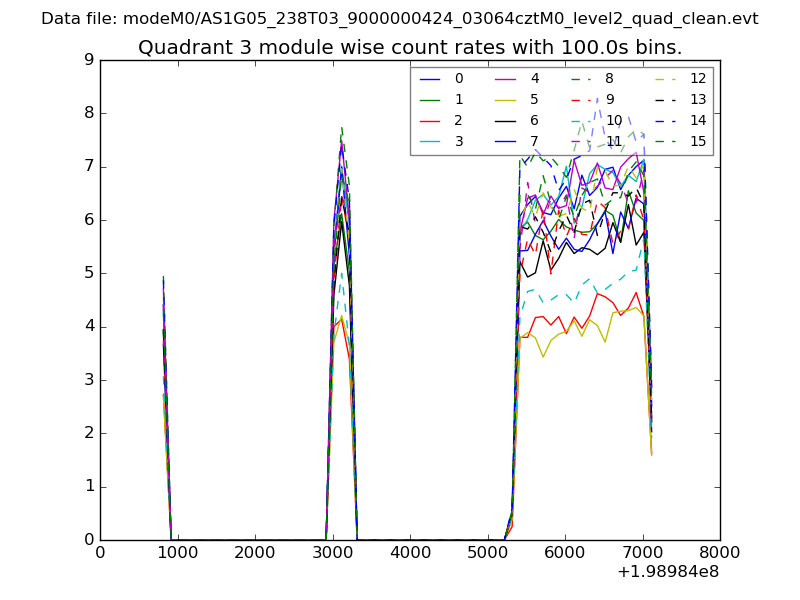 |
 |
| Parameter | Plot |
|---|---|
| CZT HV Monitor | 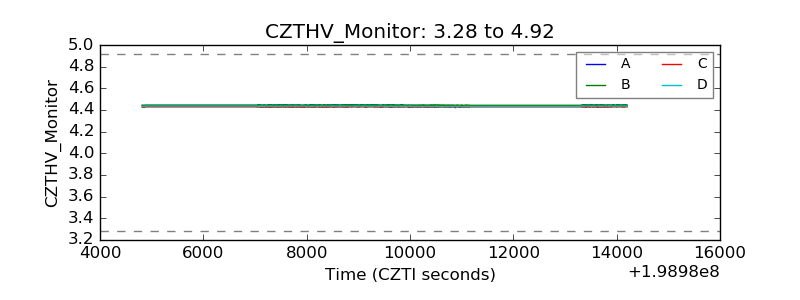 |
| D_VDD | 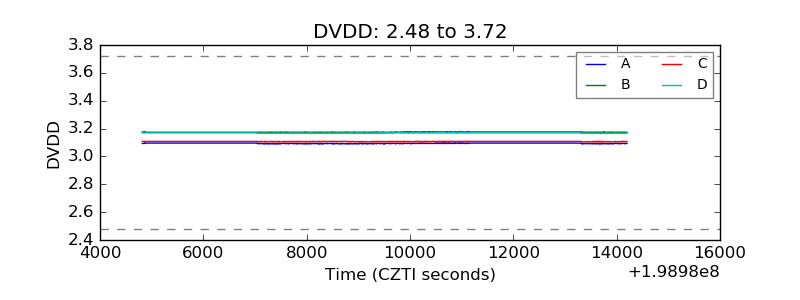 |
| Temperature 1 | 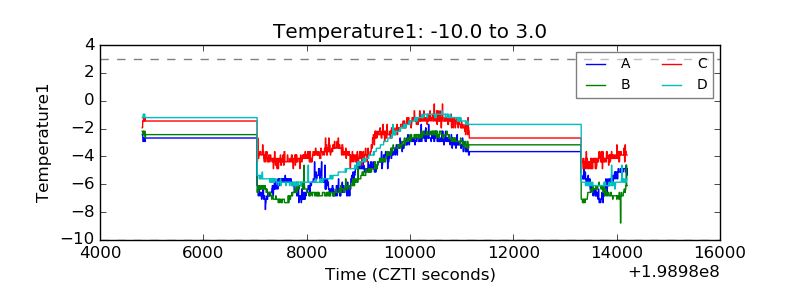 |
| Veto HV Monitor | 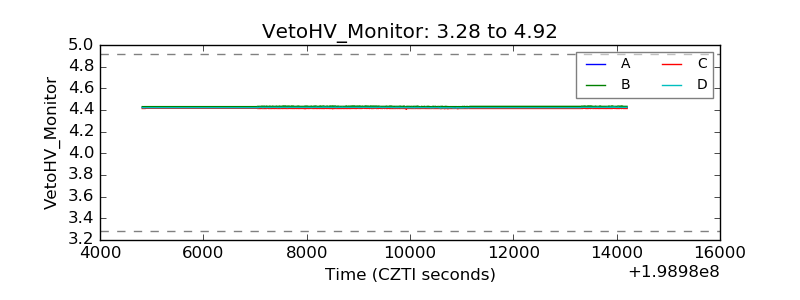 |
| Veto LLD | 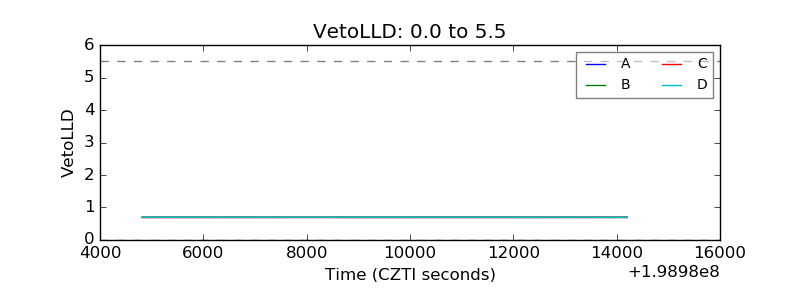 |
| Alpha Counter | 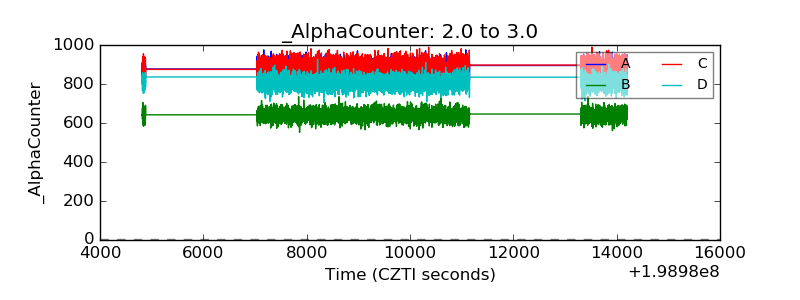 |
| _CPM_Rate | 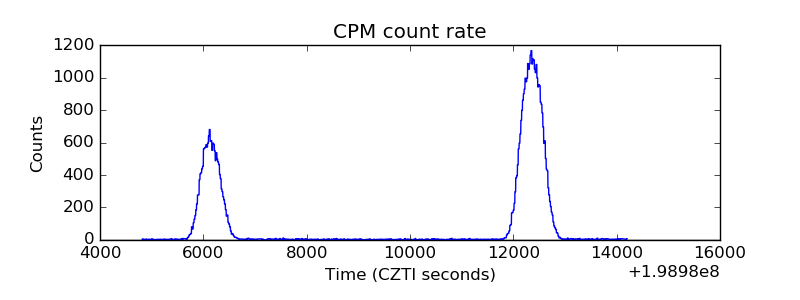 |
| CZT Counter | 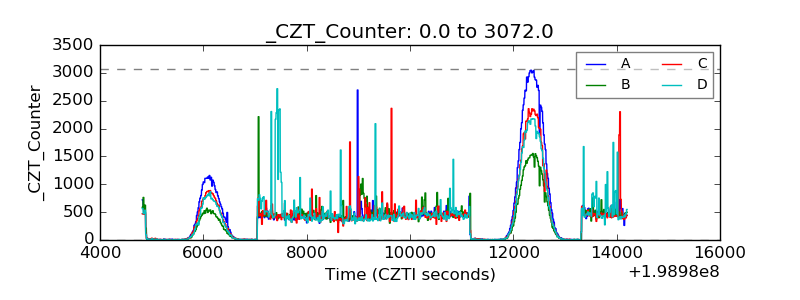 |
| +2.5 Volts monitor |  |
| +5 Volts monitor |  |
| _ROLL_ROT | 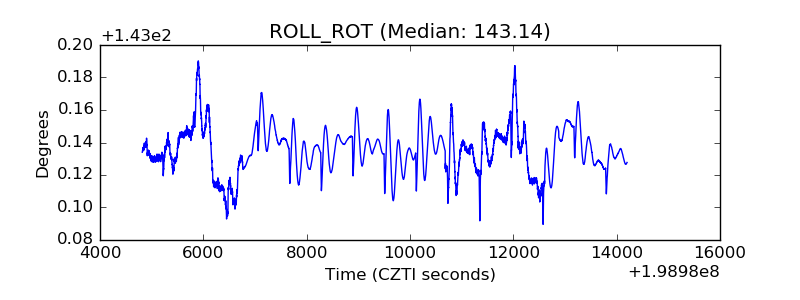 |
| _Roll_DEC | 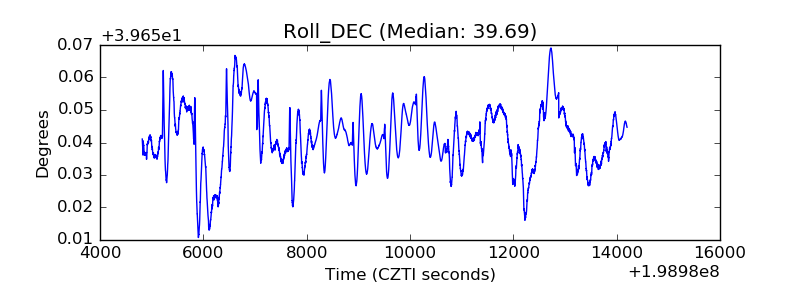 |
| _Roll_RA | 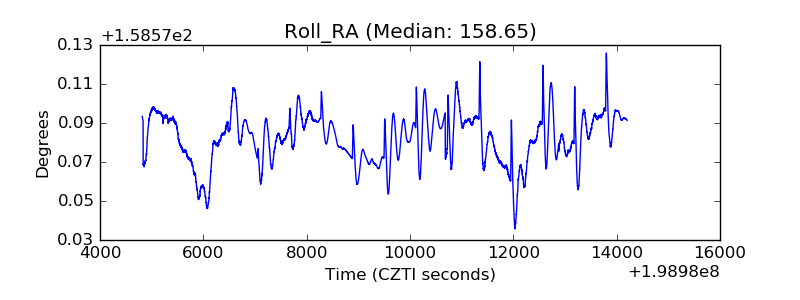 |
| Veto Counter | 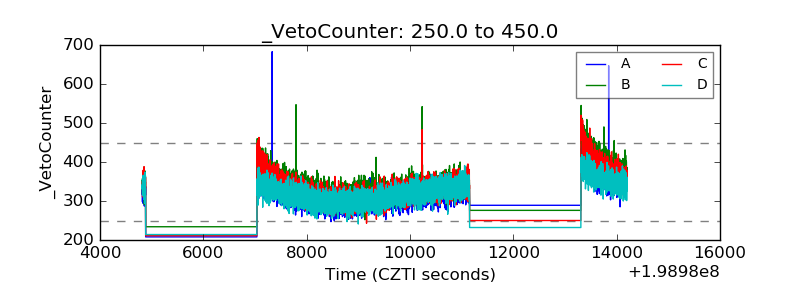 |