| Param | Original file | Final file |
|---|---|---|
| Filename | modeM0/AS1G05_238T03_9000000424_03066cztM0_level2.evt | modeM0/AS1G05_238T03_9000000424_03066cztM0_level2_quad_clean.evt |
| Size (bytes) | 364,147,200 | 40,789,440 |
| Size | 347.3 MB | 38.9 MB |
| Events in quadrant A | 2,748,274 | 221,567 |
| Events in quadrant B | 2,700,481 | 223,778 |
| Events in quadrant C | 2,547,820 | 217,381 |
| Events in quadrant D | 2,680,779 | 210,652 |
| Mode M0 | |||
|---|---|---|---|
| Quadrant | BADHDUFLAG | Total packets | Discarded packets |
| A | 0 | 11386 | 3 |
| B | 0 | 11416 | 2 |
| C | 0 | 11075 | 2 |
| D | 0 | 11648 | 2 |
| Mode M9 | |||
|---|---|---|---|
| Quadrant | BADHDUFLAG | Total packets | Discarded packets |
| A | 0 | 30 | 0 |
| B | 0 | 30 | 0 |
| C | 0 | 30 | 0 |
| D | 0 | 31 | 0 |
| Mode SS | |||
|---|---|---|---|
| Quadrant | BADHDUFLAG | Total packets | Discarded packets |
| A | 0 | 106 | 0 |
| B | 0 | 106 | 0 |
| C | 0 | 106 | 0 |
| D | 0 | 106 | 0 |
| Quadrant | Total seconds | Saturated seconds | Saturation percentage |
|---|---|---|---|
| A | 5150 | 57 | 1.106796% |
| B | 5150 | 18 | 0.349515% |
| C | 5150 | 31 | 0.601942% |
| D | 5150 | 61 | 1.184466% |
Noise dominated data is calculated using 1-second bins in cleaned event files. If a bin has >2000 counts, and if more than 50% of those come from <1% of pixels, then it is considered to be noise-dominated and hence unusable.
| Quadrant | # 1 sec bins | Bins with >0 counts | Bins with >2000 counts | High rate bins dominated by noise | Noise dominated (total time) | Noise dominated (detector-on time) | Marked lightcurve |
|---|---|---|---|---|---|---|---|
| A | 7305 | 5151 | 45 | 45 | 0.62% | 0.87% |  |
| B | 7305 | 5151 | 7 | 7 | 0.10% | 0.14% |  |
| C | 7305 | 5151 | 16 | 16 | 0.22% | 0.31% | 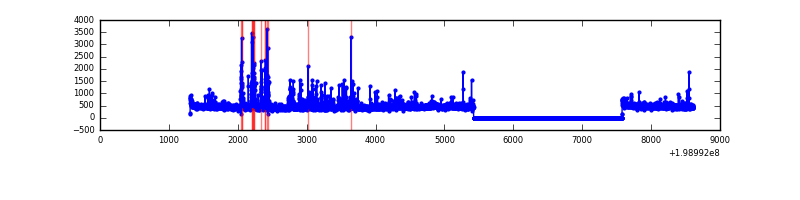 |
| D | 7305 | 5151 | 51 | 51 | 0.70% | 0.99% |  |
Top three noisy pixels from each quadrant. If the there are fewer than three noisy pixels in the level2.evt file, extra rows are filled as -1
| Pixel properties | Quadrant properties | ||||||
|---|---|---|---|---|---|---|---|
| Quadrant | DetID | PixID | Counts | Sigma | Mean | Median | Sigma |
| A | 8 | 15 | 231593 | 1944.22 | 584 | 574 | 118.8 |
| A | 0 | 5 | 168155 | 1410.34 | 584 | 574 | 118.8 |
| A | 14 | 238 | 45060 | 374.39 | 584 | 574 | 118.8 |
| B | 0 | 230 | 152945 | 1344.83 | 594 | 582 | 113.3 |
| B | 15 | 204 | 122401 | 1075.23 | 594 | 582 | 113.3 |
| B | 0 | 219 | 54318 | 474.3 | 594 | 582 | 113.3 |
| C | 14 | 223 | 258320 | 1958.08 | 562 | 565 | 131.6 |
| C | 1 | 16 | 30401 | 226.65 | 562 | 565 | 131.6 |
| C | 15 | 208 | 28744 | 214.07 | 562 | 565 | 131.6 |
| D | 2 | 152 | 112654 | 777.81 | 556 | 541 | 144.1 |
| D | 7 | 80 | 94603 | 652.58 | 556 | 541 | 144.1 |
| D | 1 | 20 | 91559 | 631.46 | 556 | 541 | 144.1 |
Histogram calculated using DETX and DETY for each event in the final _common_clean file
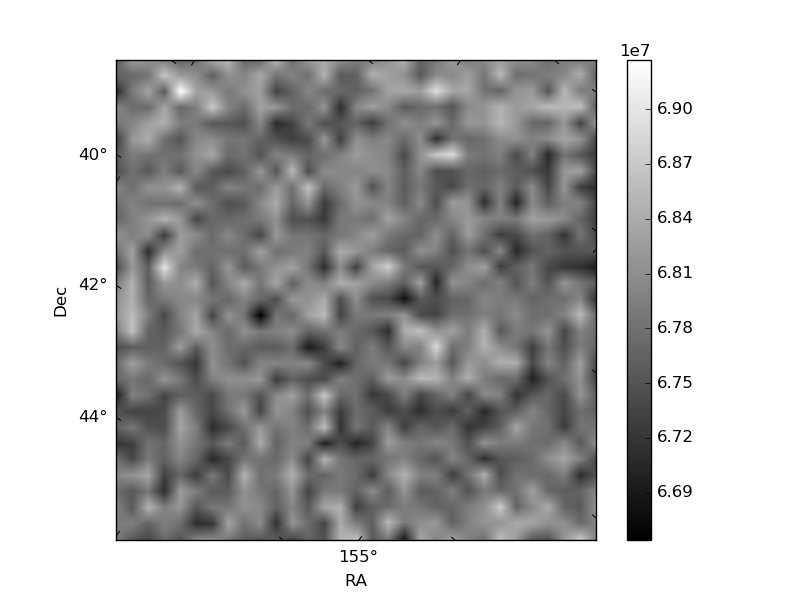
| Quadrant A | 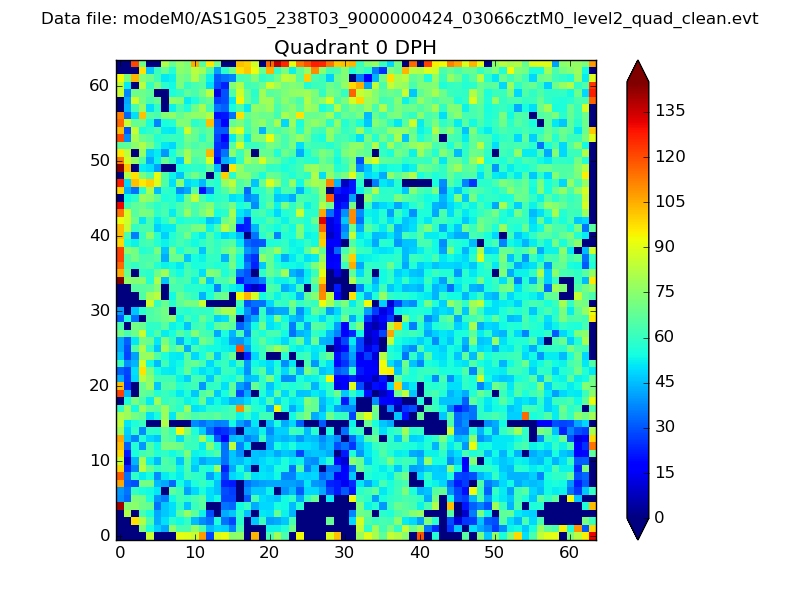 |
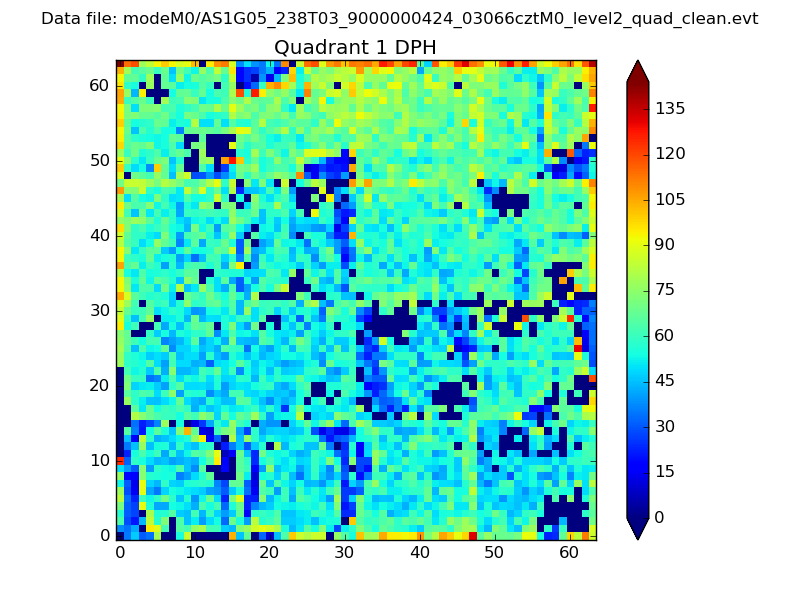 |
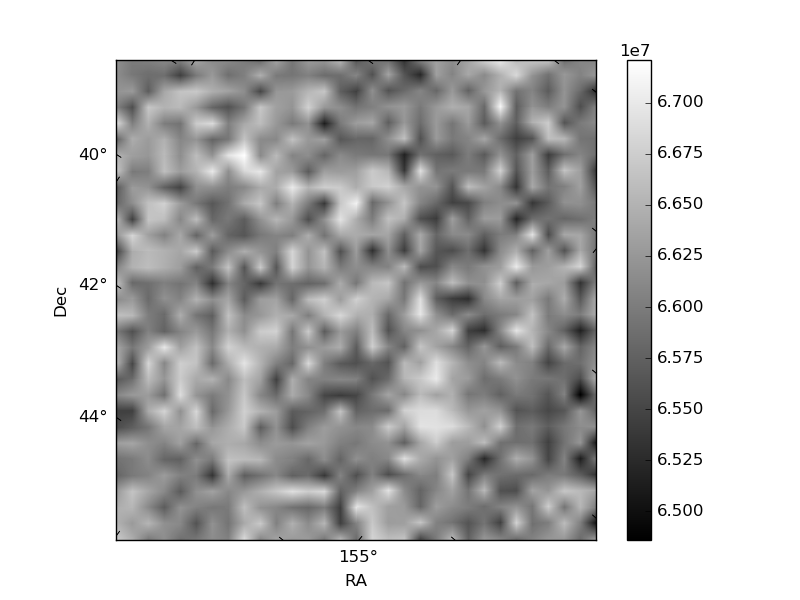
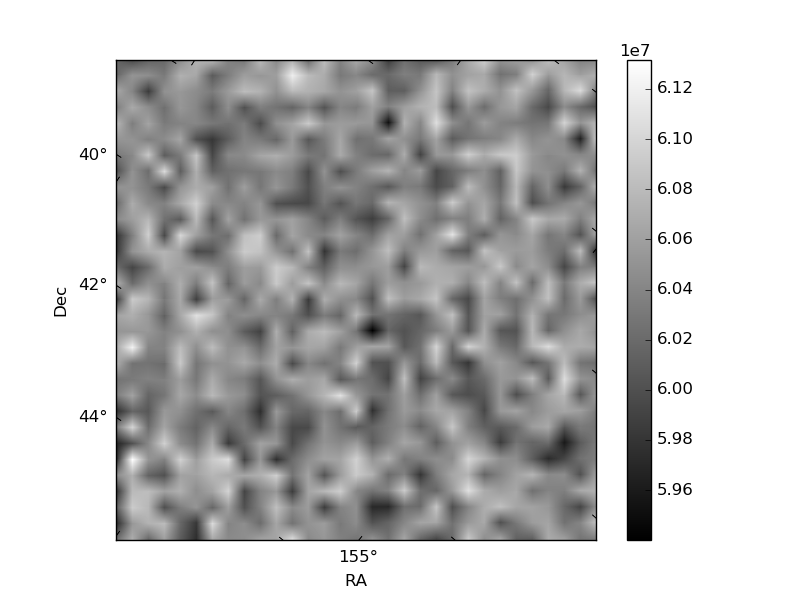
Quadrant B |
|---|---|---|---|
| Quadrant D | 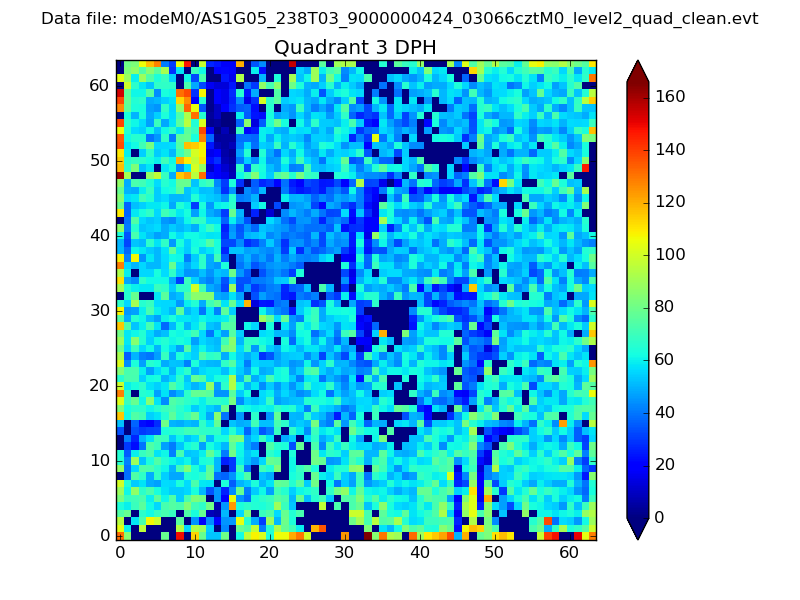 |
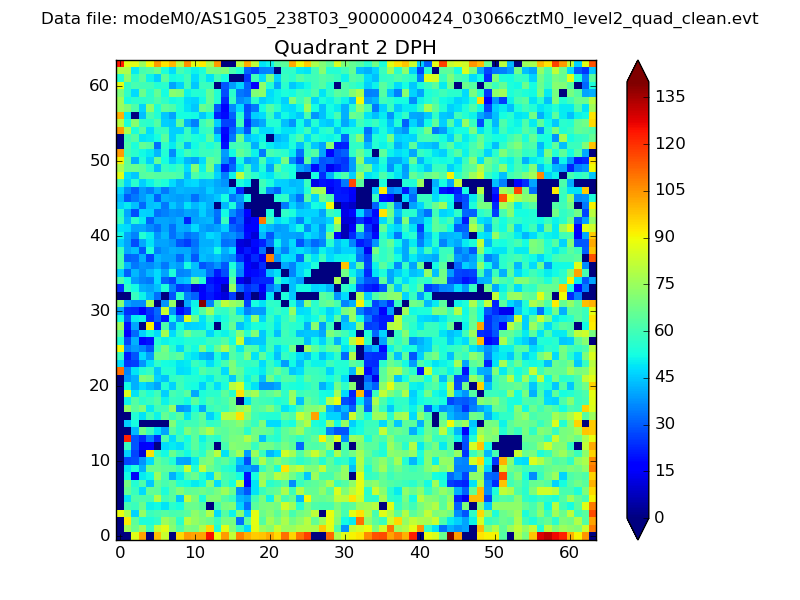 |
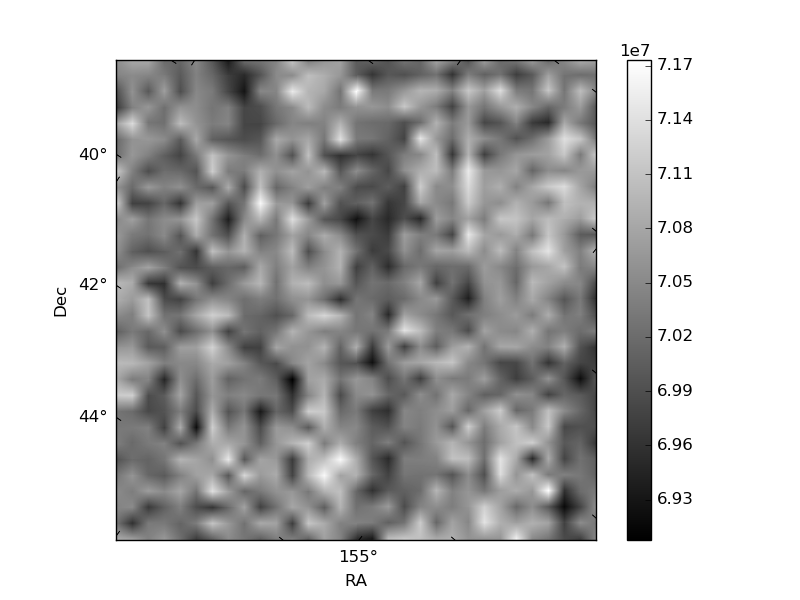
Quadrant C |
| Plot type | Count rate plots | Images |
|---|---|---|
| Comparison with Poisson distribution Blue bars denote a histogram of data divided into 1 sec bins. Red curve is a Poisson curve with rate = median count rate of data. |
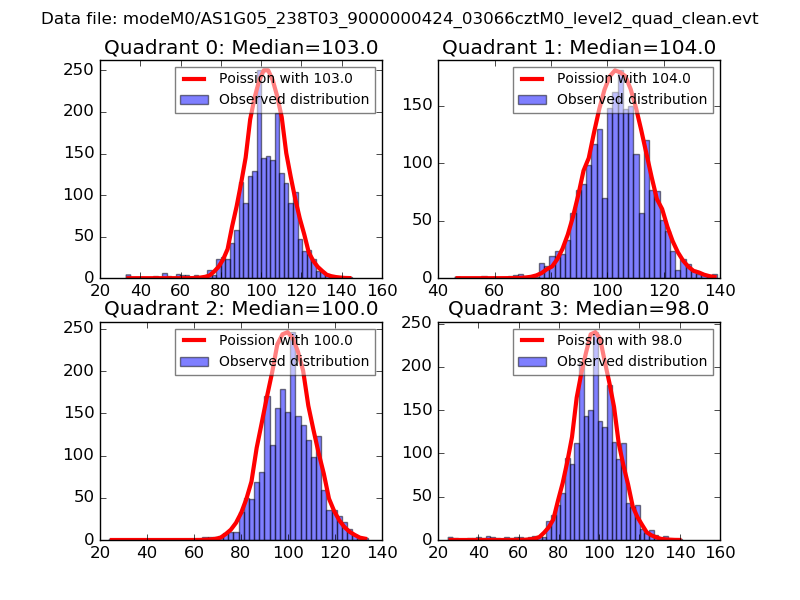 |
 |
| Quadrant-wise count rates Data is divided into 100 sec bins |
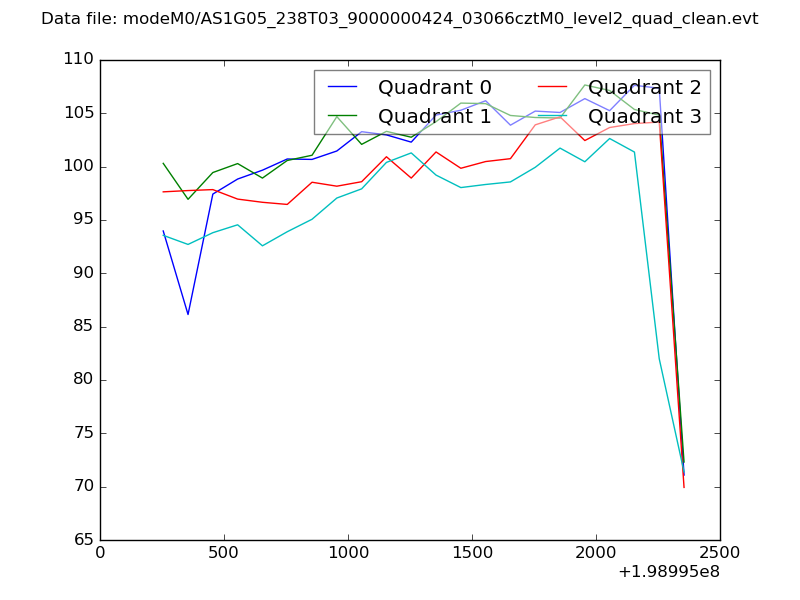 |
|
| Module-wise count rates for Quadrant A Data is divided into 100 sec bins |
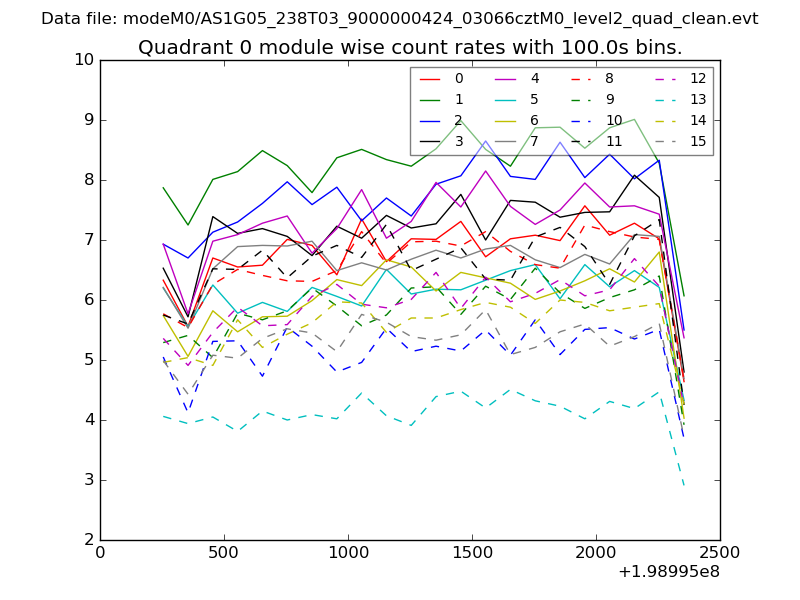 |
 |
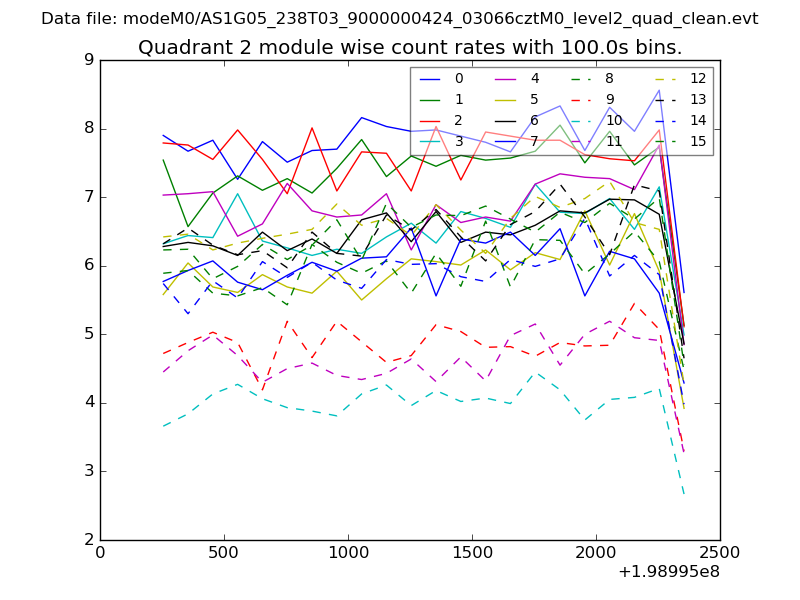
| Module-wise count rates for Quadrant B Data is divided into 100 sec bins |
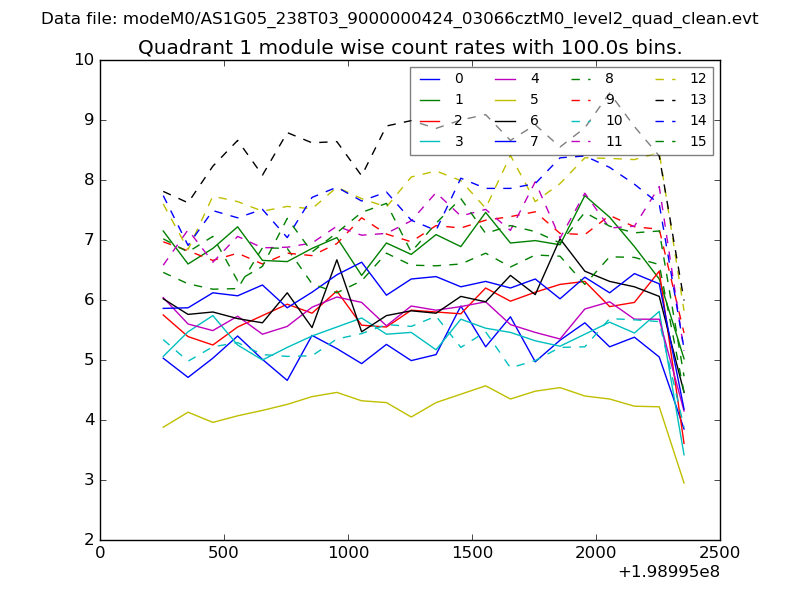 |
 |
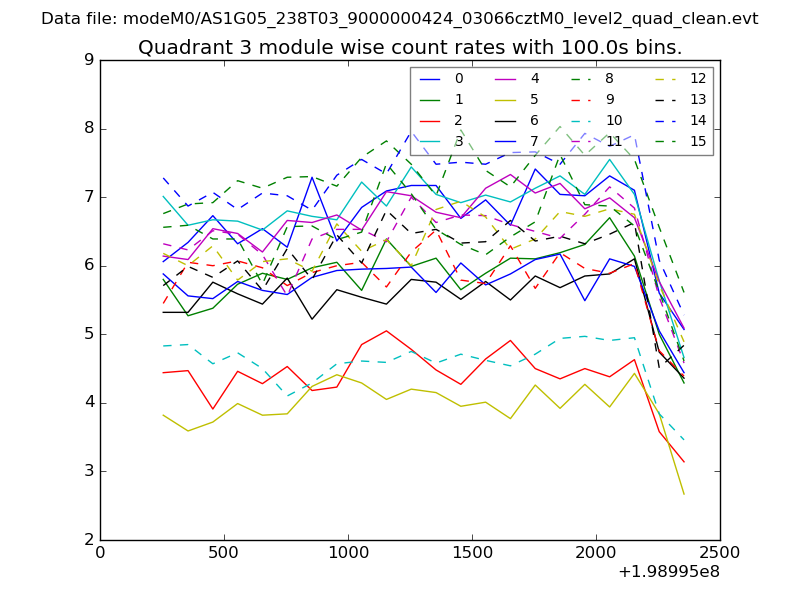
| Module-wise count rates for Quadrant C Data is divided into 100 sec bins |
 |
 |
| Module-wise count rates for Quadrant D Data is divided into 100 sec bins |
 |
 |
| Parameter | Plot |
|---|---|
| CZT HV Monitor | 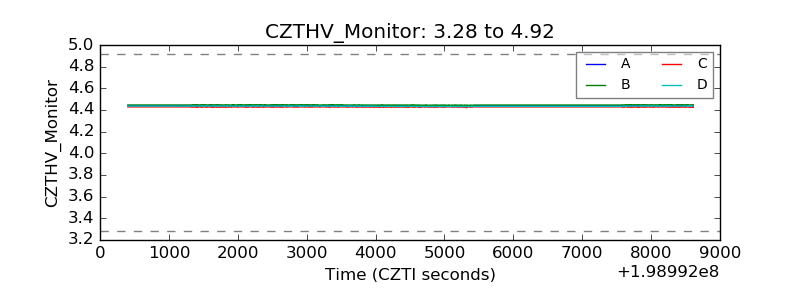 |
| D_VDD | 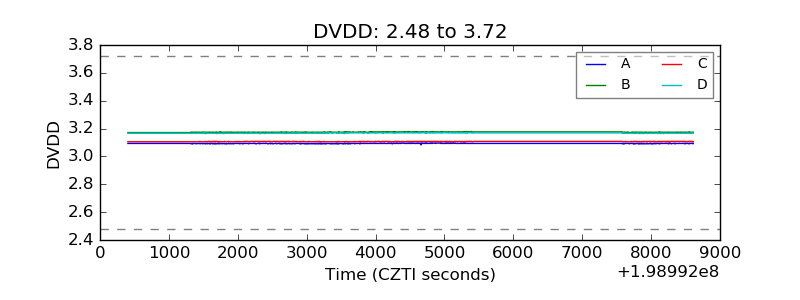 |
| Temperature 1 | 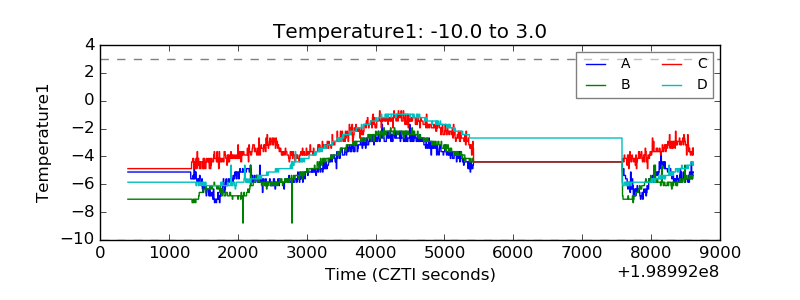 |
| Veto HV Monitor | 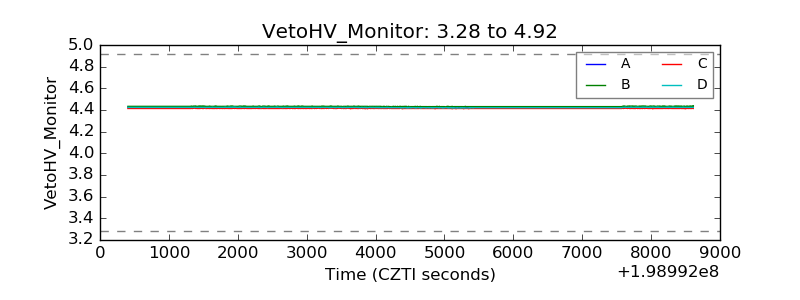 |
| Veto LLD | 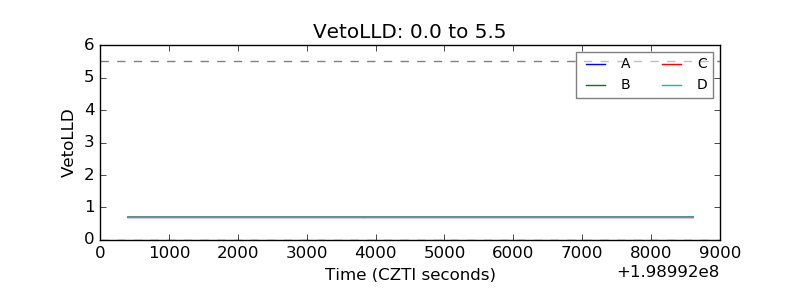 |
| Alpha Counter | 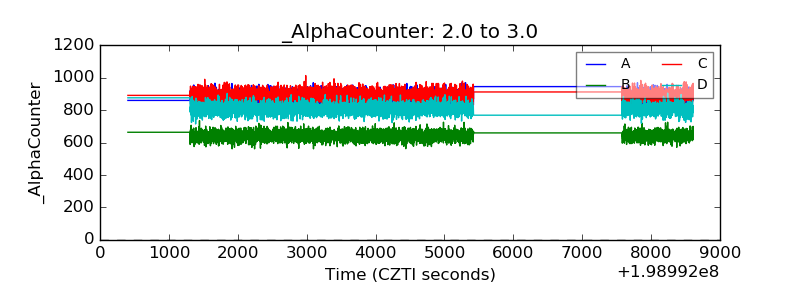 |
| _CPM_Rate | 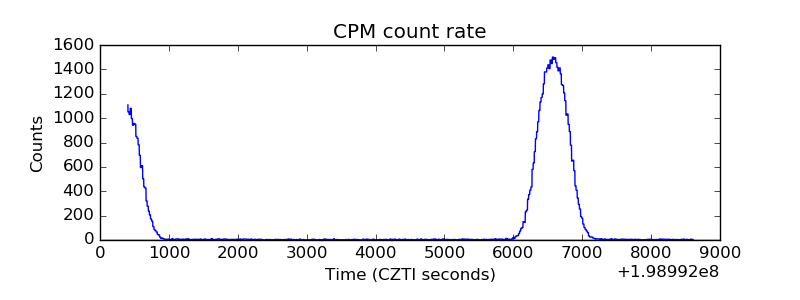 |
| CZT Counter | 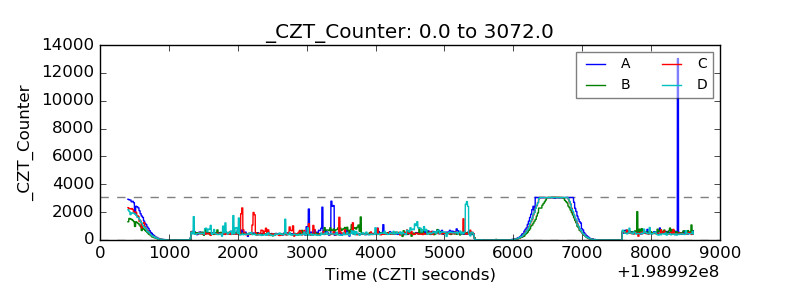 |
| +2.5 Volts monitor |  |
| +5 Volts monitor | 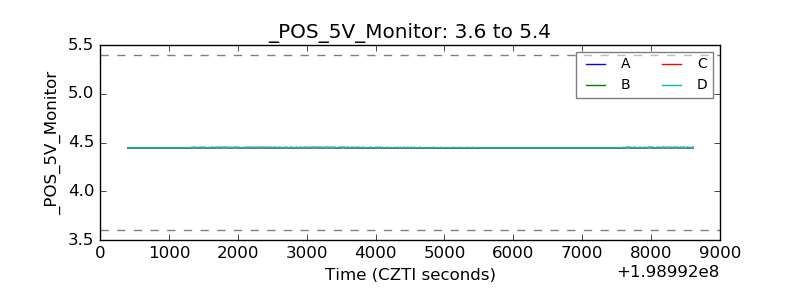 |
| _ROLL_ROT | 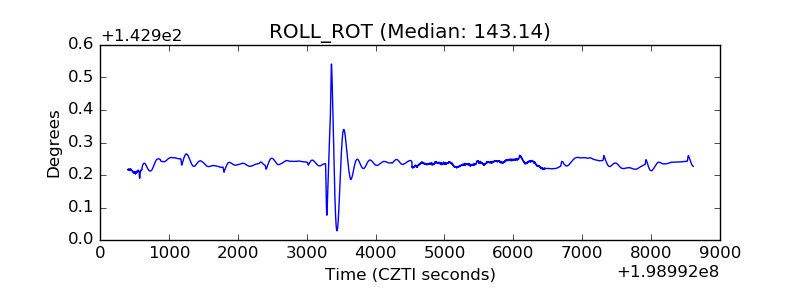 |
| _Roll_DEC | 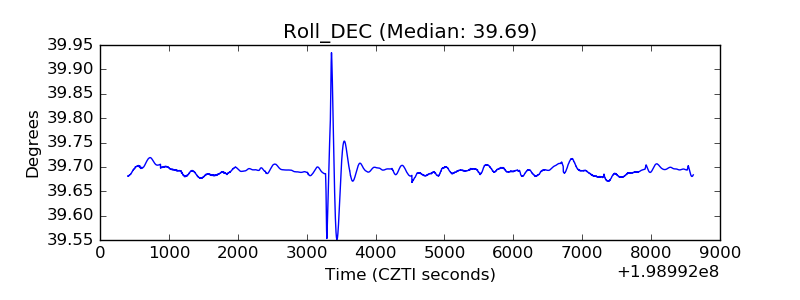 |
| _Roll_RA | 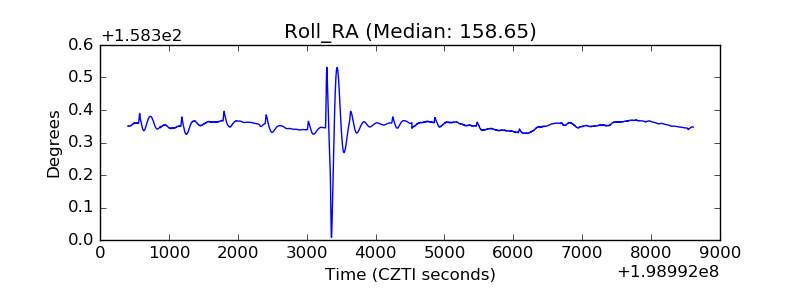 |
| Veto Counter | 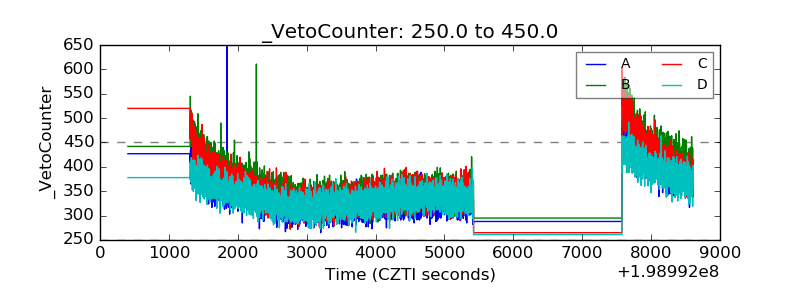 |