| Param | Original file | Final file |
|---|---|---|
| Filename | modeM0/AS1G05_238T03_9000000424_03067cztM0_level2.evt | modeM0/AS1G05_238T03_9000000424_03067cztM0_level2_quad_clean.evt |
| Size (bytes) | 389,612,160 | 47,252,160 |
| Size | 371.6 MB | 45.1 MB |
| Events in quadrant A | 2,841,133 | 279,601 |
| Events in quadrant B | 3,883,873 | 272,837 |
| Events in quadrant C | 2,257,749 | 272,639 |
| Events in quadrant D | 2,484,737 | 262,592 |
| Mode M0 | |||
|---|---|---|---|
| Quadrant | BADHDUFLAG | Total packets | Discarded packets |
| A | 0 | 11625 | 3 |
| B | 0 | 14805 | 2 |
| C | 0 | 9954 | 2 |
| D | 0 | 10672 | 2 |
| Mode M9 | |||
|---|---|---|---|
| Quadrant | BADHDUFLAG | Total packets | Discarded packets |
| A | 0 | 26 | 0 |
| B | 0 | 26 | 0 |
| C | 0 | 26 | 0 |
| D | 0 | 27 | 0 |
| Mode SS | |||
|---|---|---|---|
| Quadrant | BADHDUFLAG | Total packets | Discarded packets |
| A | 0 | 100 | 0 |
| B | 0 | 100 | 0 |
| C | 0 | 100 | 0 |
| D | 0 | 100 | 0 |
| Quadrant | Total seconds | Saturated seconds | Saturation percentage |
|---|---|---|---|
| A | 4883 | 4 | 0.081917% |
| B | 4883 | 102 | 2.088880% |
| C | 4883 | 5 | 0.102396% |
| D | 4883 | 31 | 0.634856% |
Noise dominated data is calculated using 1-second bins in cleaned event files. If a bin has >2000 counts, and if more than 50% of those come from <1% of pixels, then it is considered to be noise-dominated and hence unusable.
| Quadrant | # 1 sec bins | Bins with >0 counts | Bins with >2000 counts | High rate bins dominated by noise | Noise dominated (total time) | Noise dominated (detector-on time) | Marked lightcurve |
|---|---|---|---|---|---|---|---|
| A | 7038 | 4884 | 0 | 0 | 0.00% | 0.00% | 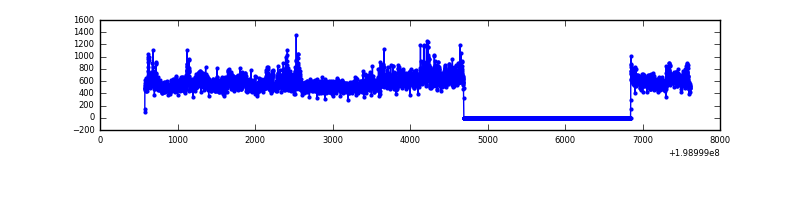 |
| B | 7038 | 4884 | 65 | 65 | 0.92% | 1.33% | 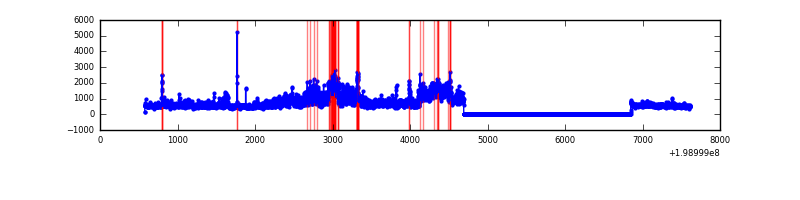 |
| C | 7038 | 4884 | 1 | 1 | 0.01% | 0.02% | 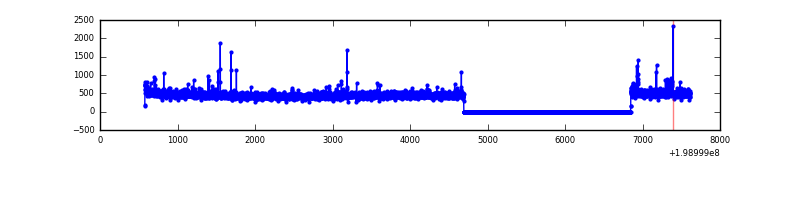 |
| D | 7038 | 4884 | 28 | 28 | 0.40% | 0.57% |  |
Top three noisy pixels from each quadrant. If the there are fewer than three noisy pixels in the level2.evt file, extra rows are filled as -1
| Pixel properties | Quadrant properties | ||||||
|---|---|---|---|---|---|---|---|
| Quadrant | DetID | PixID | Counts | Sigma | Mean | Median | Sigma |
| A | 8 | 15 | 515564 | 4456.1 | 577 | 566 | 115.6 |
| A | 12 | 189 | 48788 | 417.24 | 577 | 566 | 115.6 |
| A | 14 | 238 | 33761 | 287.22 | 577 | 566 | 115.6 |
| B | 15 | 204 | 1506231 | 13757.25 | 580 | 568 | 109.4 |
| B | 2 | 249 | 30950 | 277.6 | 580 | 568 | 109.4 |
| B | 0 | 219 | 30874 | 276.91 | 580 | 568 | 109.4 |
| C | 1 | 16 | 23983 | 181.94 | 551 | 556 | 128.8 |
| C | 15 | 208 | 22667 | 171.72 | 551 | 556 | 128.8 |
| C | 6 | 80 | 22393 | 169.59 | 551 | 556 | 128.8 |
| D | 12 | 217 | 121270 | 824.72 | 545 | 536 | 146.4 |
| D | 7 | 6 | 75741 | 513.72 | 545 | 536 | 146.4 |
| D | 2 | 152 | 62107 | 420.58 | 545 | 536 | 146.4 |
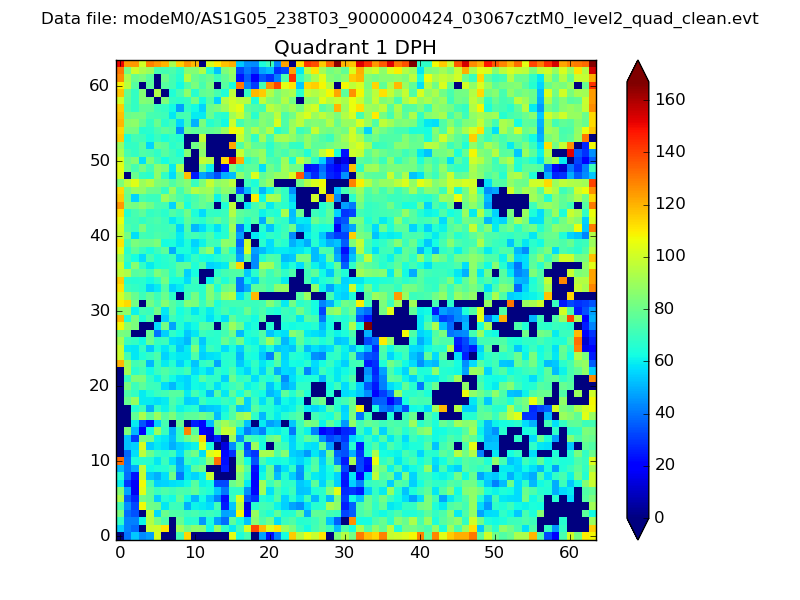
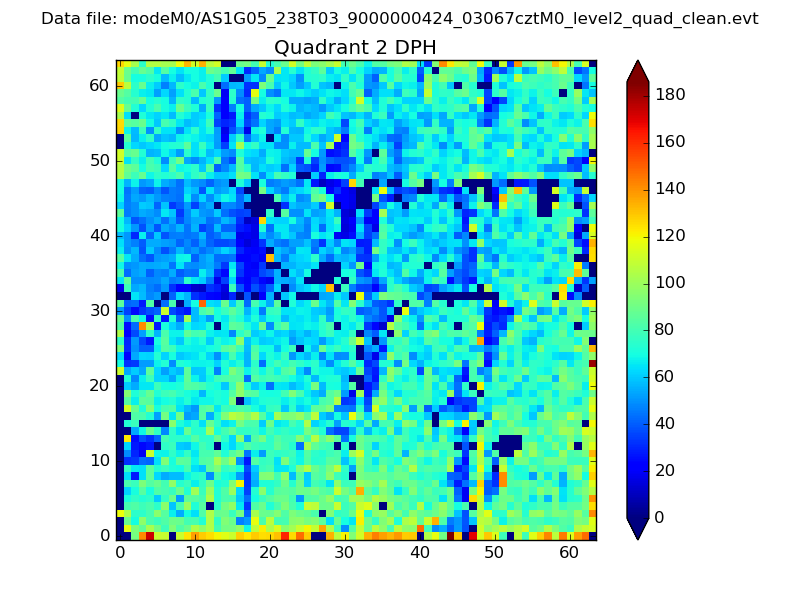
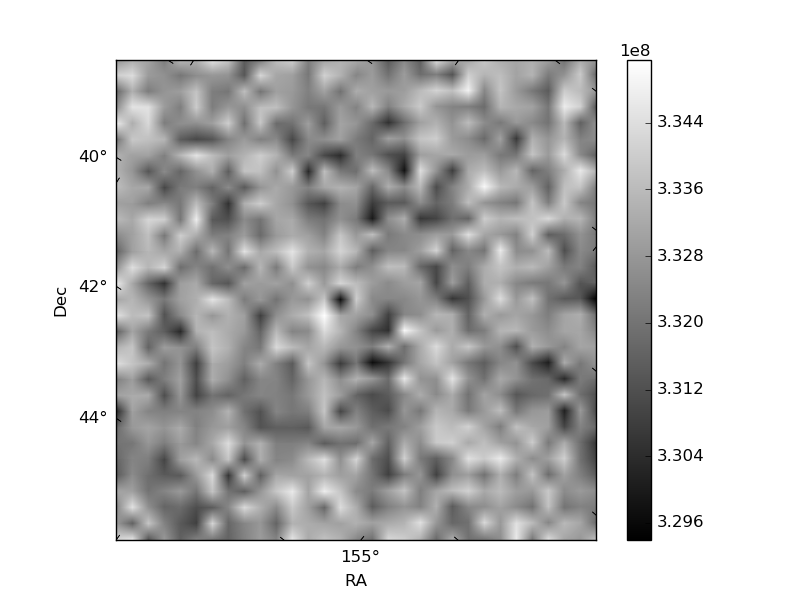
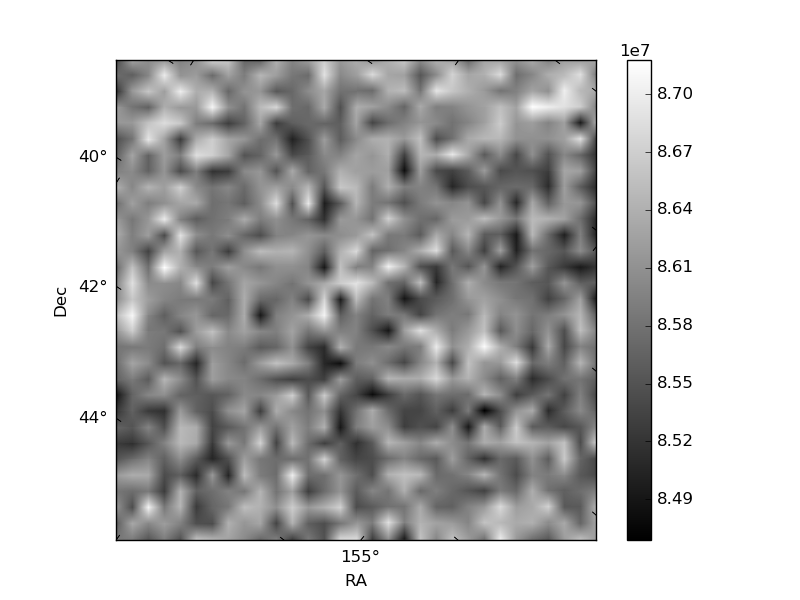
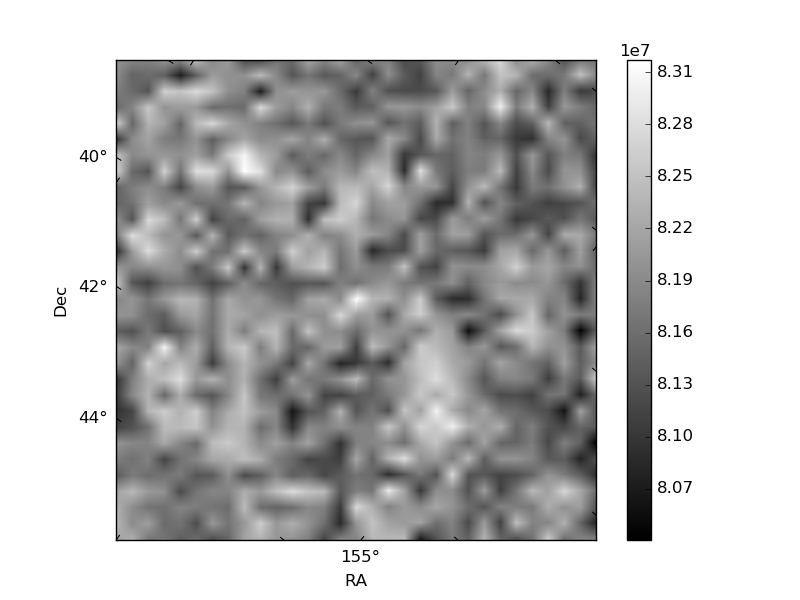
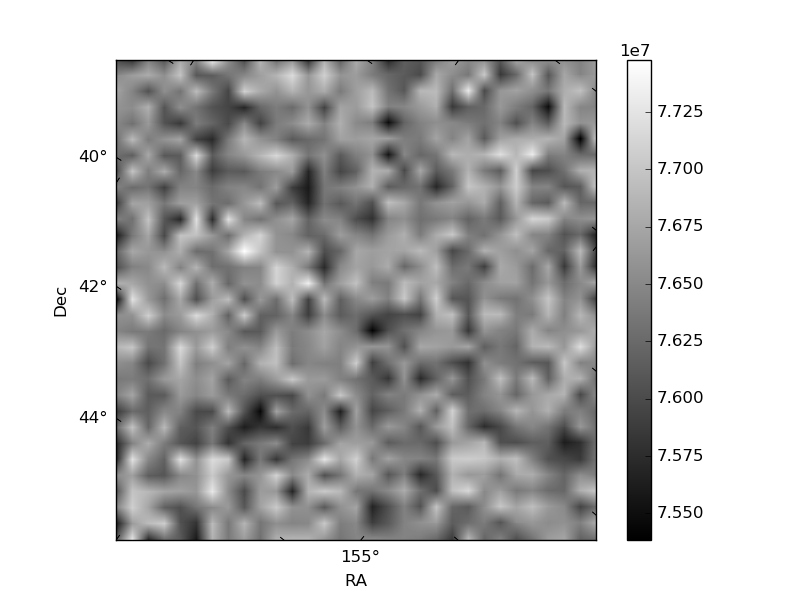
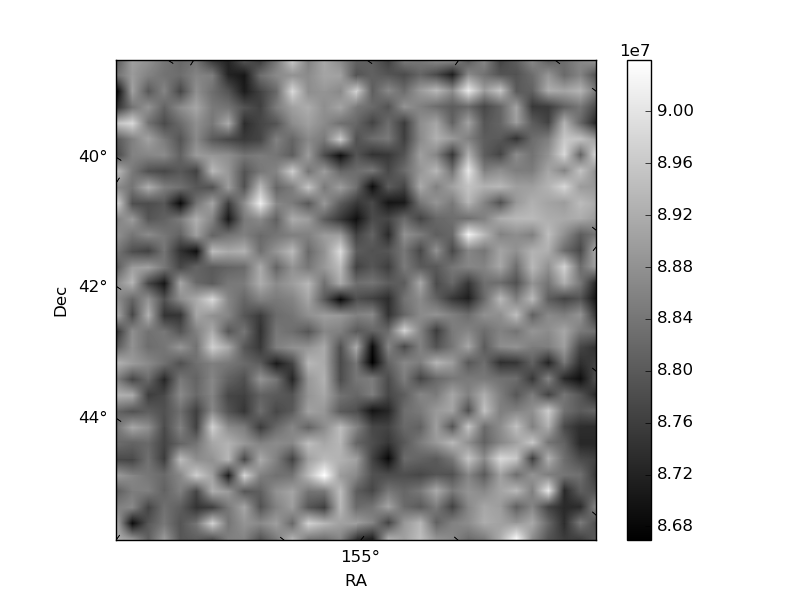
Histogram calculated using DETX and DETY for each event in the final _common_clean file
| Quadrant A | 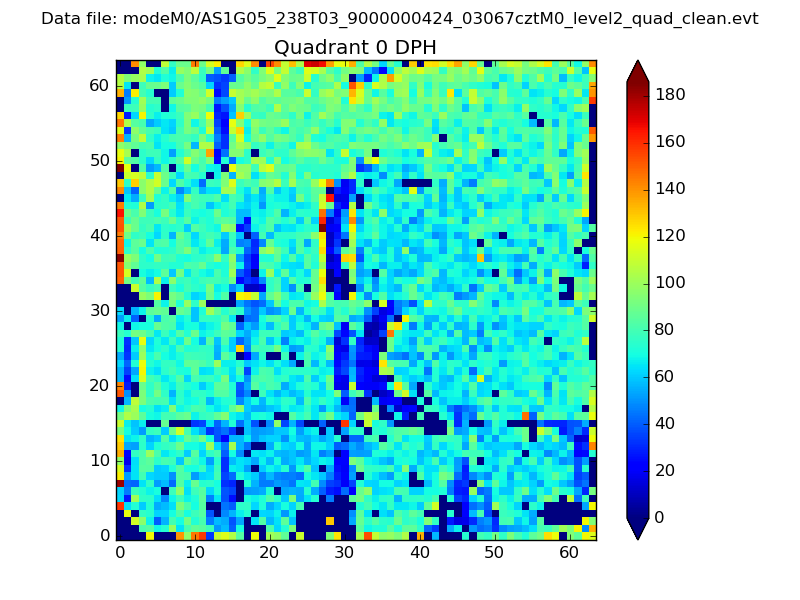 |
 |
Quadrant B |
|---|---|---|---|
| Quadrant D | 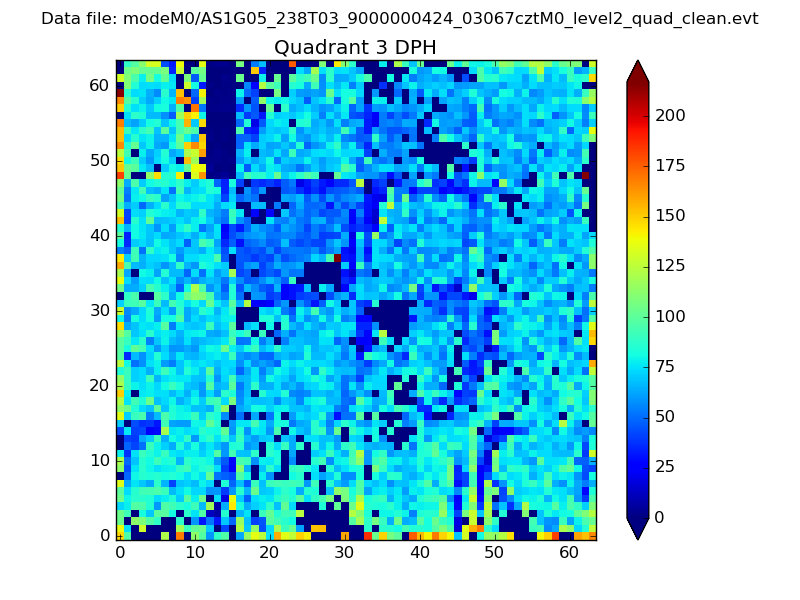 |
 |
Quadrant C |
| Plot type | Count rate plots | Images |
|---|---|---|
| Comparison with Poisson distribution Blue bars denote a histogram of data divided into 1 sec bins. Red curve is a Poisson curve with rate = median count rate of data. |
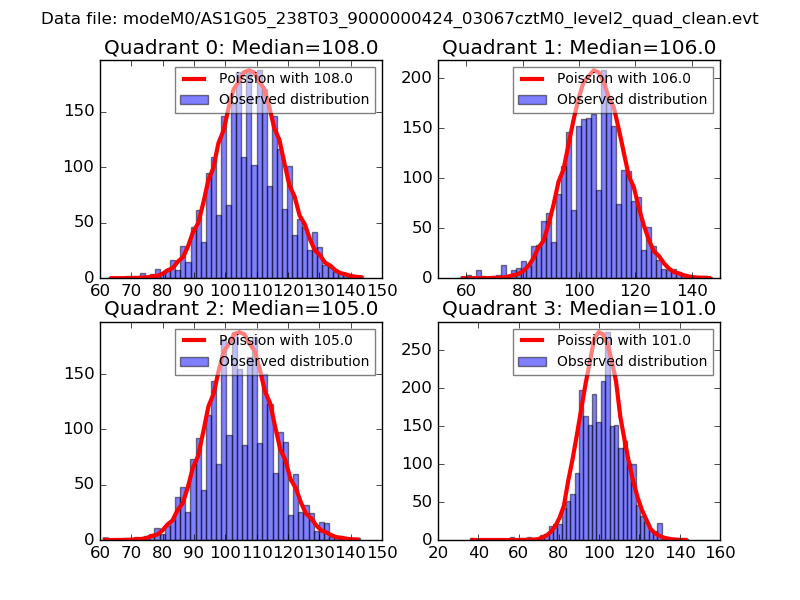 |
 |
| Quadrant-wise count rates Data is divided into 100 sec bins |
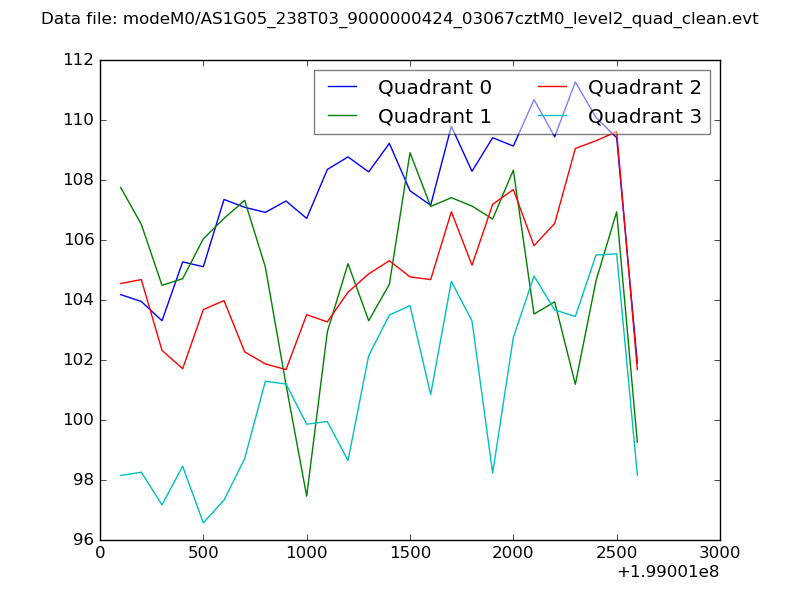 |
|
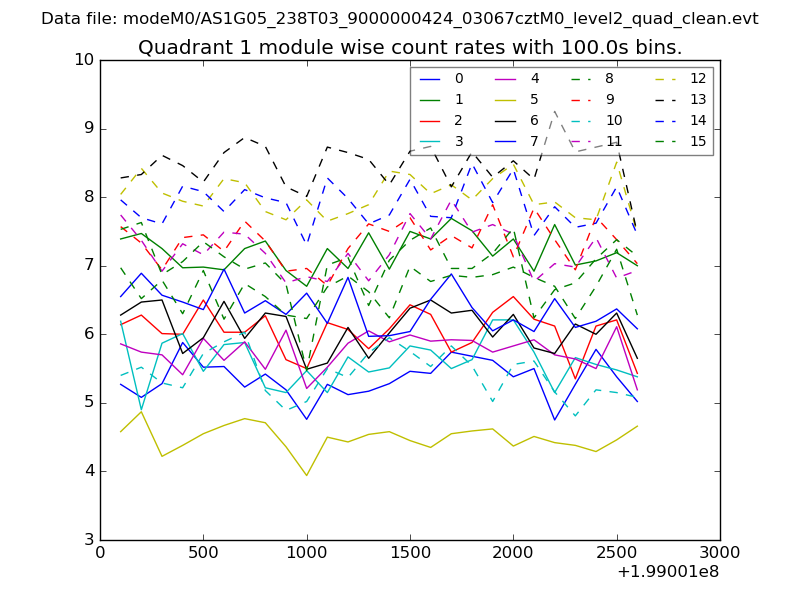
| Module-wise count rates for Quadrant A Data is divided into 100 sec bins |
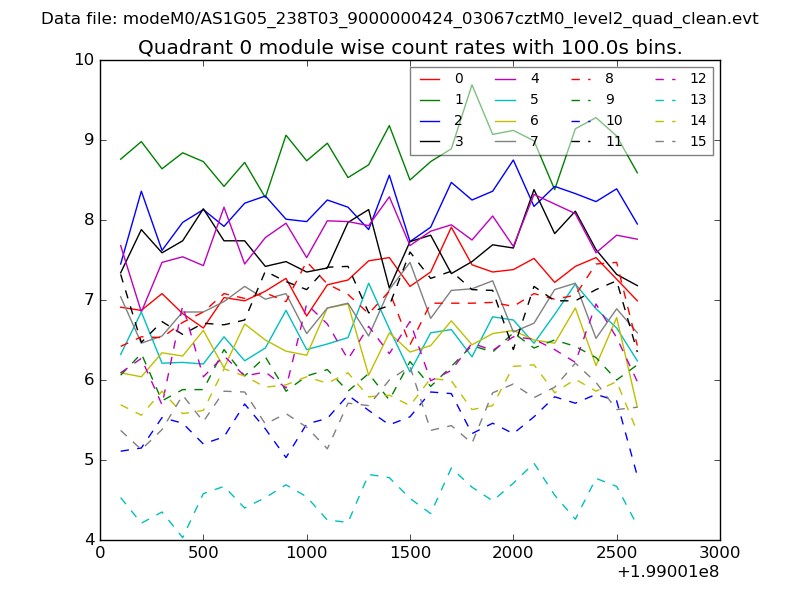 |
 |
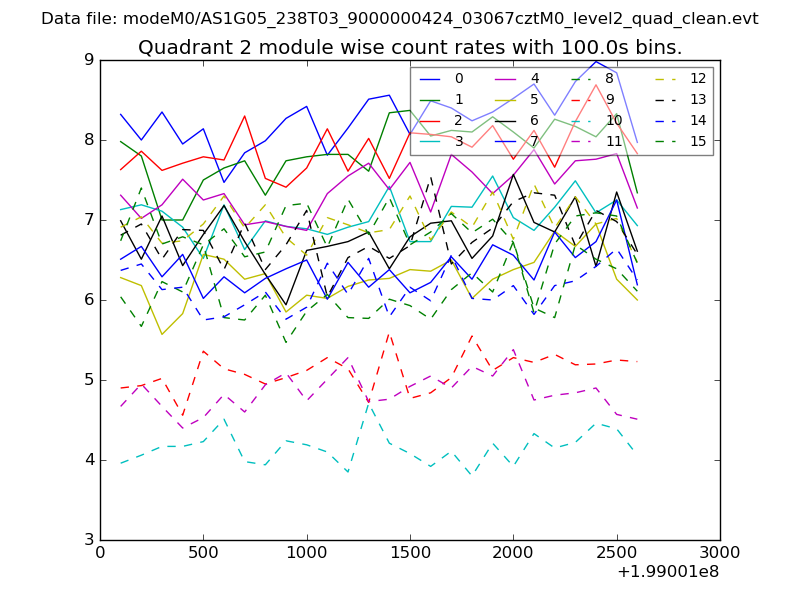
| Module-wise count rates for Quadrant B Data is divided into 100 sec bins |
 |
 |
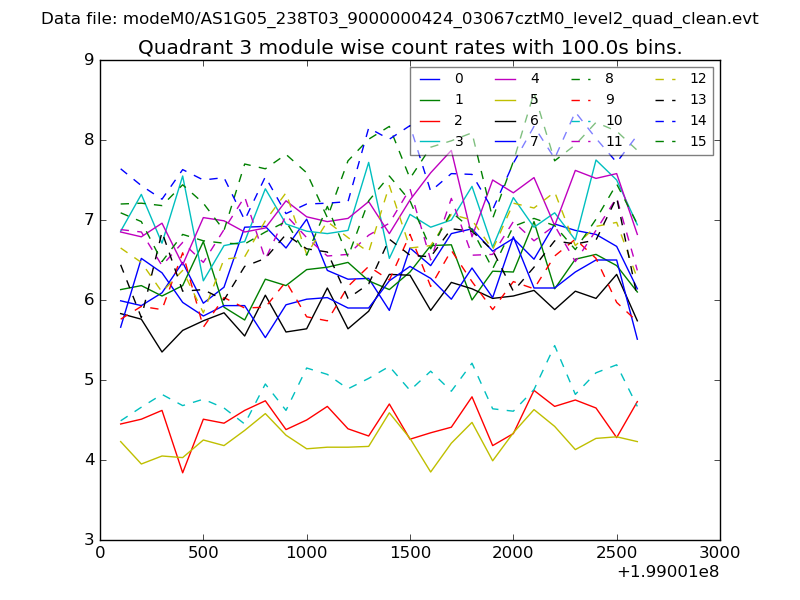
| Module-wise count rates for Quadrant C Data is divided into 100 sec bins |
 |
 |
| Module-wise count rates for Quadrant D Data is divided into 100 sec bins |
 |
 |
| Parameter | Plot |
|---|---|
| CZT HV Monitor | 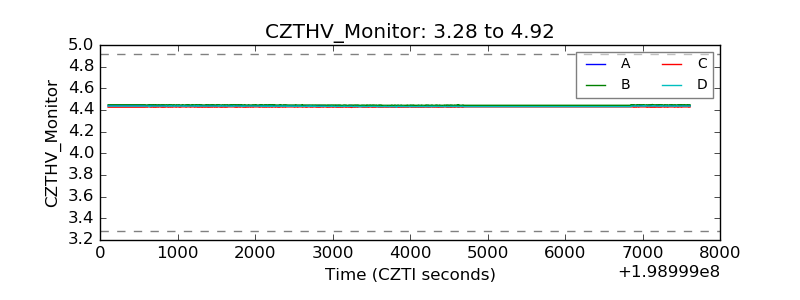 |
| D_VDD | 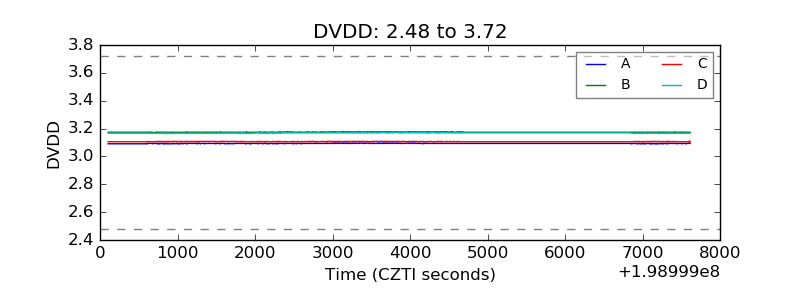 |
| Temperature 1 | 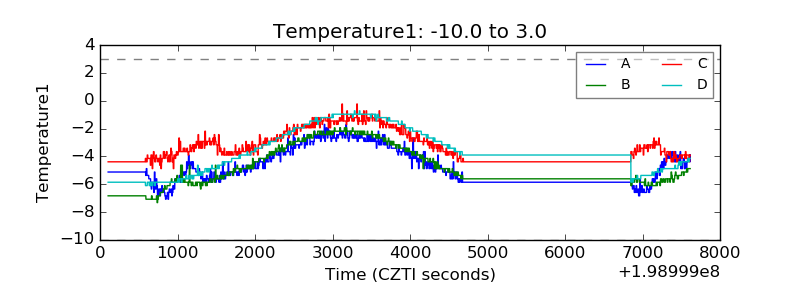 |
| Veto HV Monitor | 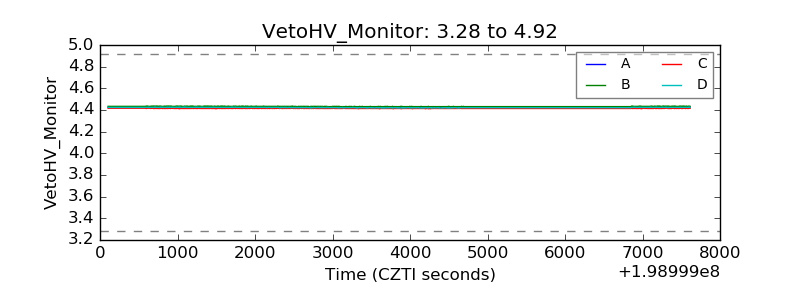 |
| Veto LLD |  |
| Alpha Counter | 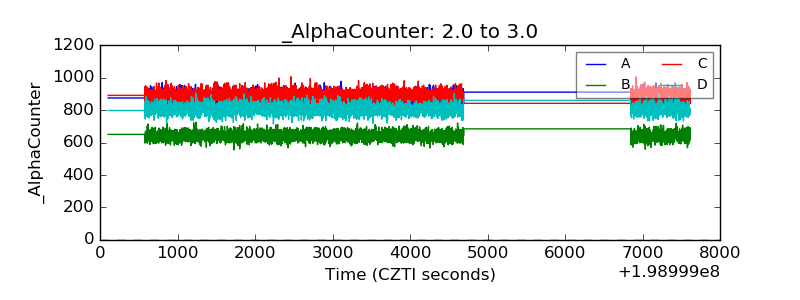 |
| _CPM_Rate | 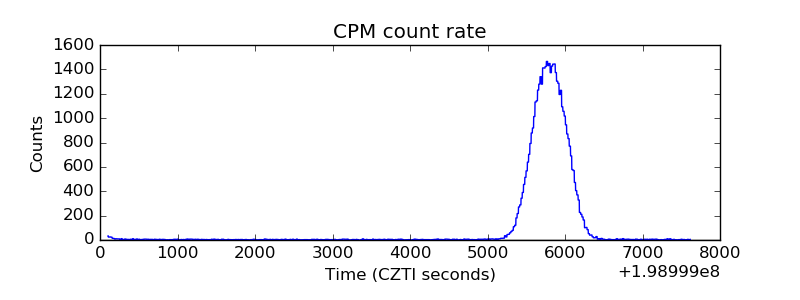 |
| CZT Counter | 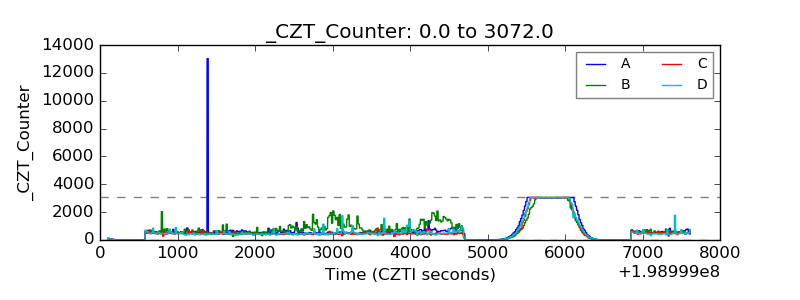 |
| +2.5 Volts monitor |  |
| +5 Volts monitor |  |
| _ROLL_ROT | 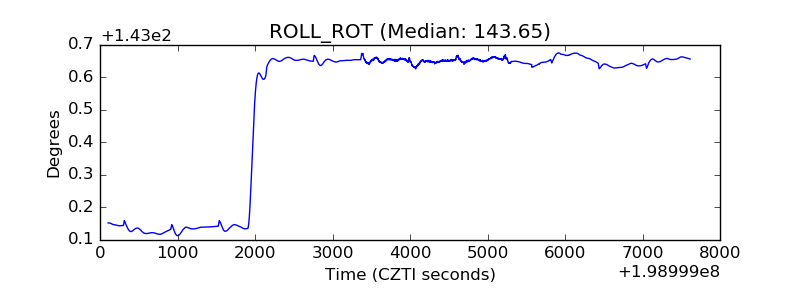 |
| _Roll_DEC | 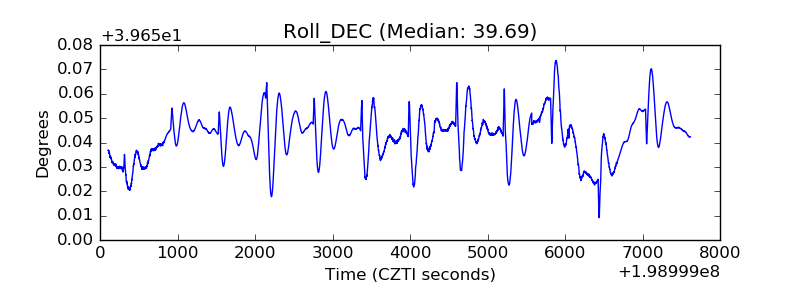 |
| _Roll_RA | 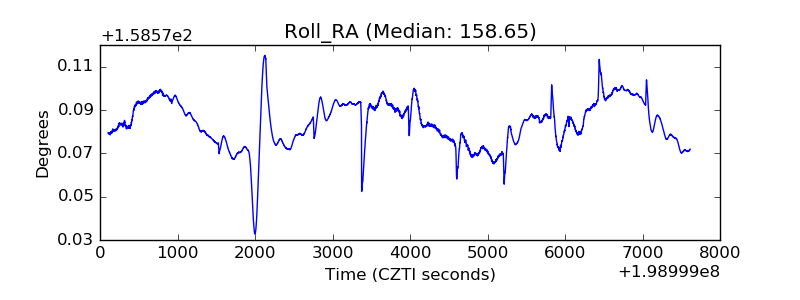 |
| Veto Counter | 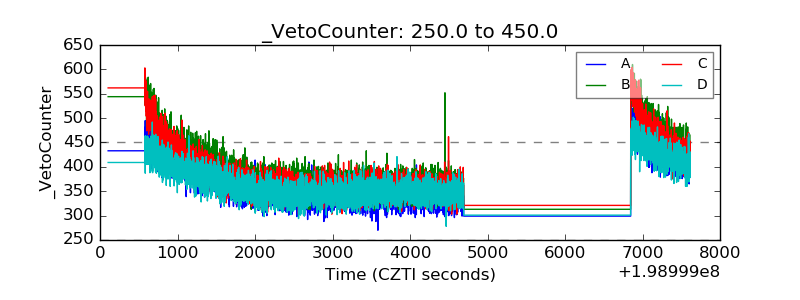 |