| Param | Original file | Final file |
|---|---|---|
| Filename | modeM0/AS1G05_238T03_9000000424_03070cztM0_level2.evt | modeM0/AS1G05_238T03_9000000424_03070cztM0_level2_quad_clean.evt |
| Size (bytes) | 358,920,000 | 80,568,000 |
| Size | 342.3 MB | 76.8 MB |
| Events in quadrant A | 2,425,207 | 528,271 |
| Events in quadrant B | 2,639,532 | 526,507 |
| Events in quadrant C | 2,796,331 | 511,103 |
| Events in quadrant D | 2,647,531 | 502,422 |
| Mode M0 | |||
|---|---|---|---|
| Quadrant | BADHDUFLAG | Total packets | Discarded packets |
| A | 0 | 10751 | 3 |
| B | 0 | 11236 | 2 |
| C | 0 | 11859 | 2 |
| D | 0 | 11648 | 2 |
| Mode M9 | |||
|---|---|---|---|
| Quadrant | BADHDUFLAG | Total packets | Discarded packets |
| A | 0 | 43 | 0 |
| B | 0 | 43 | 0 |
| C | 0 | 43 | 0 |
| D | 0 | 43 | 0 |
| Mode SS | |||
|---|---|---|---|
| Quadrant | BADHDUFLAG | Total packets | Discarded packets |
| A | 0 | 110 | 0 |
| B | 0 | 110 | 0 |
| C | 0 | 110 | 0 |
| D | 0 | 110 | 0 |
| Quadrant | Total seconds | Saturated seconds | Saturation percentage |
|---|---|---|---|
| A | 5306 | 6 | 0.113080% |
| B | 5306 | 10 | 0.188466% |
| C | 5306 | 46 | 0.866943% |
| D | 5306 | 21 | 0.395778% |
Noise dominated data is calculated using 1-second bins in cleaned event files. If a bin has >2000 counts, and if more than 50% of those come from <1% of pixels, then it is considered to be noise-dominated and hence unusable.
| Quadrant | # 1 sec bins | Bins with >0 counts | Bins with >2000 counts | High rate bins dominated by noise | Noise dominated (total time) | Noise dominated (detector-on time) | Marked lightcurve |
|---|---|---|---|---|---|---|---|
| A | 9616 | 5308 | 2 | 2 | 0.02% | 0.04% | 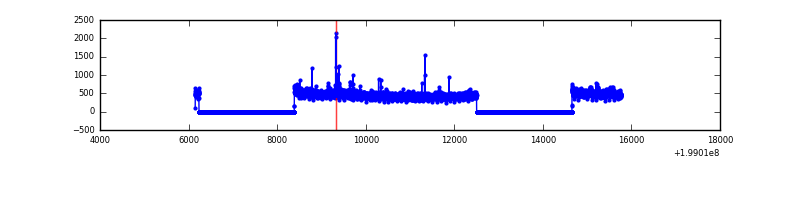 |
| B | 9616 | 5308 | 3 | 3 | 0.03% | 0.06% | 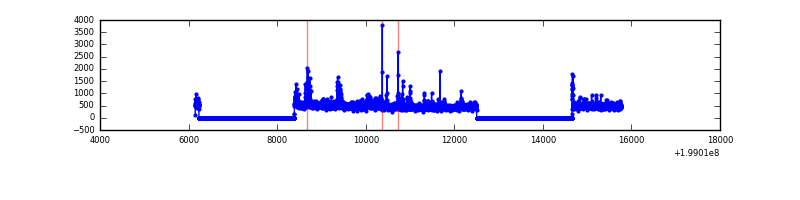 |
| C | 9616 | 5308 | 40 | 40 | 0.42% | 0.75% | 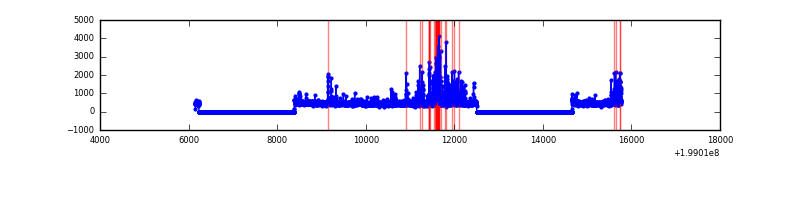 |
| D | 9616 | 5308 | 12 | 12 | 0.12% | 0.23% |  |
Top three noisy pixels from each quadrant. If the there are fewer than three noisy pixels in the level2.evt file, extra rows are filled as -1
| Pixel properties | Quadrant properties | ||||||
|---|---|---|---|---|---|---|---|
| Quadrant | DetID | PixID | Counts | Sigma | Mean | Median | Sigma |
| A | 8 | 15 | 52094 | 423.68 | 600 | 587 | 121.6 |
| A | 14 | 238 | 21677 | 173.48 | 600 | 587 | 121.6 |
| A | 12 | 189 | 9298 | 71.65 | 600 | 587 | 121.6 |
| B | 15 | 204 | 125194 | 1083.36 | 600 | 586 | 115.0 |
| B | 0 | 219 | 72636 | 626.42 | 600 | 586 | 115.0 |
| B | 2 | 249 | 36640 | 313.46 | 600 | 586 | 115.0 |
| C | 14 | 223 | 402537 | 3010.35 | 574 | 578 | 133.5 |
| C | 0 | 219 | 53524 | 396.52 | 574 | 578 | 133.5 |
| C | 15 | 208 | 47380 | 350.51 | 574 | 578 | 133.5 |
| D | 2 | 152 | 147528 | 1053.22 | 579 | 564 | 139.5 |
| D | 2 | 136 | 59442 | 421.95 | 579 | 564 | 139.5 |
| D | 7 | 6 | 55553 | 394.08 | 579 | 564 | 139.5 |
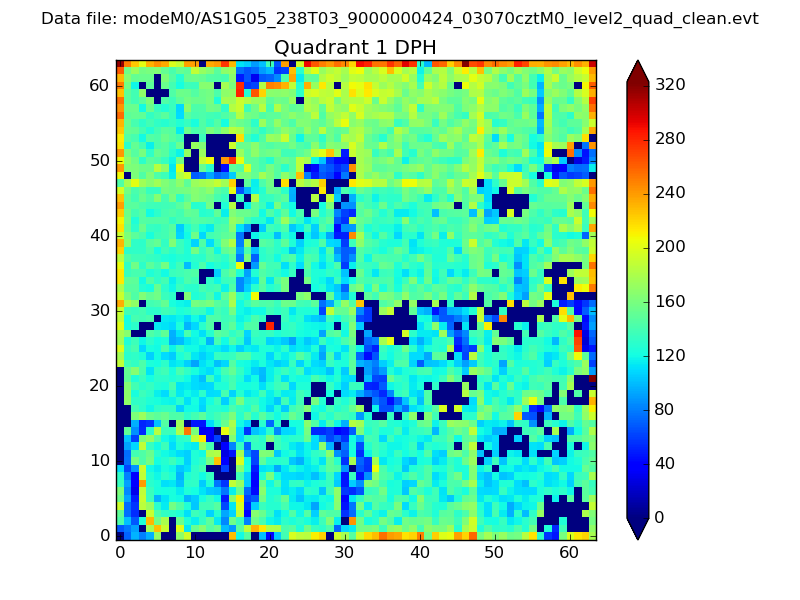
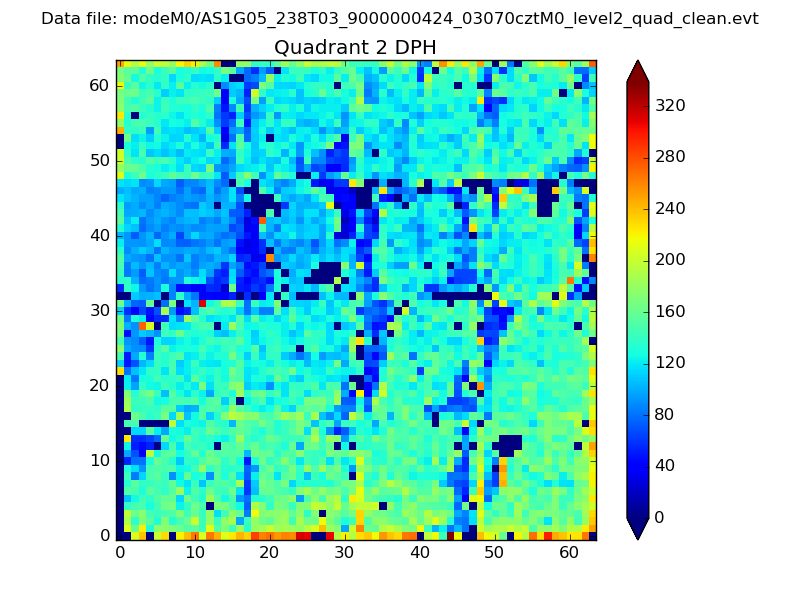
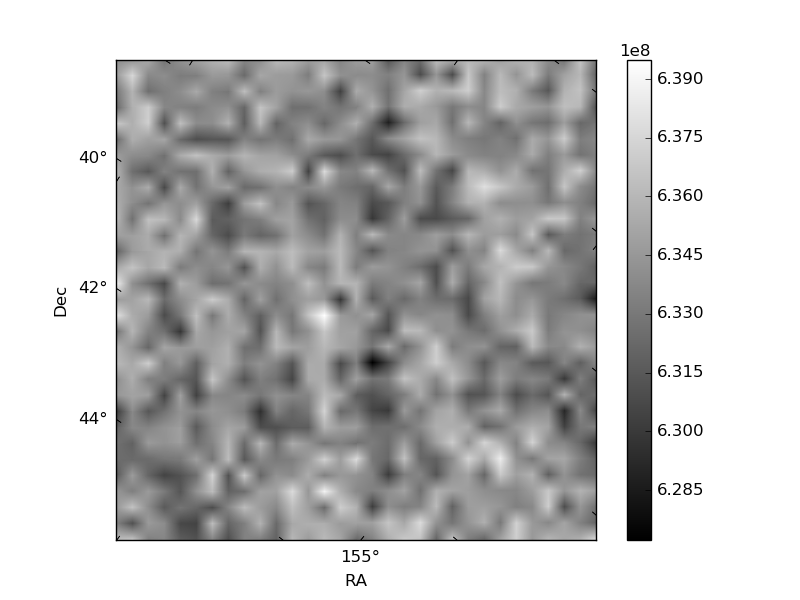
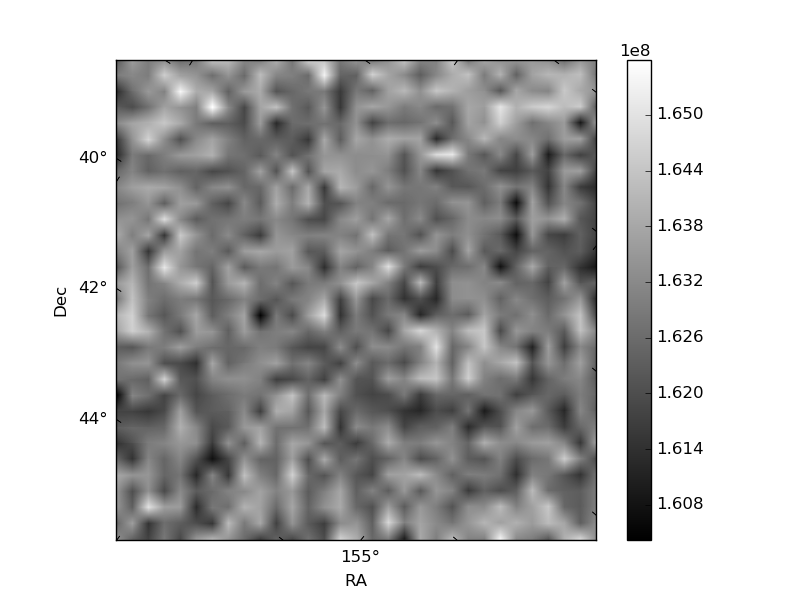
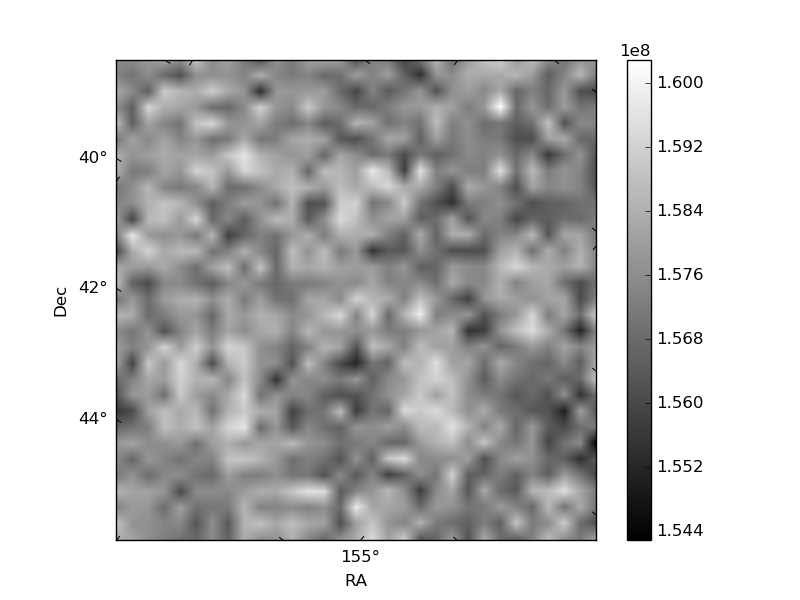
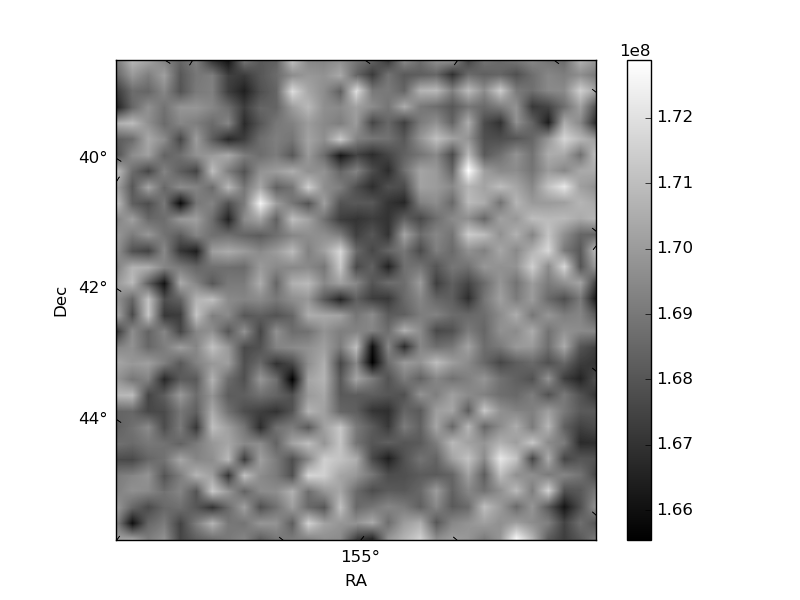
Histogram calculated using DETX and DETY for each event in the final _common_clean file
| Quadrant A | 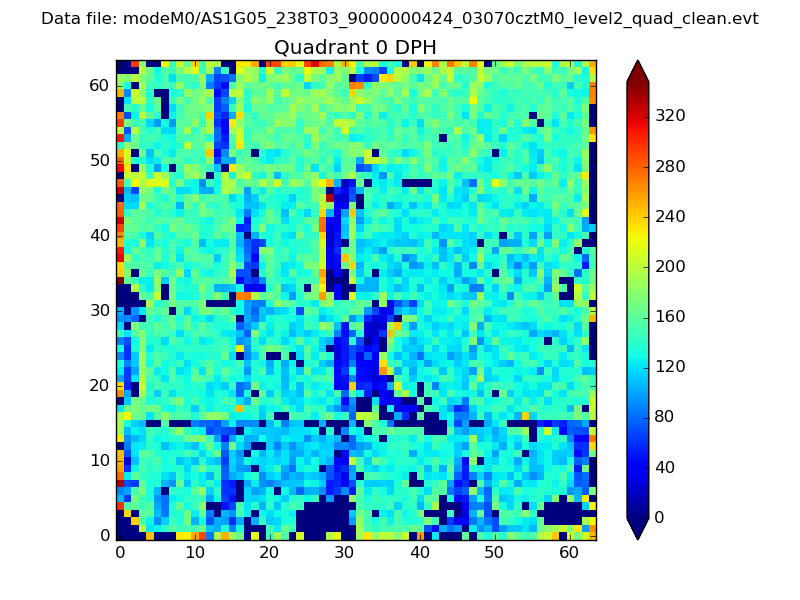 |
 |
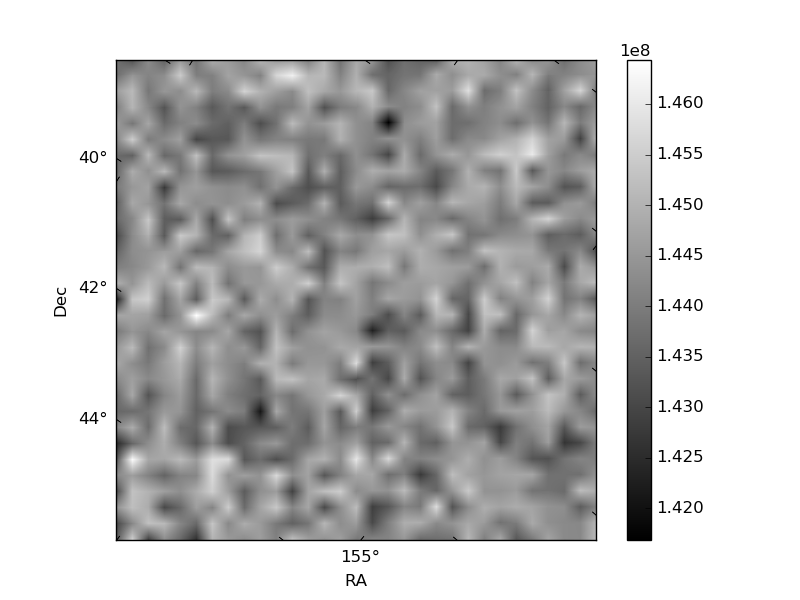
Quadrant B |
|---|---|---|---|
| Quadrant D | 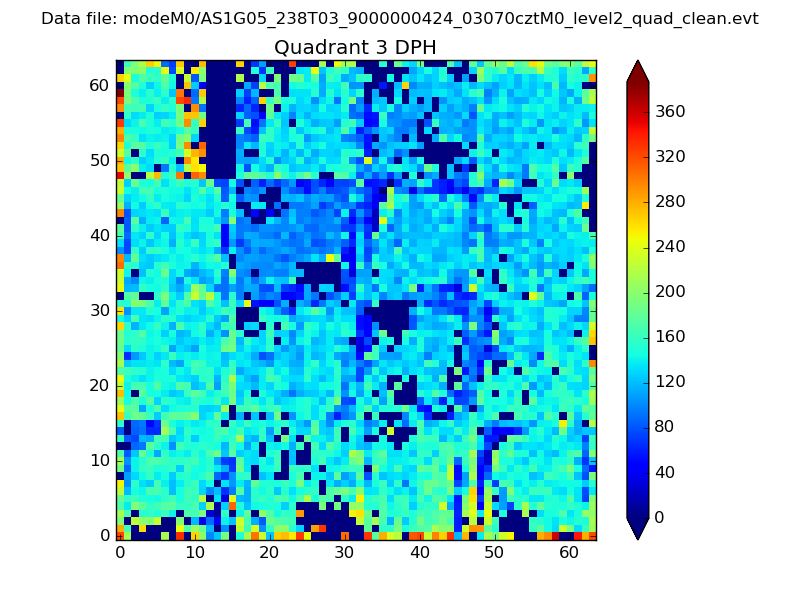 |
 |
Quadrant C |
| Plot type | Count rate plots | Images |
|---|---|---|
| Comparison with Poisson distribution Blue bars denote a histogram of data divided into 1 sec bins. Red curve is a Poisson curve with rate = median count rate of data. |
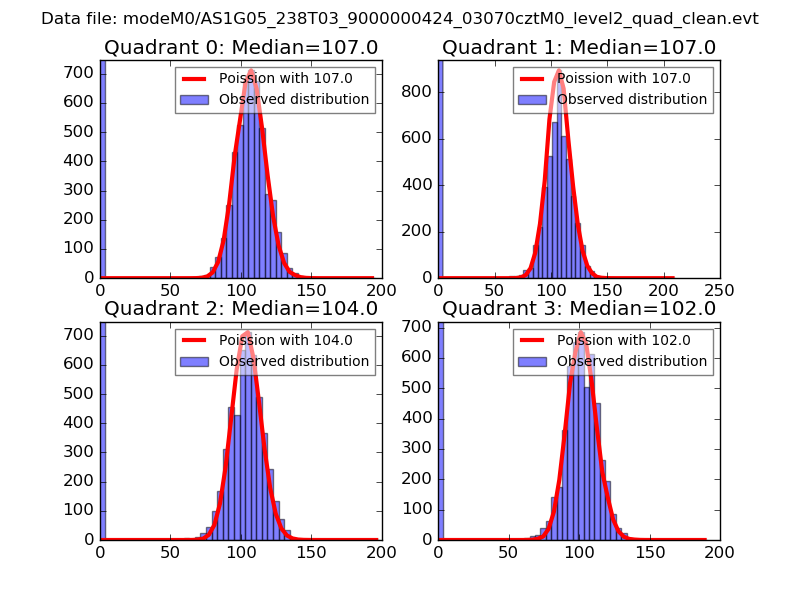 |
 |
| Quadrant-wise count rates Data is divided into 100 sec bins |
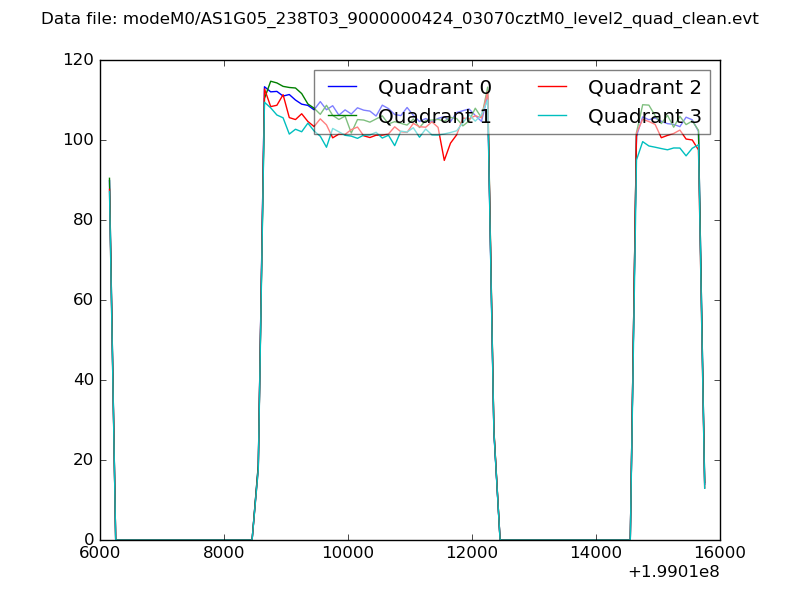 |
|
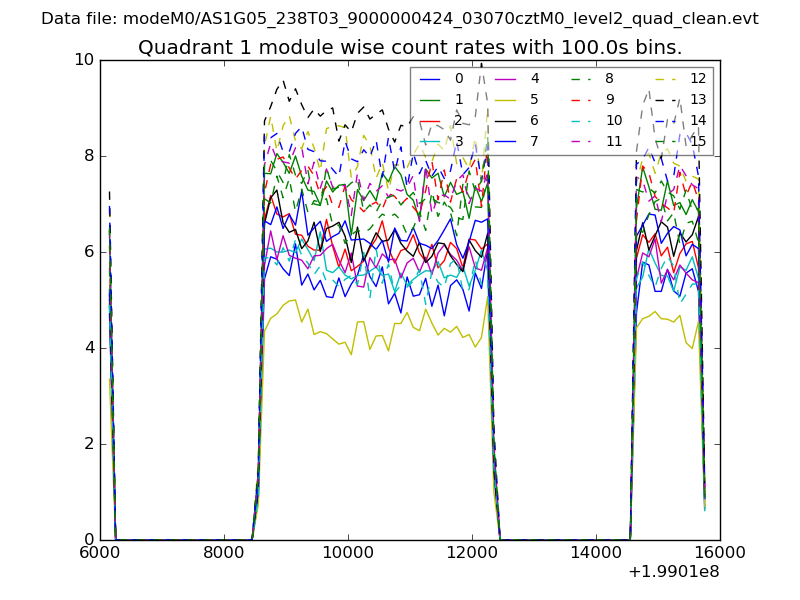
| Module-wise count rates for Quadrant A Data is divided into 100 sec bins |
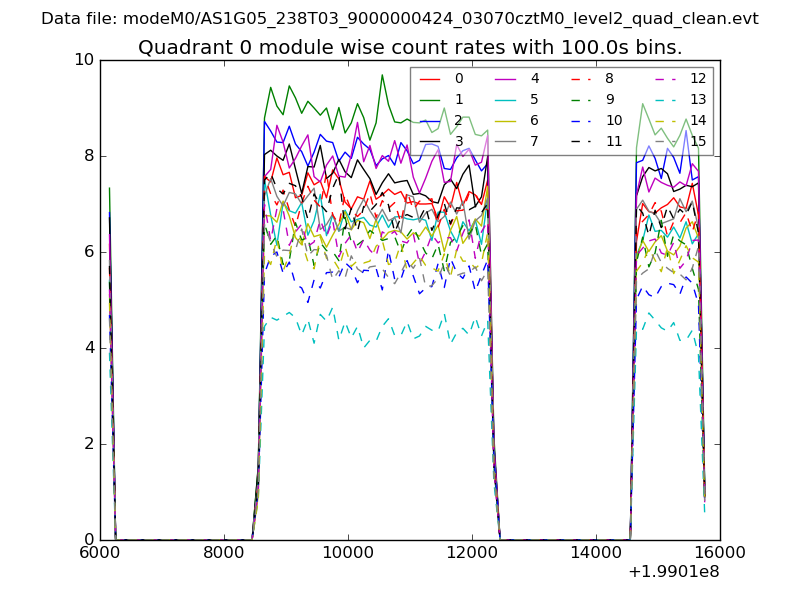 |
 |
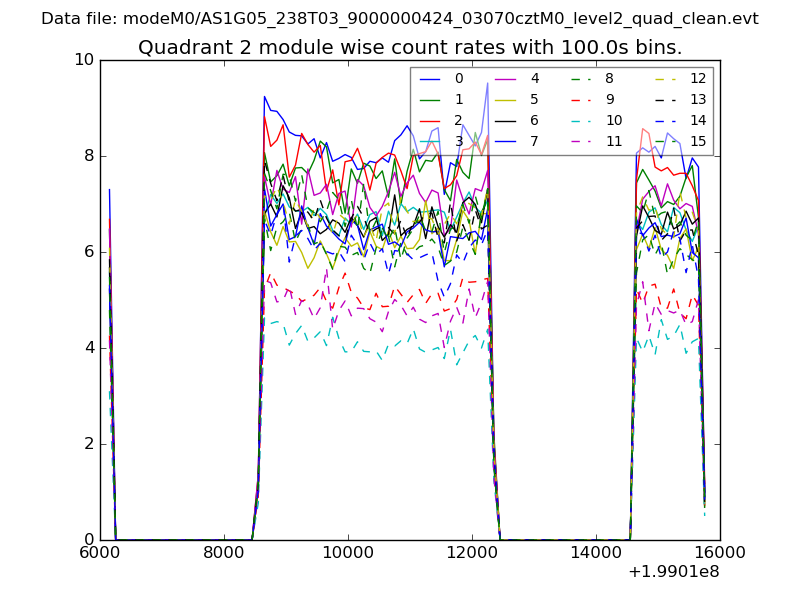
| Module-wise count rates for Quadrant B Data is divided into 100 sec bins |
 |
 |
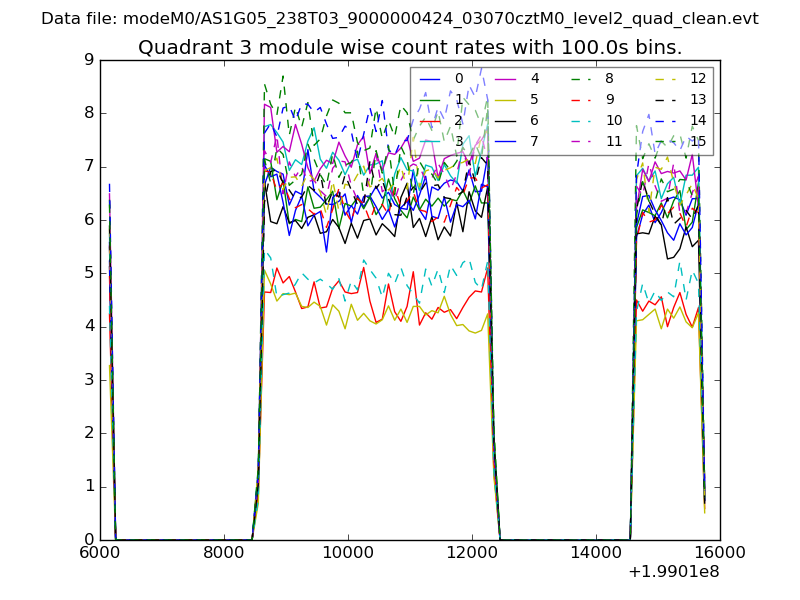
| Module-wise count rates for Quadrant C Data is divided into 100 sec bins |
 |
 |
| Module-wise count rates for Quadrant D Data is divided into 100 sec bins |
 |
 |
| Parameter | Plot |
|---|---|
| CZT HV Monitor | 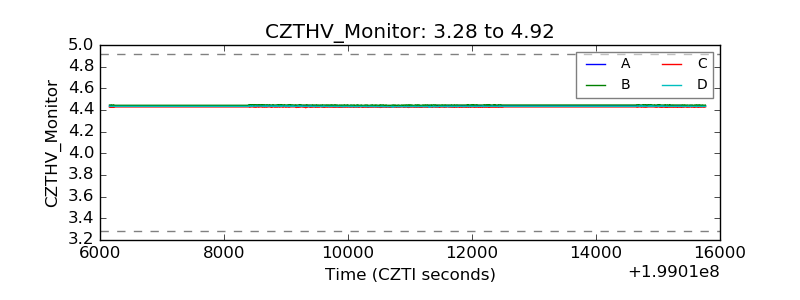 |
| D_VDD | 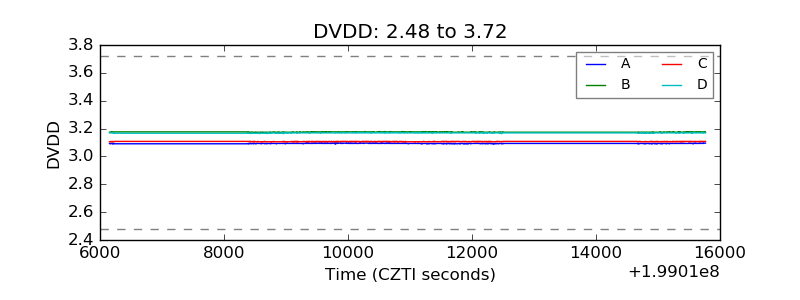 |
| Temperature 1 | 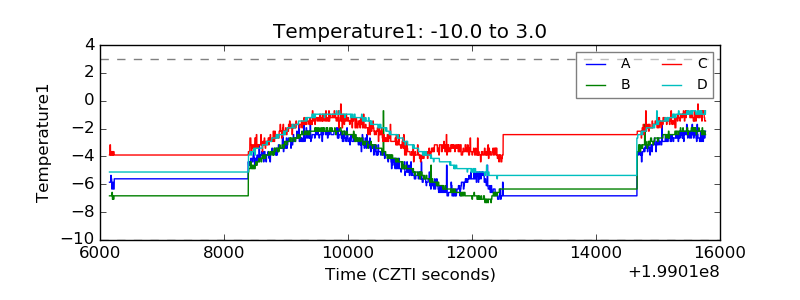 |
| Veto HV Monitor | 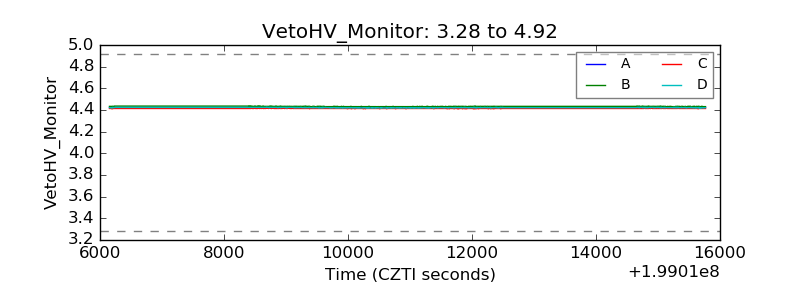 |
| Veto LLD | 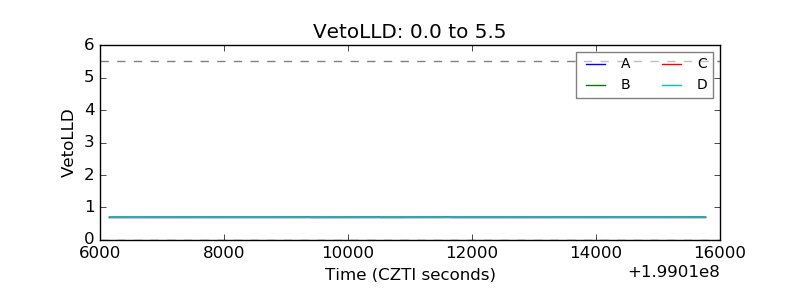 |
| Alpha Counter | 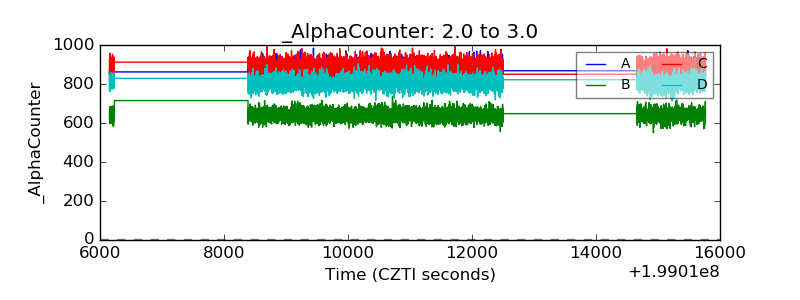 |
| _CPM_Rate | 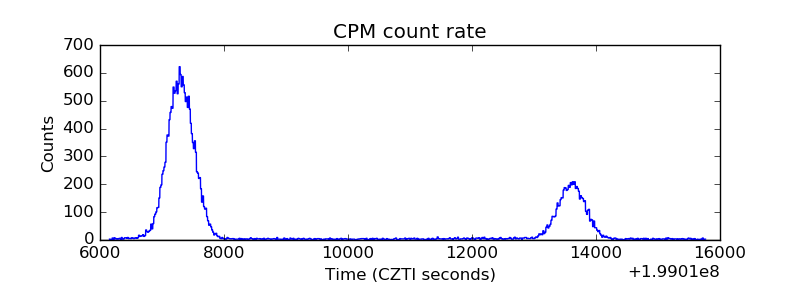 |
| CZT Counter | 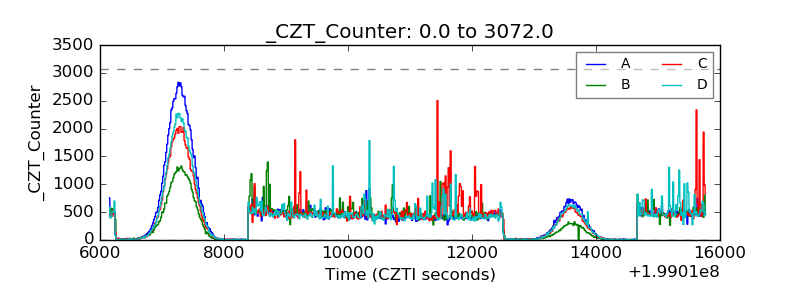 |
| +2.5 Volts monitor | 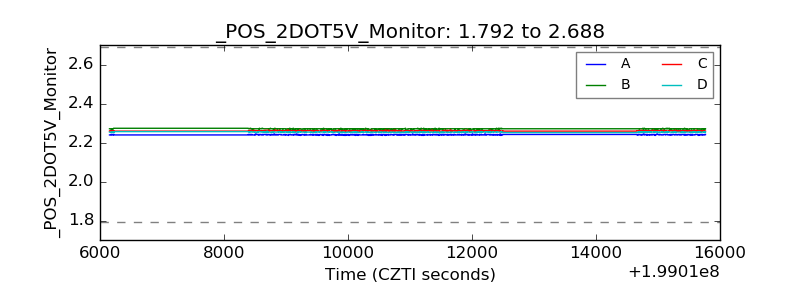 |
| +5 Volts monitor |  |
| _ROLL_ROT | 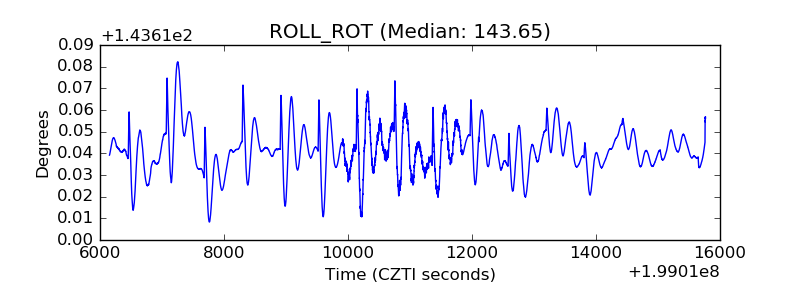 |
| _Roll_DEC | 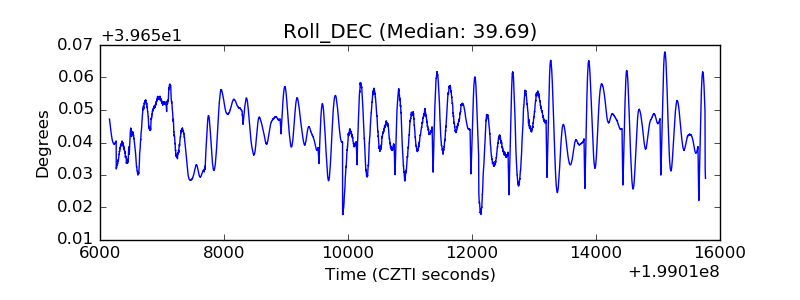 |
| _Roll_RA | 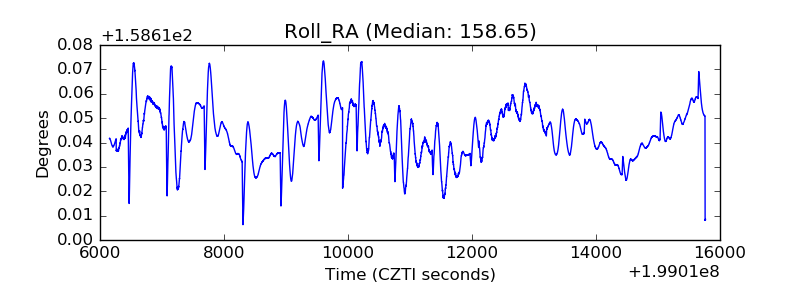 |
| Veto Counter | 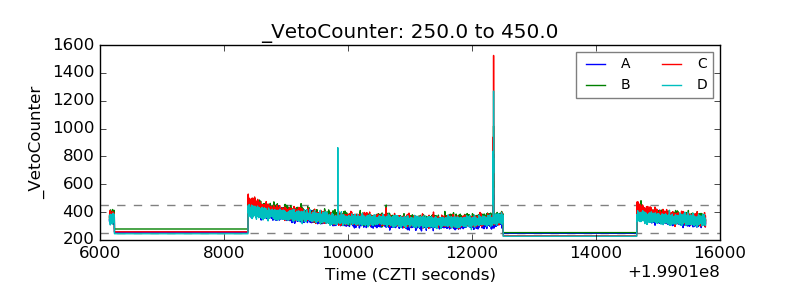 |