| Param | Original file | Final file |
|---|---|---|
| Filename | modeM0/AS1G05_238T03_9000000424_03071cztM0_level2.evt | modeM0/AS1G05_238T03_9000000424_03071cztM0_level2_quad_clean.evt |
| Size (bytes) | 350,709,120 | 73,584,000 |
| Size | 334.5 MB | 70.2 MB |
| Events in quadrant A | 2,277,132 | 476,223 |
| Events in quadrant B | 2,832,922 | 471,907 |
| Events in quadrant C | 2,570,927 | 461,543 |
| Events in quadrant D | 2,585,438 | 453,594 |
| Mode M0 | |||
|---|---|---|---|
| Quadrant | BADHDUFLAG | Total packets | Discarded packets |
| A | 0 | 10473 | 3 |
| B | 0 | 11844 | 2 |
| C | 0 | 11361 | 2 |
| D | 0 | 11519 | 2 |
| Mode M9 | |||
|---|---|---|---|
| Quadrant | BADHDUFLAG | Total packets | Discarded packets |
| A | 0 | 27 | 0 |
| B | 0 | 27 | 0 |
| C | 0 | 27 | 0 |
| D | 0 | 28 | 0 |
| Mode SS | |||
|---|---|---|---|
| Quadrant | BADHDUFLAG | Total packets | Discarded packets |
| A | 0 | 106 | 0 |
| B | 0 | 106 | 0 |
| C | 0 | 106 | 0 |
| D | 0 | 106 | 0 |
| Quadrant | Total seconds | Saturated seconds | Saturation percentage |
|---|---|---|---|
| A | 5210 | 3 | 0.057582% |
| B | 5210 | 13 | 0.249520% |
| C | 5210 | 41 | 0.786948% |
| D | 5210 | 21 | 0.403071% |
Noise dominated data is calculated using 1-second bins in cleaned event files. If a bin has >2000 counts, and if more than 50% of those come from <1% of pixels, then it is considered to be noise-dominated and hence unusable.
| Quadrant | # 1 sec bins | Bins with >0 counts | Bins with >2000 counts | High rate bins dominated by noise | Noise dominated (total time) | Noise dominated (detector-on time) | Marked lightcurve |
|---|---|---|---|---|---|---|---|
| A | 7366 | 5211 | 0 | 0 | 0.00% | 0.00% | 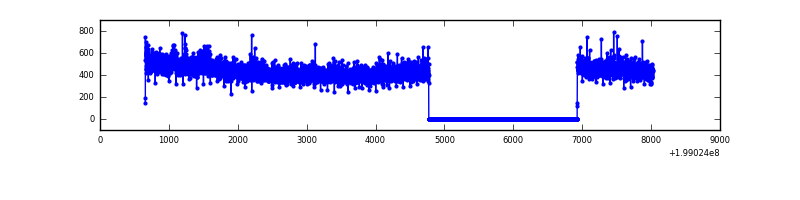 |
| B | 7366 | 5211 | 6 | 6 | 0.08% | 0.12% | 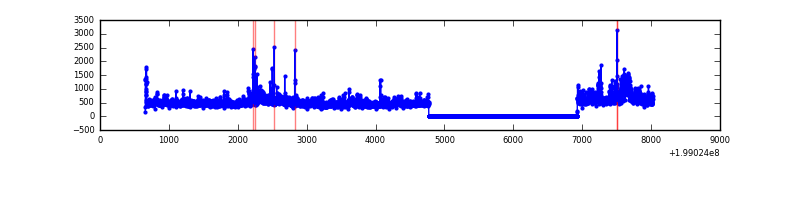 |
| C | 7366 | 5211 | 25 | 25 | 0.34% | 0.48% | 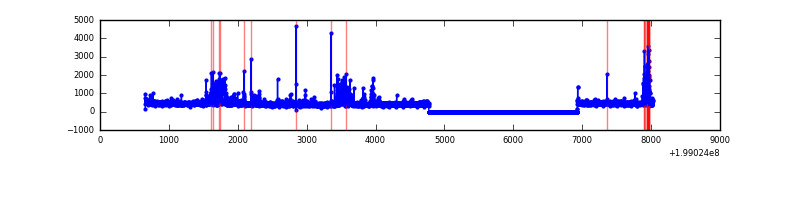 |
| D | 7366 | 5211 | 17 | 17 | 0.23% | 0.33% | 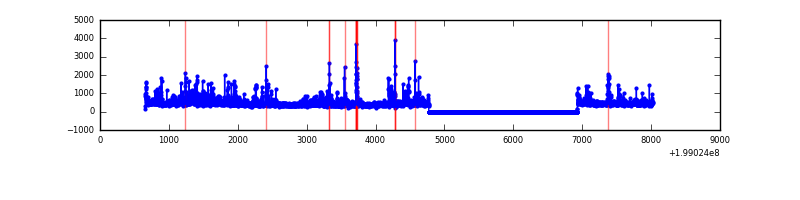 |
Top three noisy pixels from each quadrant. If the there are fewer than three noisy pixels in the level2.evt file, extra rows are filled as -1
| Pixel properties | Quadrant properties | ||||||
|---|---|---|---|---|---|---|---|
| Quadrant | DetID | PixID | Counts | Sigma | Mean | Median | Sigma |
| A | 8 | 15 | 60122 | 515.7 | 565 | 552 | 115.5 |
| A | 13 | 14 | 11239 | 92.52 | 565 | 552 | 115.5 |
| A | 12 | 189 | 10548 | 86.54 | 565 | 552 | 115.5 |
| B | 15 | 204 | 484264 | 4444.57 | 567 | 554 | 108.8 |
| B | 14 | 167 | 50983 | 463.37 | 567 | 554 | 108.8 |
| B | 0 | 219 | 35896 | 324.74 | 567 | 554 | 108.8 |
| C | 14 | 223 | 264996 | 2063.17 | 546 | 549 | 128.2 |
| C | 6 | 80 | 30290 | 232.03 | 546 | 549 | 128.2 |
| C | 3 | 63 | 30108 | 230.61 | 546 | 549 | 128.2 |
| D | 2 | 152 | 233158 | 1734.32 | 551 | 535 | 134.1 |
| D | 10 | 85 | 89436 | 662.8 | 551 | 535 | 134.1 |
| D | 2 | 136 | 32950 | 241.67 | 551 | 535 | 134.1 |
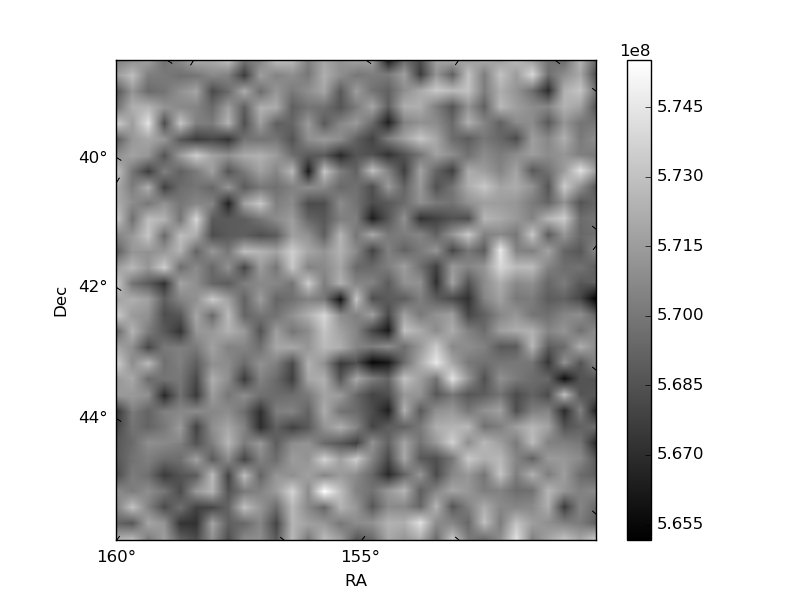
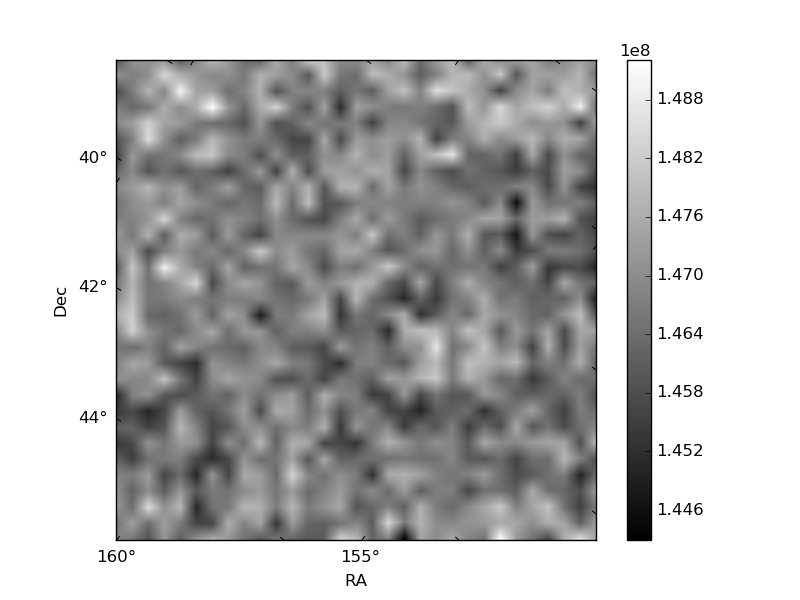
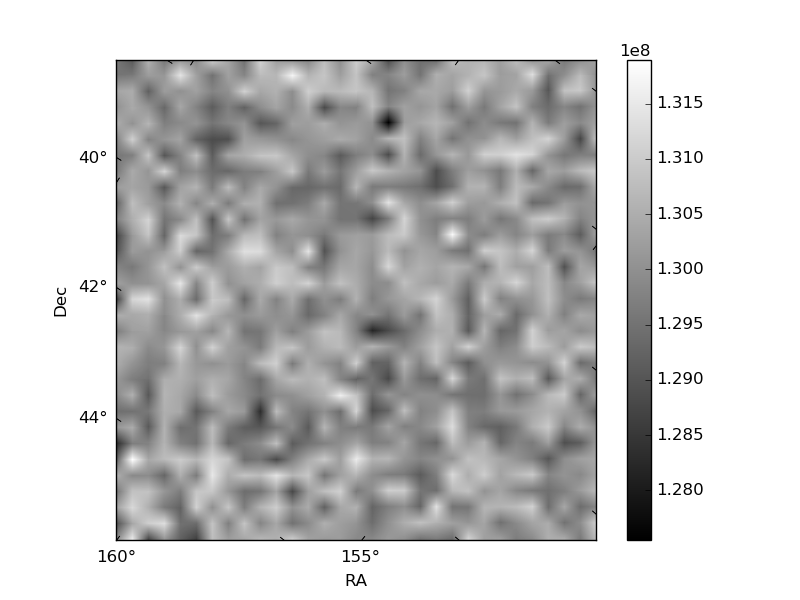
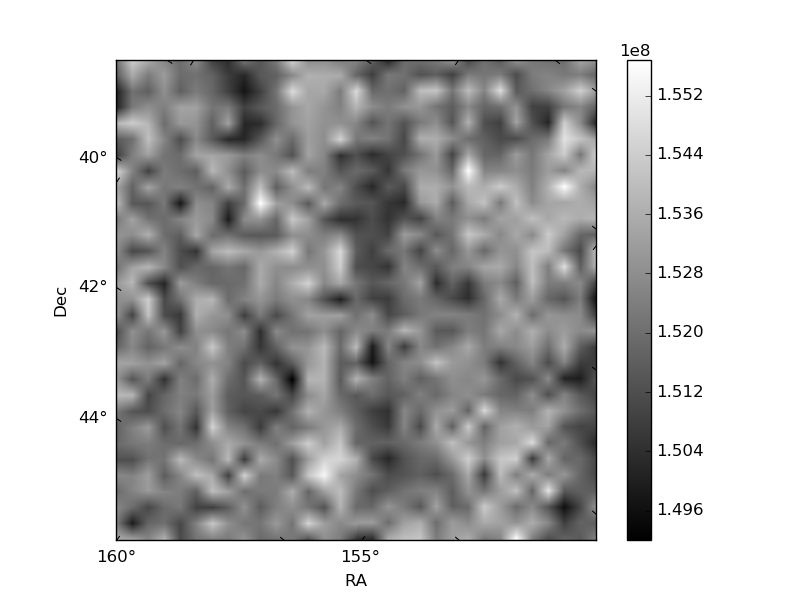
Histogram calculated using DETX and DETY for each event in the final _common_clean file
| Quadrant A | 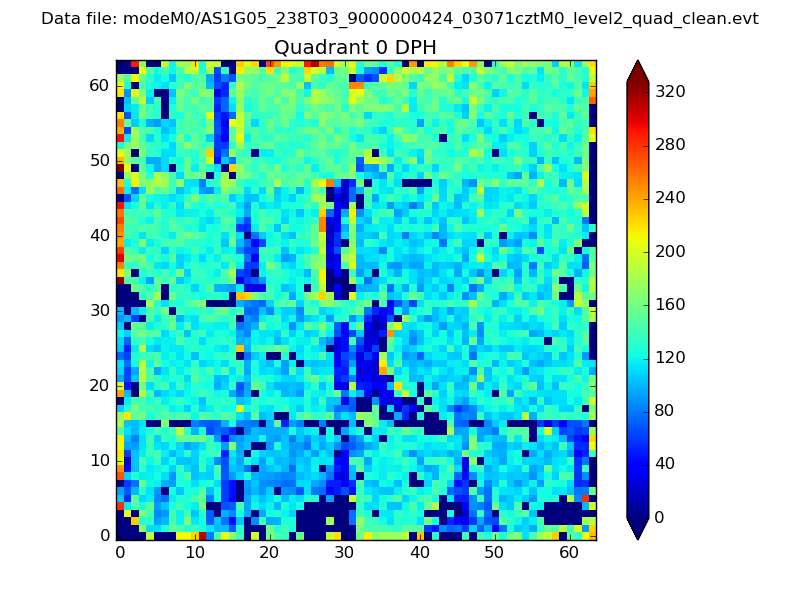 |
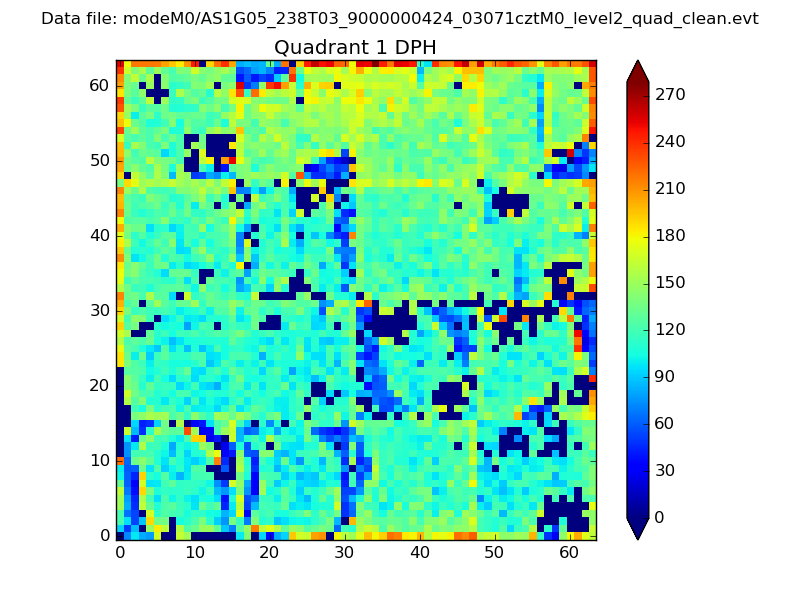 |
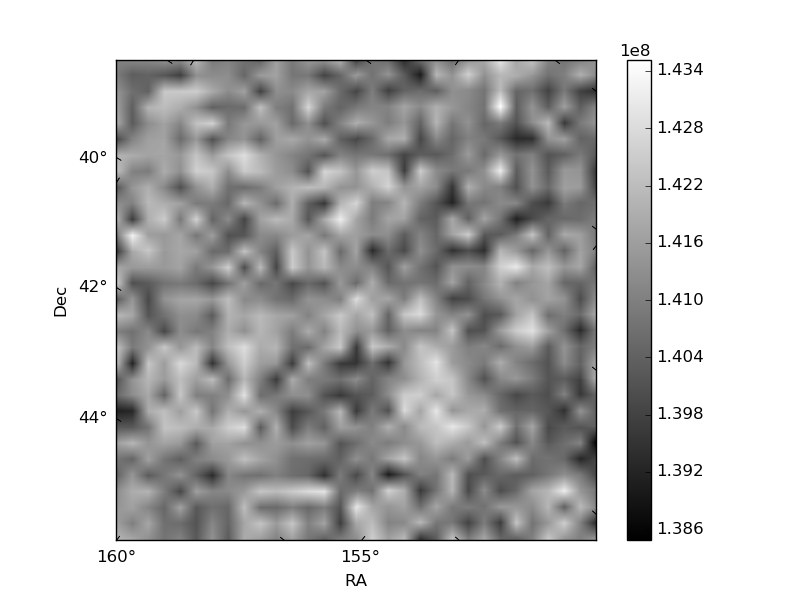
Quadrant B |
|---|---|---|---|
| Quadrant D | 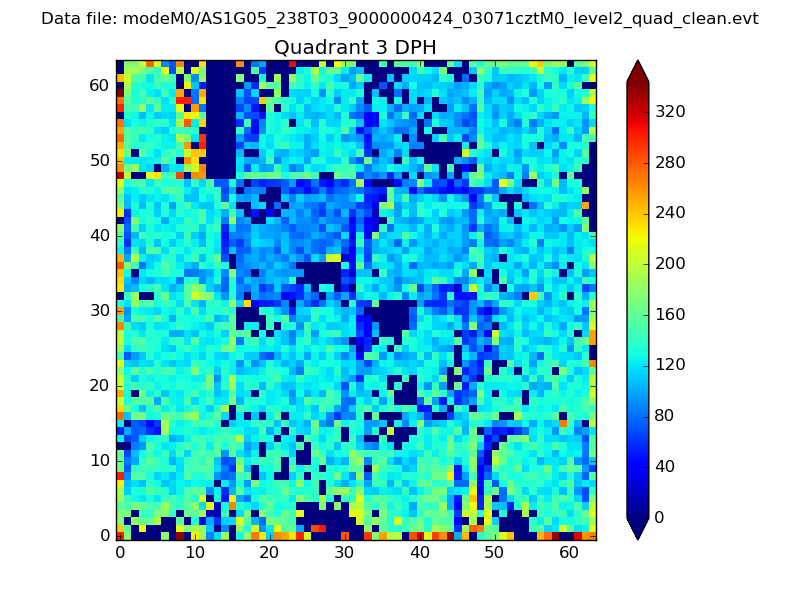 |
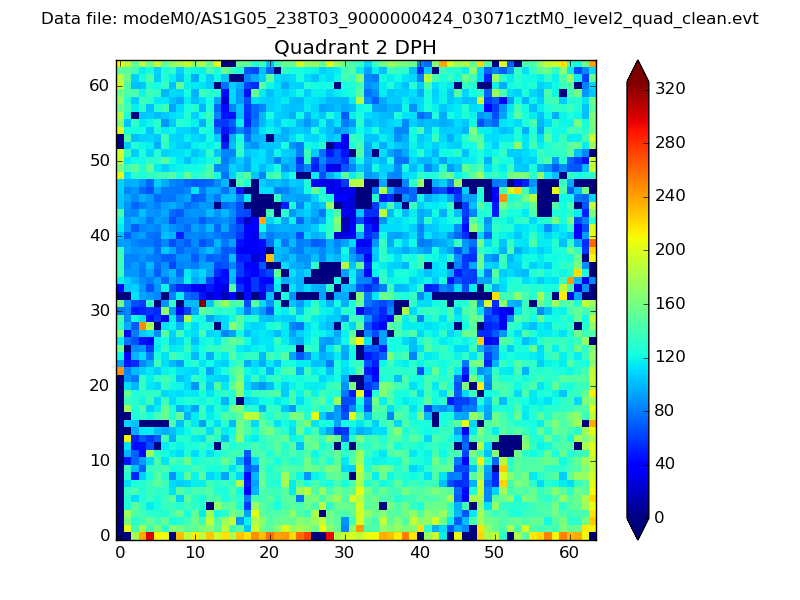 |
Quadrant C |
| Plot type | Count rate plots | Images |
|---|---|---|
| Comparison with Poisson distribution Blue bars denote a histogram of data divided into 1 sec bins. Red curve is a Poisson curve with rate = median count rate of data. |
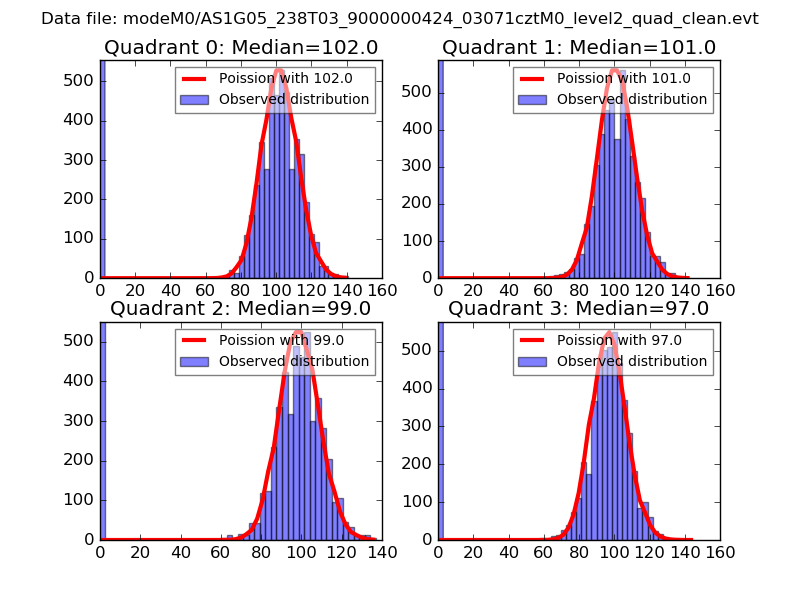 |
 |
| Quadrant-wise count rates Data is divided into 100 sec bins |
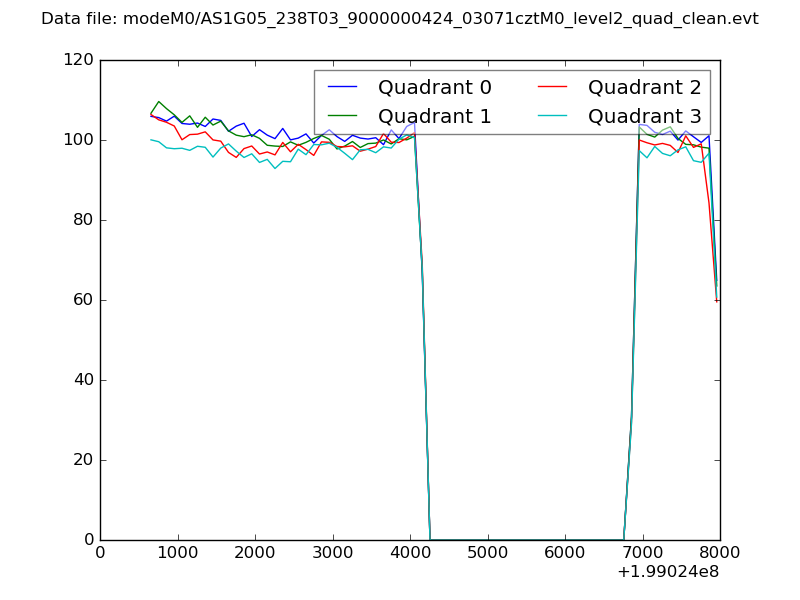 |
|
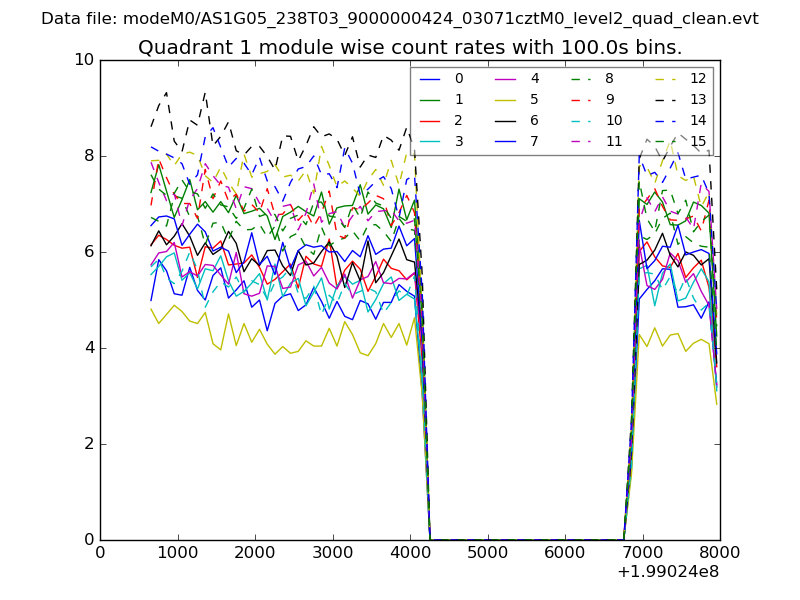
| Module-wise count rates for Quadrant A Data is divided into 100 sec bins |
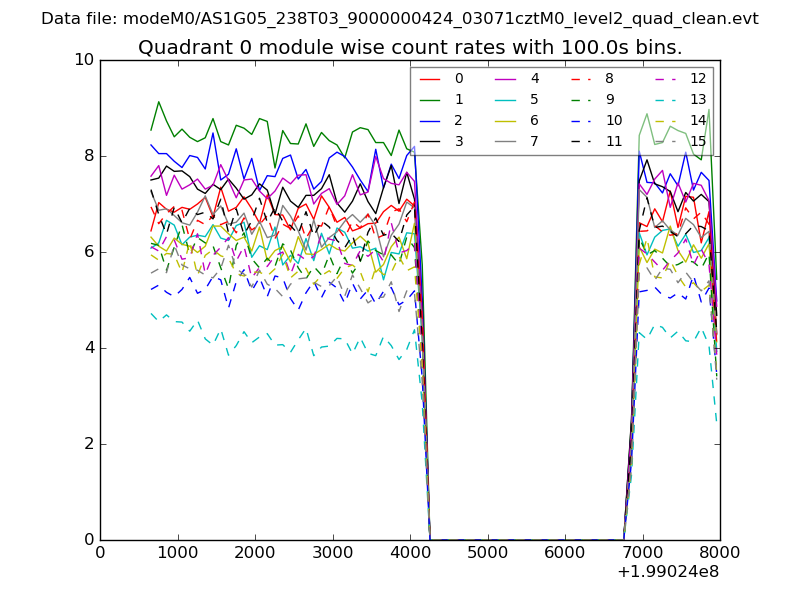 |
 |
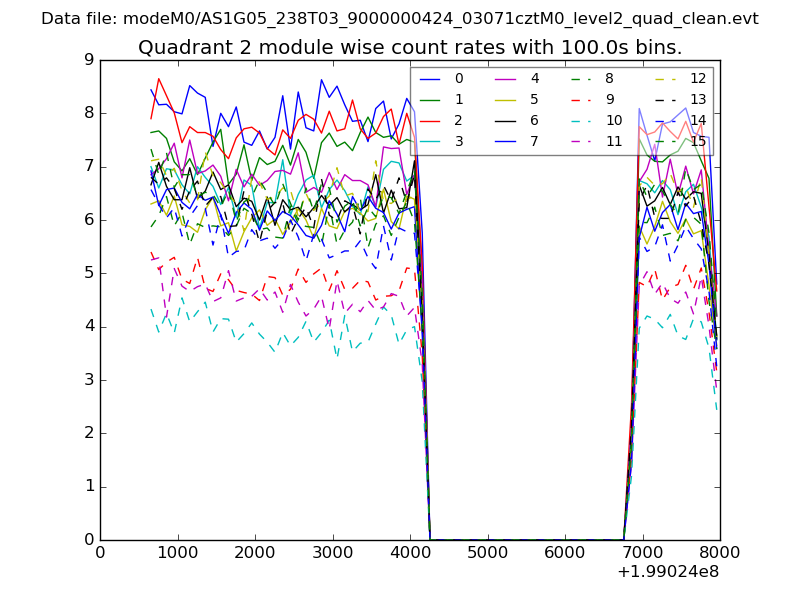
| Module-wise count rates for Quadrant B Data is divided into 100 sec bins |
 |
 |
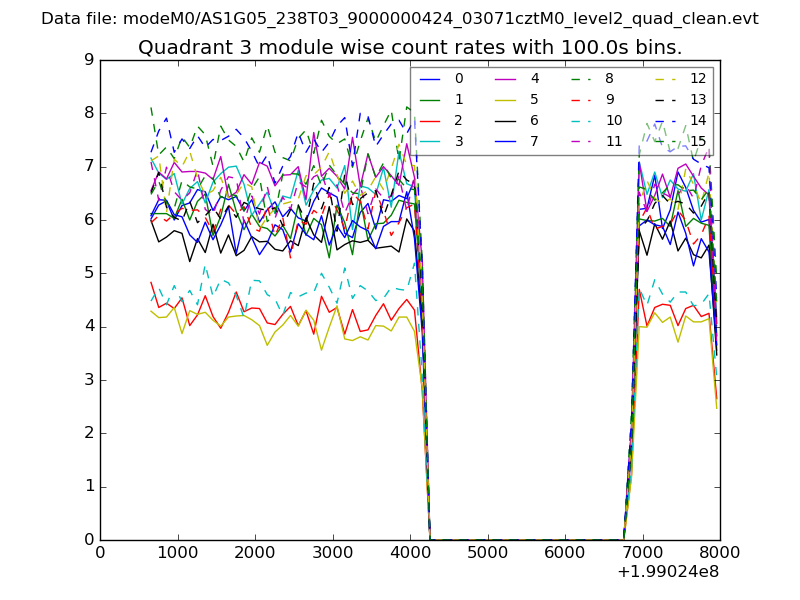
| Module-wise count rates for Quadrant C Data is divided into 100 sec bins |
 |
 |
| Module-wise count rates for Quadrant D Data is divided into 100 sec bins |
 |
 |
| Parameter | Plot |
|---|---|
| CZT HV Monitor | 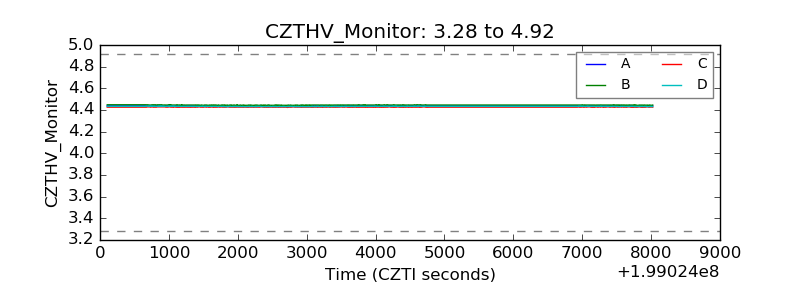 |
| D_VDD | 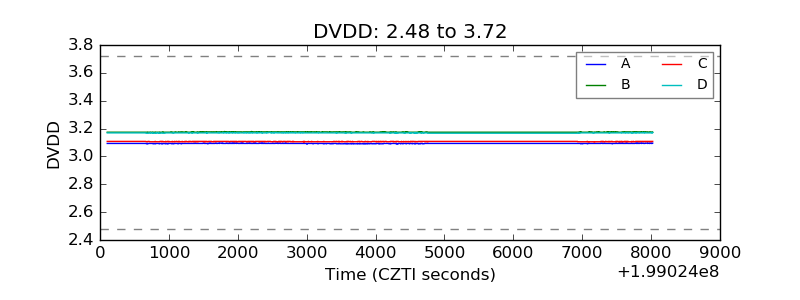 |
| Temperature 1 | 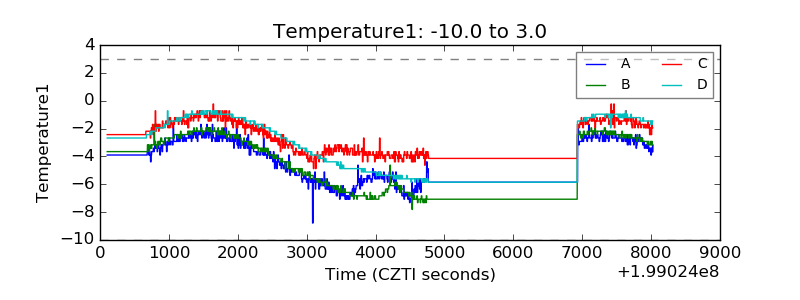 |
| Veto HV Monitor | 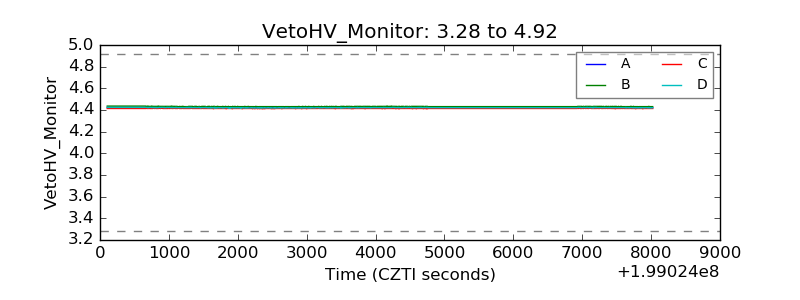 |
| Veto LLD | 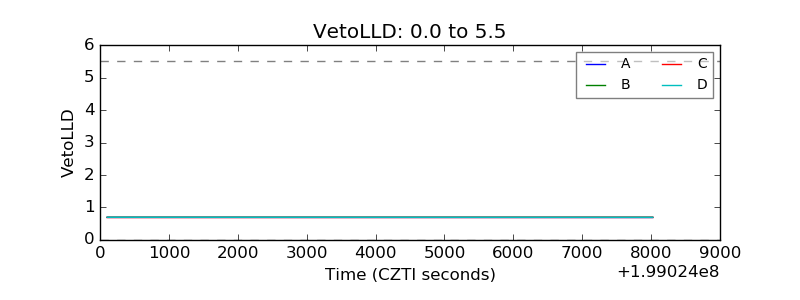 |
| Alpha Counter | 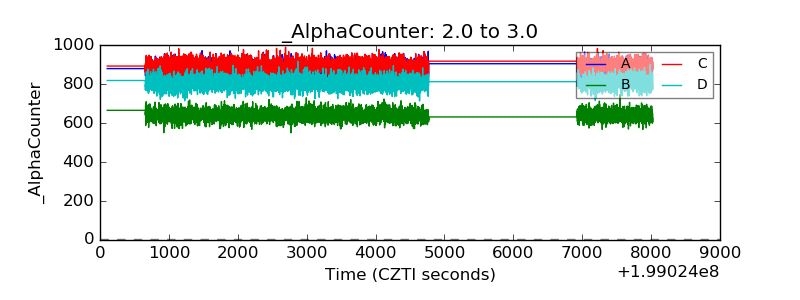 |
| _CPM_Rate | 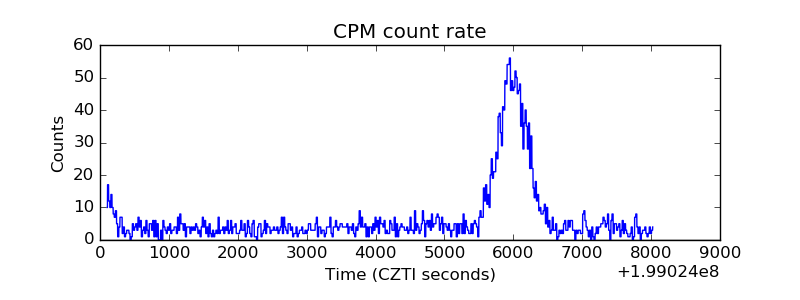 |
| CZT Counter | 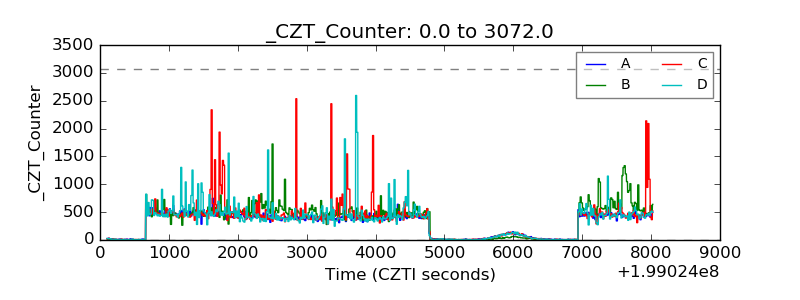 |
| +2.5 Volts monitor |  |
| +5 Volts monitor |  |
| _ROLL_ROT | 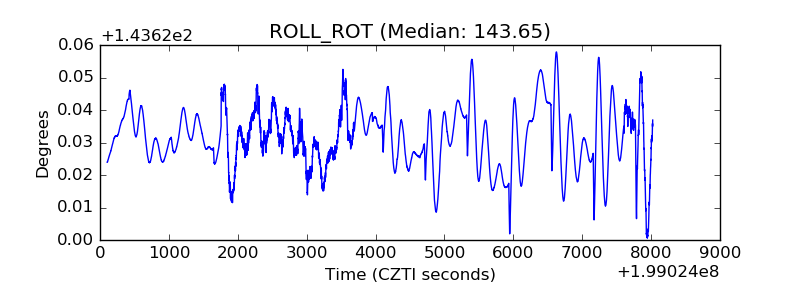 |
| _Roll_DEC | 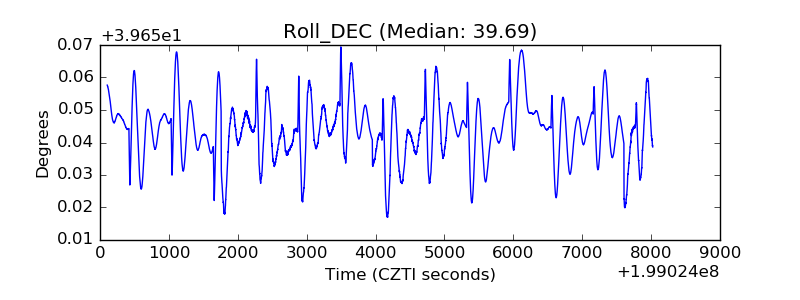 |
| _Roll_RA | 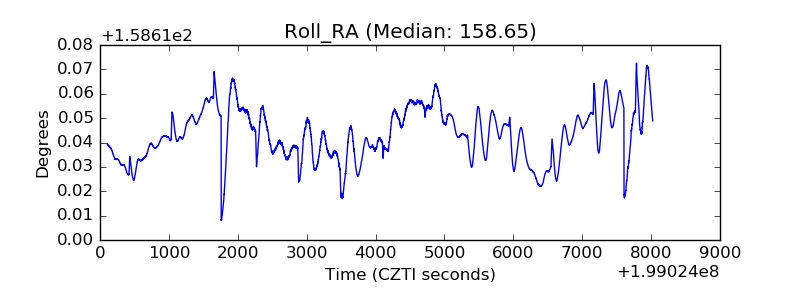 |
| Veto Counter | 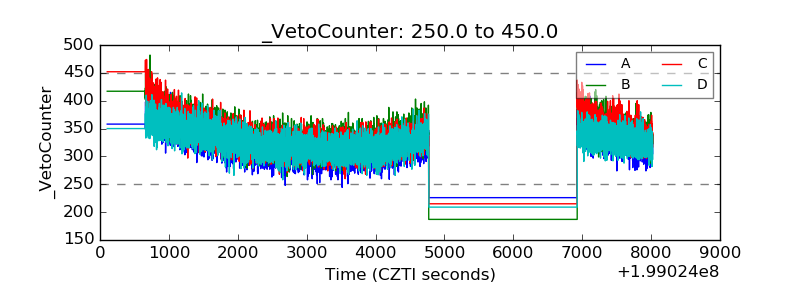 |