| Param | Original file | Final file |
|---|---|---|
| Filename | modeM0/AS1G05_238T03_9000000424_03072cztM0_level2.evt | modeM0/AS1G05_238T03_9000000424_03072cztM0_level2_quad_clean.evt |
| Size (bytes) | 345,441,600 | 62,426,880 |
| Size | 329.4 MB | 59.5 MB |
| Events in quadrant A | 2,065,716 | 395,099 |
| Events in quadrant B | 3,008,511 | 387,356 |
| Events in quadrant C | 2,469,254 | 382,767 |
| Events in quadrant D | 2,581,105 | 377,805 |
| Mode M0 | |||
|---|---|---|---|
| Quadrant | BADHDUFLAG | Total packets | Discarded packets |
| A | 0 | 9934 | 3 |
| B | 0 | 12389 | 2 |
| C | 0 | 10944 | 2 |
| D | 0 | 11274 | 2 |
| Mode M9 | |||
|---|---|---|---|
| Quadrant | BADHDUFLAG | Total packets | Discarded packets |
| A | 0 | 21 | 0 |
| B | 0 | 21 | 0 |
| C | 0 | 21 | 0 |
| D | 0 | 21 | 0 |
| Mode SS | |||
|---|---|---|---|
| Quadrant | BADHDUFLAG | Total packets | Discarded packets |
| A | 0 | 102 | 0 |
| B | 0 | 102 | 0 |
| C | 0 | 102 | 0 |
| D | 0 | 102 | 0 |
| Quadrant | Total seconds | Saturated seconds | Saturation percentage |
|---|---|---|---|
| A | 4944 | 6 | 0.121359% |
| B | 4944 | 21 | 0.424757% |
| C | 4944 | 56 | 1.132686% |
| D | 4944 | 67 | 1.355178% |
Noise dominated data is calculated using 1-second bins in cleaned event files. If a bin has >2000 counts, and if more than 50% of those come from <1% of pixels, then it is considered to be noise-dominated and hence unusable.
| Quadrant | # 1 sec bins | Bins with >0 counts | Bins with >2000 counts | High rate bins dominated by noise | Noise dominated (total time) | Noise dominated (detector-on time) | Marked lightcurve |
|---|---|---|---|---|---|---|---|
| A | 7099 | 4945 | 0 | 0 | 0.00% | 0.00% | 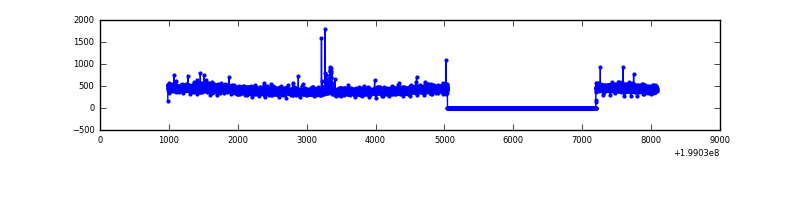 |
| B | 7099 | 4945 | 16 | 16 | 0.23% | 0.32% | 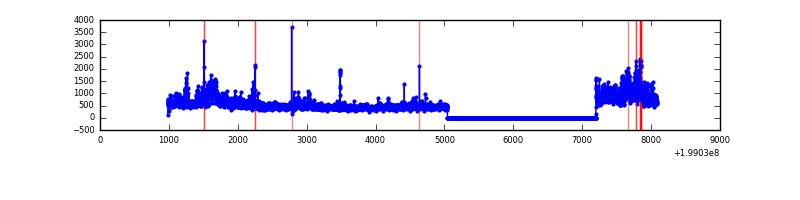 |
| C | 7099 | 4945 | 50 | 50 | 0.70% | 1.01% | 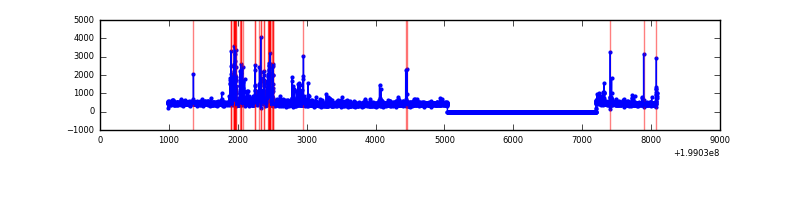 |
| D | 7099 | 4945 | 54 | 54 | 0.76% | 1.09% | 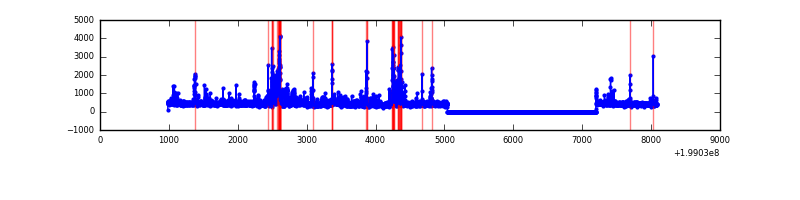 |
Top three noisy pixels from each quadrant. If the there are fewer than three noisy pixels in the level2.evt file, extra rows are filled as -1
| Pixel properties | Quadrant properties | ||||||
|---|---|---|---|---|---|---|---|
| Quadrant | DetID | PixID | Counts | Sigma | Mean | Median | Sigma |
| A | 0 | 50 | 12948 | 115.52 | 522 | 509 | 107.7 |
| A | 8 | 15 | 9987 | 88.02 | 522 | 509 | 107.7 |
| A | 13 | 14 | 9364 | 82.24 | 522 | 509 | 107.7 |
| B | 15 | 204 | 870234 | 8507.16 | 527 | 517 | 102.2 |
| B | 14 | 167 | 26553 | 254.67 | 527 | 517 | 102.2 |
| B | 5 | 200 | 24298 | 232.61 | 527 | 517 | 102.2 |
| C | 14 | 223 | 302658 | 2532.03 | 508 | 510 | 119.3 |
| C | 5 | 250 | 83109 | 692.19 | 508 | 510 | 119.3 |
| C | 6 | 80 | 34326 | 283.38 | 508 | 510 | 119.3 |
| D | 3 | 12 | 177191 | 1409.24 | 508 | 491 | 125.4 |
| D | 2 | 152 | 162434 | 1291.55 | 508 | 491 | 125.4 |
| D | 7 | 6 | 152533 | 1212.58 | 508 | 491 | 125.4 |
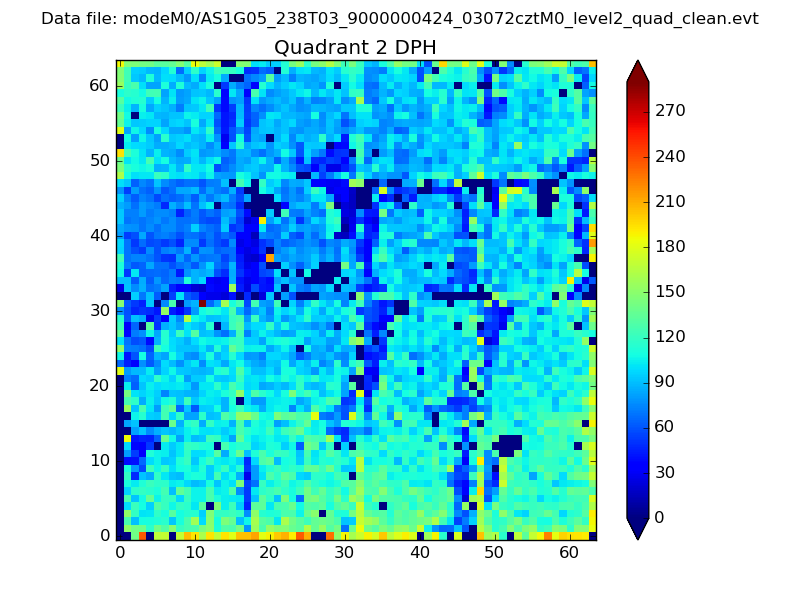
Histogram calculated using DETX and DETY for each event in the final _common_clean file
| Quadrant A | 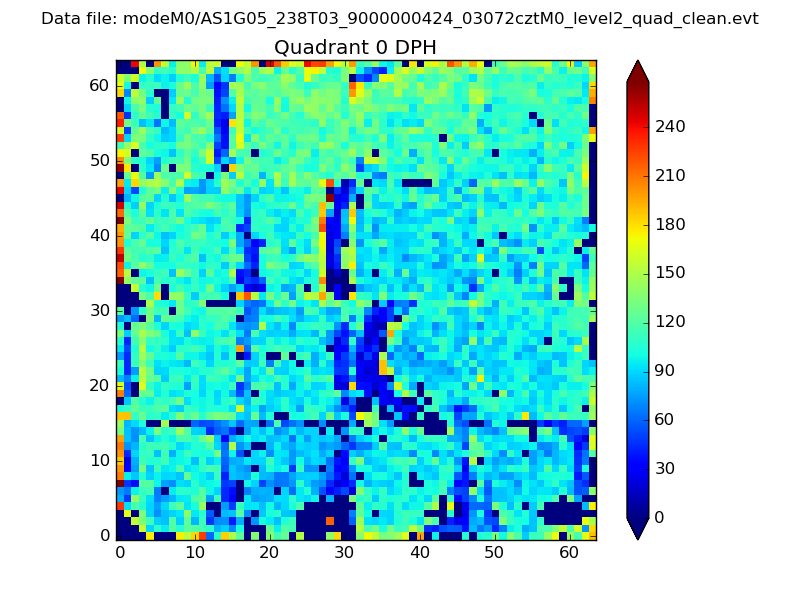 |
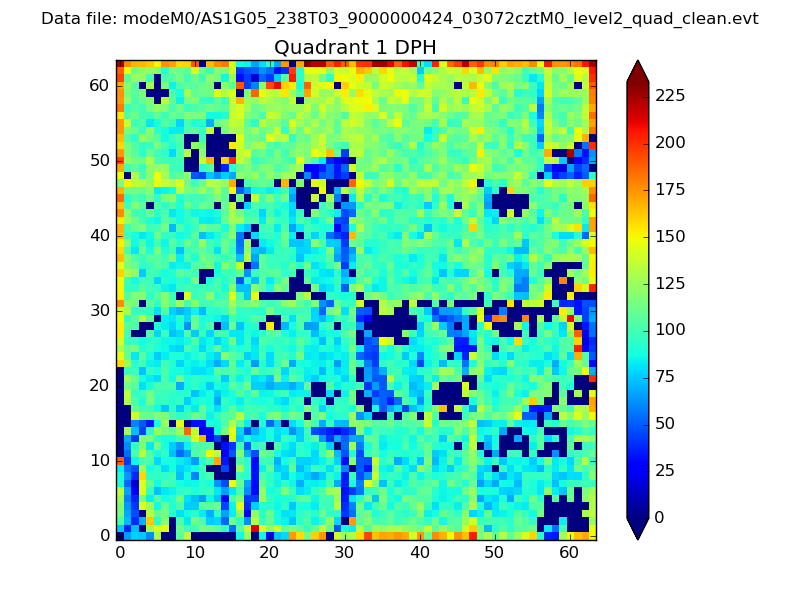 |
Quadrant B |
|---|---|---|---|
| Quadrant D | 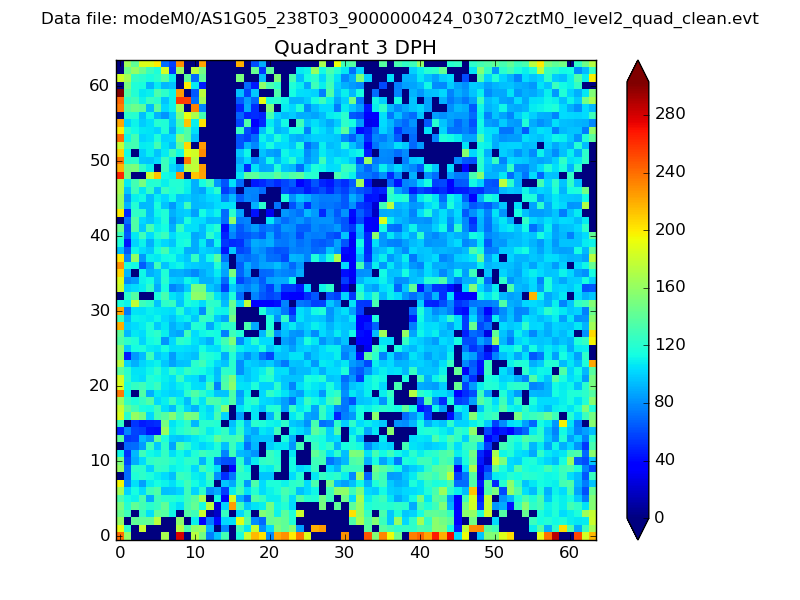 |
 |
Quadrant C |
| Plot type | Count rate plots | Images |
|---|---|---|
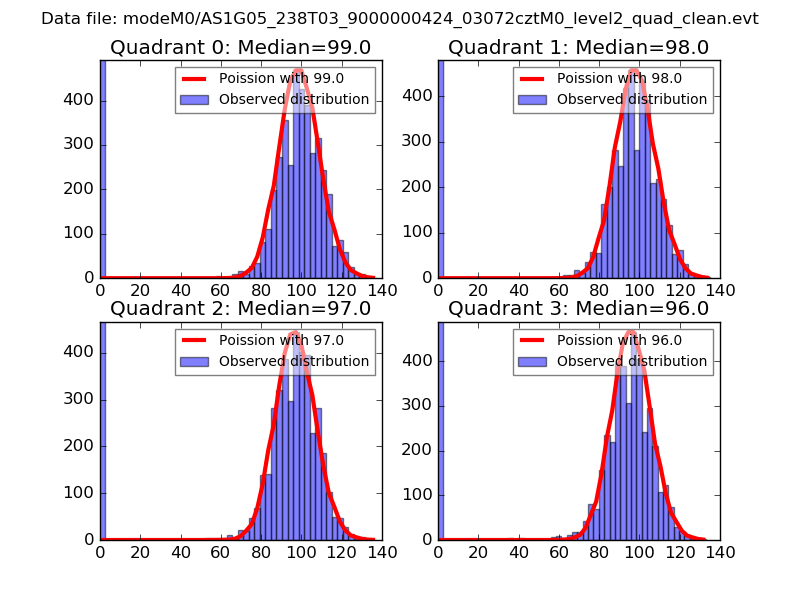
| Comparison with Poisson distribution Blue bars denote a histogram of data divided into 1 sec bins. Red curve is a Poisson curve with rate = median count rate of data. |
 |
 |
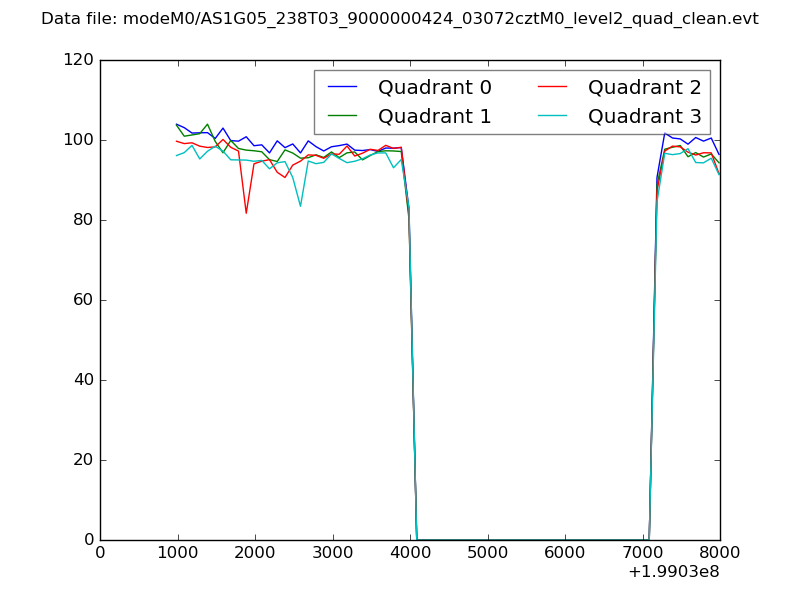
| Quadrant-wise count rates Data is divided into 100 sec bins |
 |
|
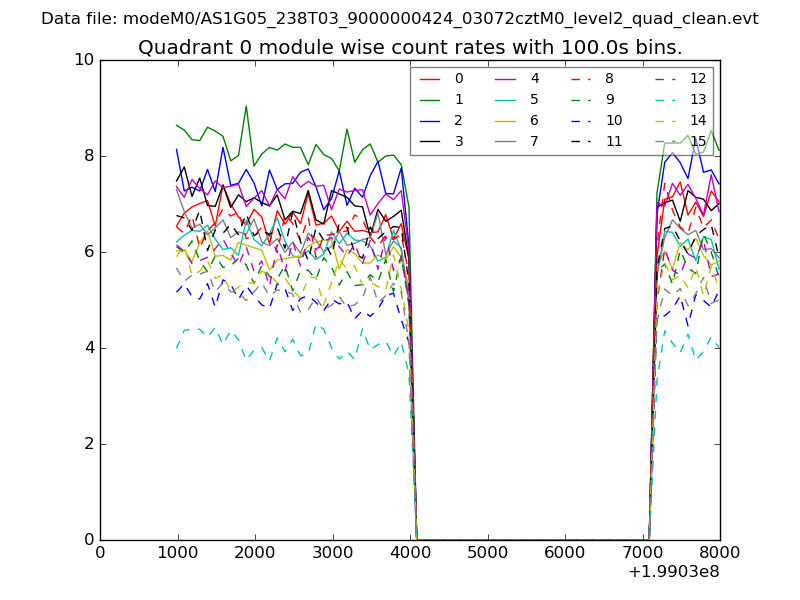
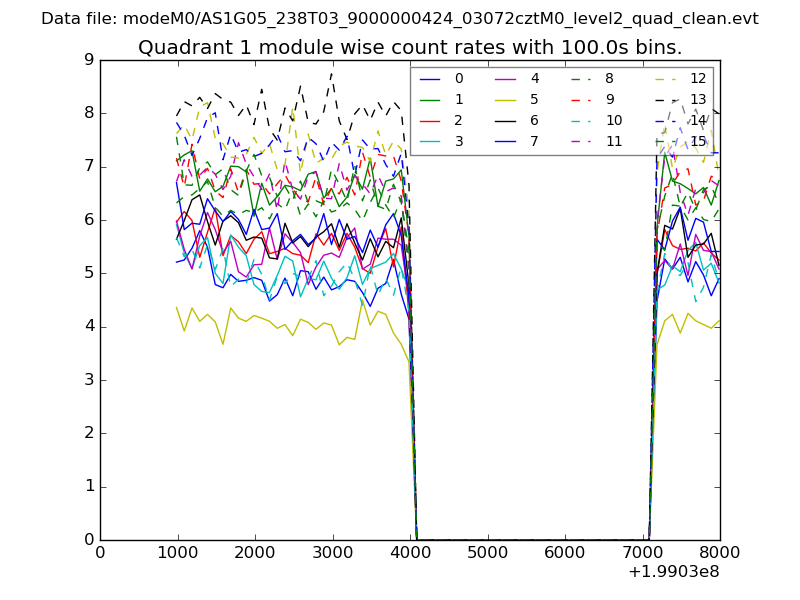
| Module-wise count rates for Quadrant A Data is divided into 100 sec bins |
 |
 |
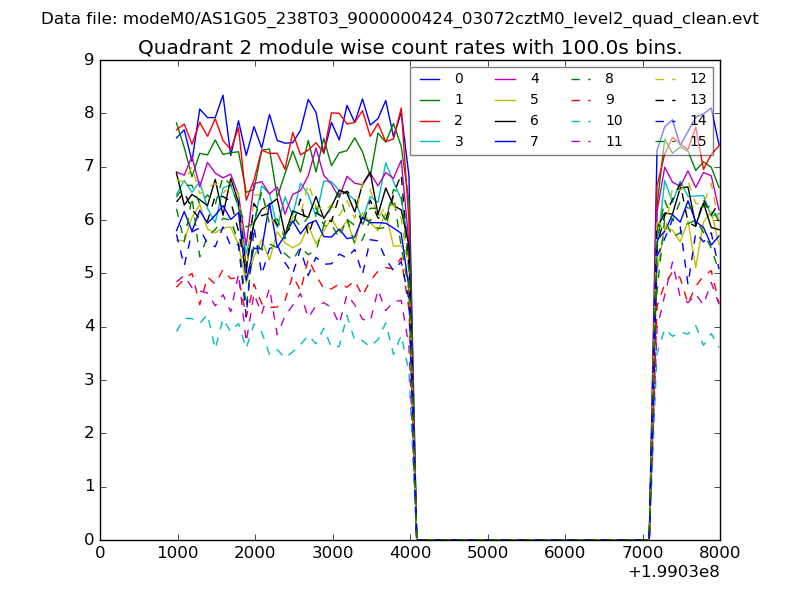
| Module-wise count rates for Quadrant B Data is divided into 100 sec bins |
 |
 |
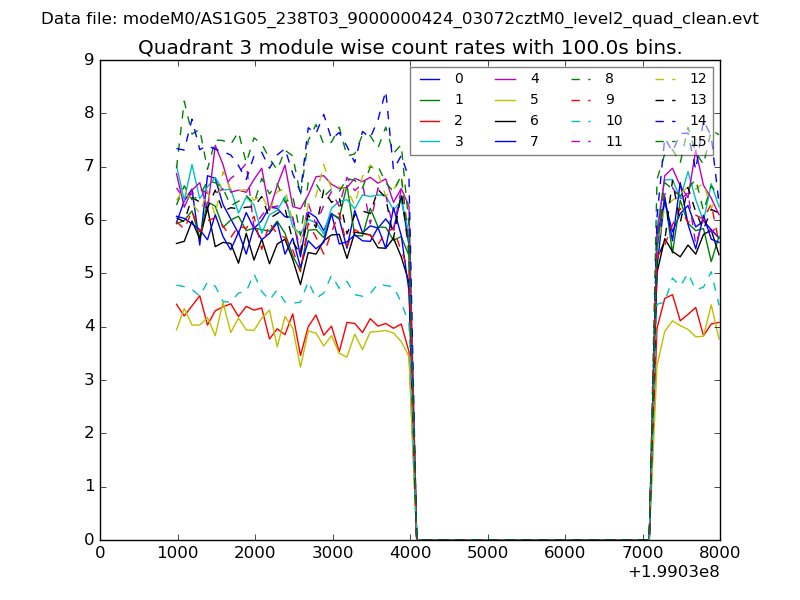
| Module-wise count rates for Quadrant C Data is divided into 100 sec bins |
 |
 |
| Module-wise count rates for Quadrant D Data is divided into 100 sec bins |
 |
 |
| Parameter | Plot |
|---|---|
| CZT HV Monitor | 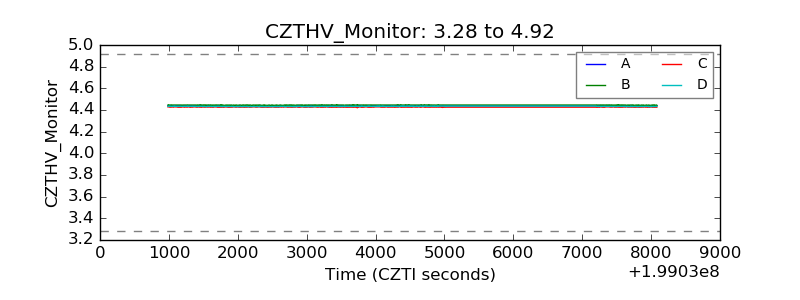 |
| D_VDD | 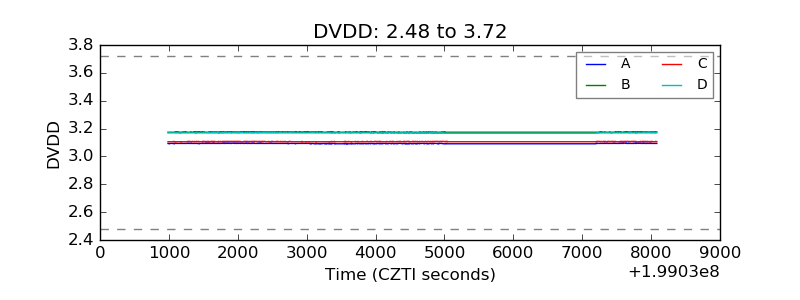 |
| Temperature 1 | 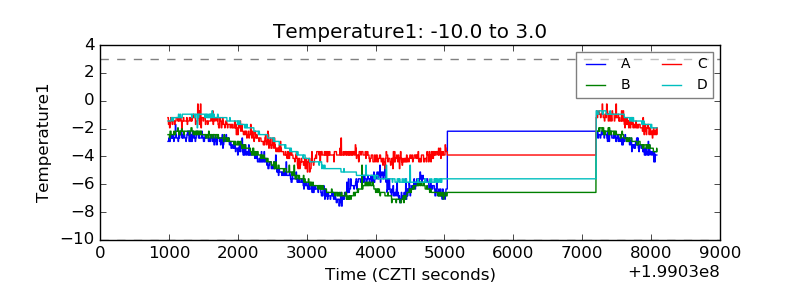 |
| Veto HV Monitor | 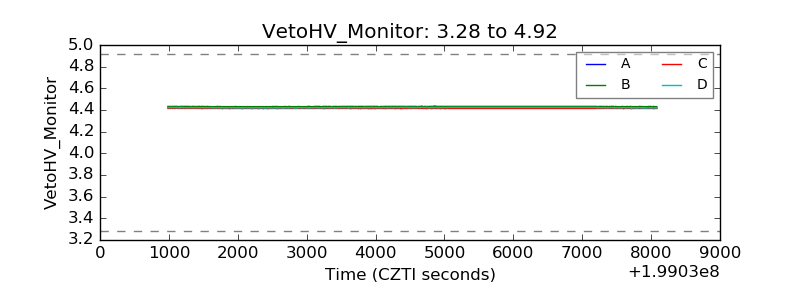 |
| Veto LLD | 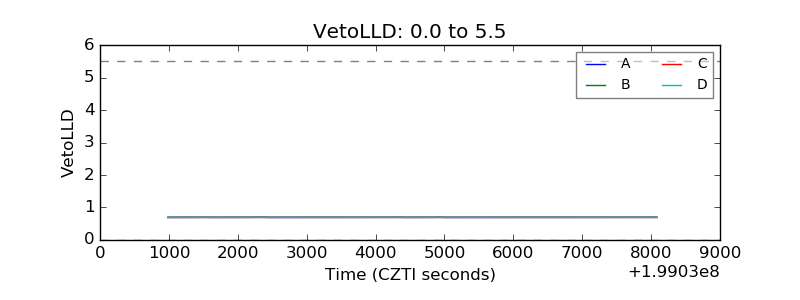 |
| Alpha Counter | 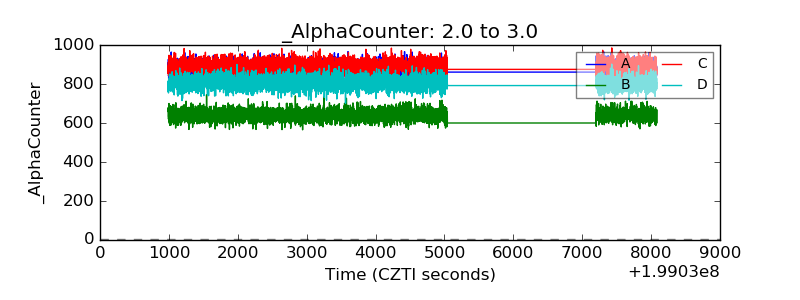 |
| _CPM_Rate | 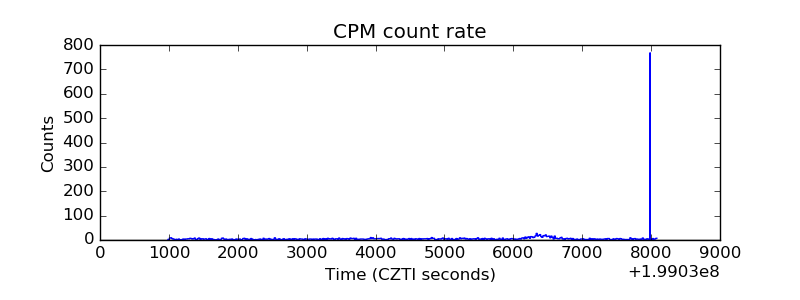 |
| CZT Counter | 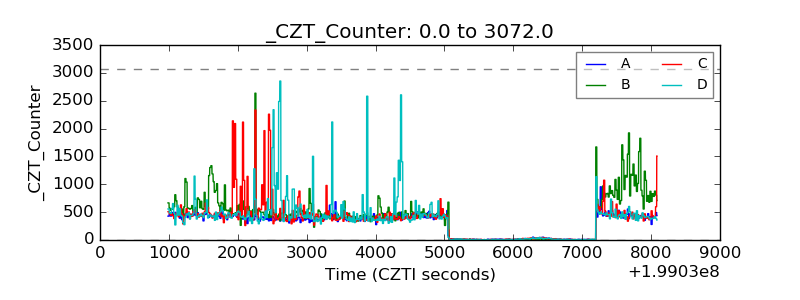 |
| +2.5 Volts monitor |  |
| +5 Volts monitor |  |
| _ROLL_ROT | 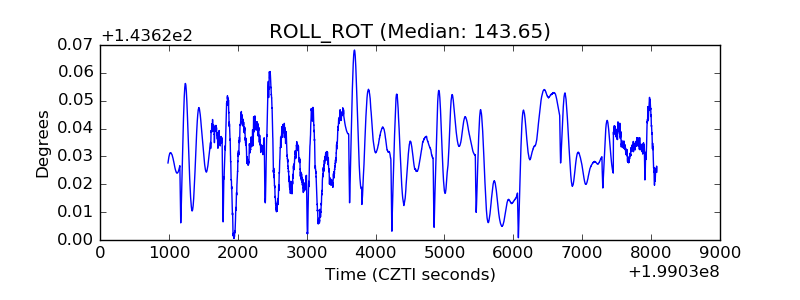 |
| _Roll_DEC | 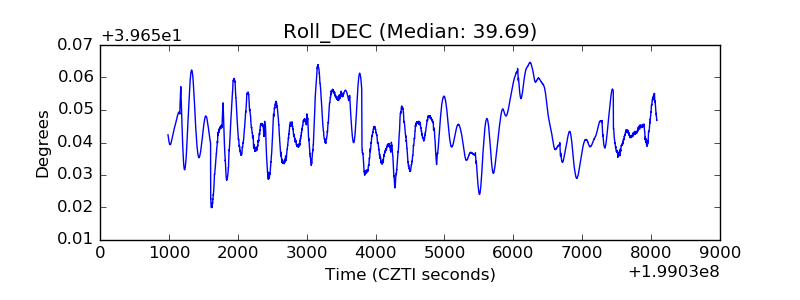 |
| _Roll_RA | 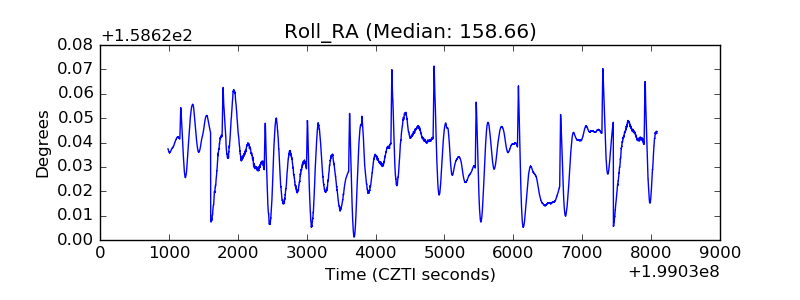 |
| Veto Counter | 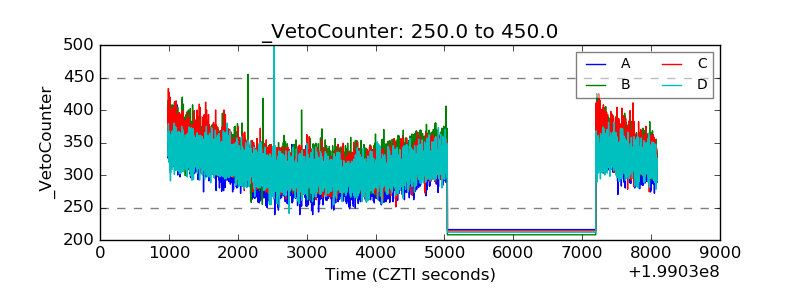 |