| Param | Original file | Final file |
|---|---|---|
| Filename | modeM0/AS1G05_238T03_9000000424_03074cztM0_level2.evt | modeM0/AS1G05_238T03_9000000424_03074cztM0_level2_quad_clean.evt |
| Size (bytes) | 335,635,200 | 54,106,560 |
| Size | 320.1 MB | 51.6 MB |
| Events in quadrant A | 2,103,606 | 324,115 |
| Events in quadrant B | 2,688,013 | 318,630 |
| Events in quadrant C | 2,227,617 | 319,167 |
| Events in quadrant D | 2,791,860 | 312,685 |
| Mode M0 | |||
|---|---|---|---|
| Quadrant | BADHDUFLAG | Total packets | Discarded packets |
| A | 0 | 10381 | 3 |
| B | 0 | 11584 | 2 |
| C | 0 | 10673 | 2 |
| D | 0 | 12201 | 2 |
| Mode M9 | |||
|---|---|---|---|
| Quadrant | BADHDUFLAG | Total packets | Discarded packets |
| A | 0 | 33 | 0 |
| B | 0 | 33 | 0 |
| C | 0 | 33 | 0 |
| D | 0 | 34 | 0 |
| Mode SS | |||
|---|---|---|---|
| Quadrant | BADHDUFLAG | Total packets | Discarded packets |
| A | 0 | 106 | 0 |
| B | 0 | 106 | 0 |
| C | 0 | 106 | 0 |
| D | 0 | 106 | 0 |
| Quadrant | Total seconds | Saturated seconds | Saturation percentage |
|---|---|---|---|
| A | 5186 | 3 | 0.057848% |
| B | 5186 | 23 | 0.443502% |
| C | 5186 | 21 | 0.404936% |
| D | 5186 | 65 | 1.253374% |
Noise dominated data is calculated using 1-second bins in cleaned event files. If a bin has >2000 counts, and if more than 50% of those come from <1% of pixels, then it is considered to be noise-dominated and hence unusable.
| Quadrant | # 1 sec bins | Bins with >0 counts | Bins with >2000 counts | High rate bins dominated by noise | Noise dominated (total time) | Noise dominated (detector-on time) | Marked lightcurve |
|---|---|---|---|---|---|---|---|
| A | 7311 | 5187 | 0 | 0 | 0.00% | 0.00% | 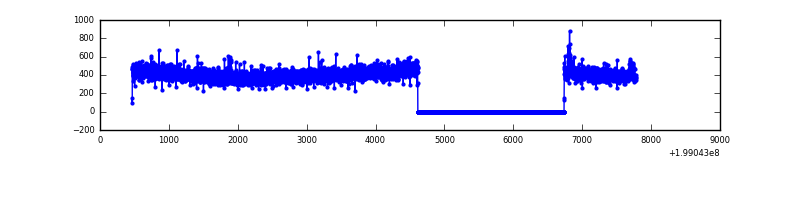 |
| B | 7311 | 5187 | 9 | 9 | 0.12% | 0.17% | 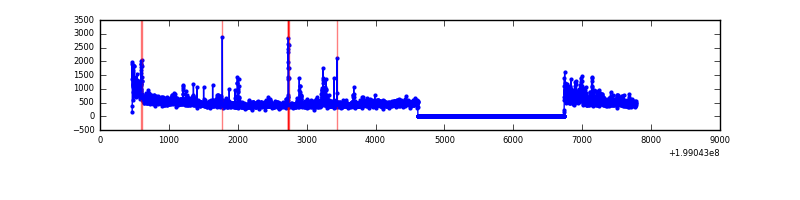 |
| C | 7311 | 5187 | 12 | 12 | 0.16% | 0.23% | 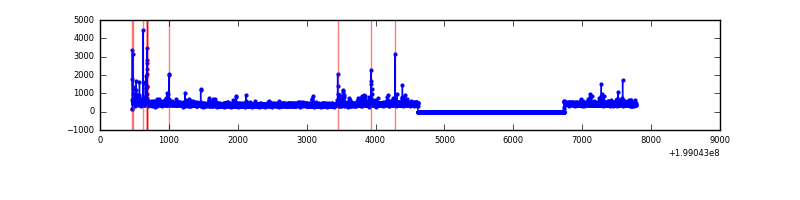 |
| D | 7311 | 5187 | 79 | 79 | 1.08% | 1.52% | 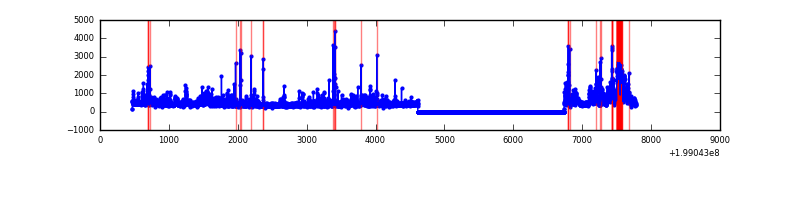 |
Top three noisy pixels from each quadrant. If the there are fewer than three noisy pixels in the level2.evt file, extra rows are filled as -1
| Pixel properties | Quadrant properties | ||||||
|---|---|---|---|---|---|---|---|
| Quadrant | DetID | PixID | Counts | Sigma | Mean | Median | Sigma |
| A | 15 | 174 | 20098 | 182.48 | 529 | 518 | 107.3 |
| A | 8 | 15 | 19362 | 175.62 | 529 | 518 | 107.3 |
| A | 0 | 50 | 8927 | 78.37 | 529 | 518 | 107.3 |
| B | 15 | 204 | 408672 | 3919.25 | 540 | 529 | 104.1 |
| B | 0 | 219 | 43728 | 414.82 | 540 | 529 | 104.1 |
| B | 3 | 0 | 29315 | 276.42 | 540 | 529 | 104.1 |
| C | 14 | 223 | 48629 | 387.94 | 521 | 523 | 124.0 |
| C | 1 | 16 | 43253 | 344.59 | 521 | 523 | 124.0 |
| C | 6 | 80 | 39990 | 318.27 | 521 | 523 | 124.0 |
| D | 13 | 114 | 357276 | 2845.33 | 516 | 501 | 125.4 |
| D | 2 | 152 | 152206 | 1209.87 | 516 | 501 | 125.4 |
| D | 2 | 136 | 90642 | 718.89 | 516 | 501 | 125.4 |
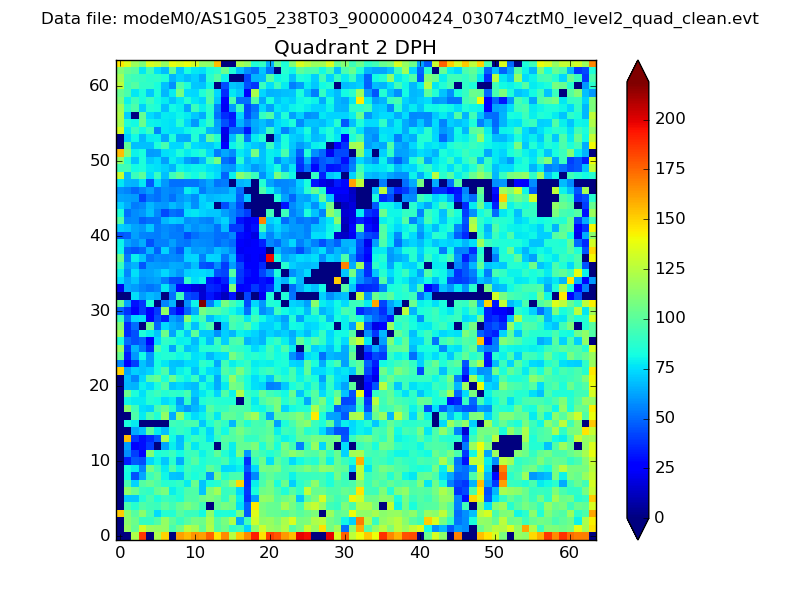
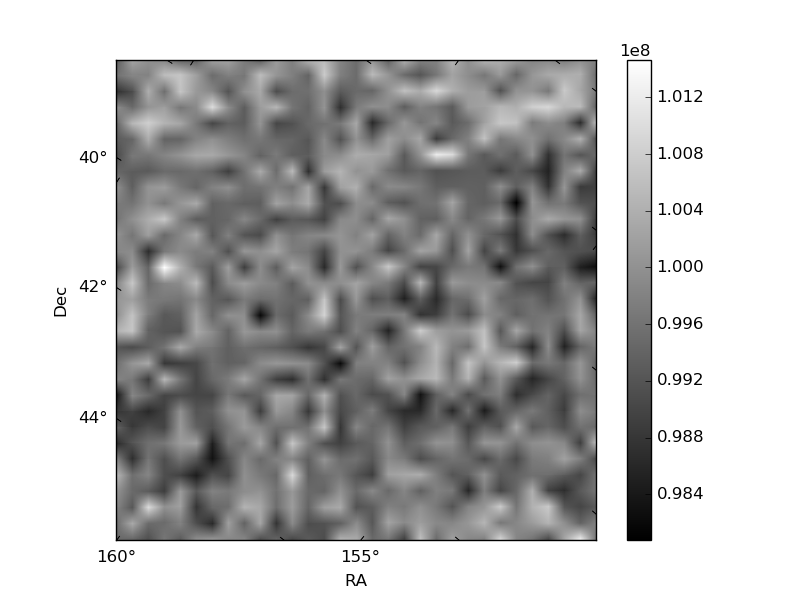
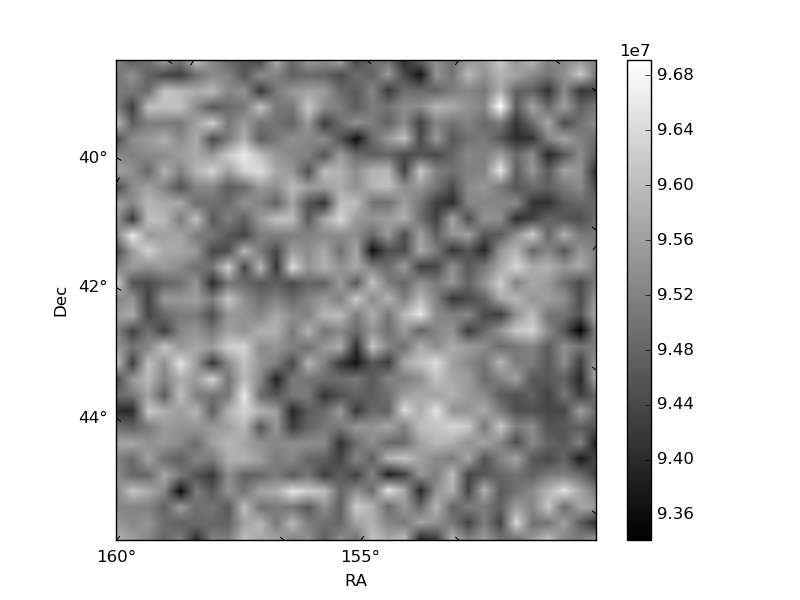
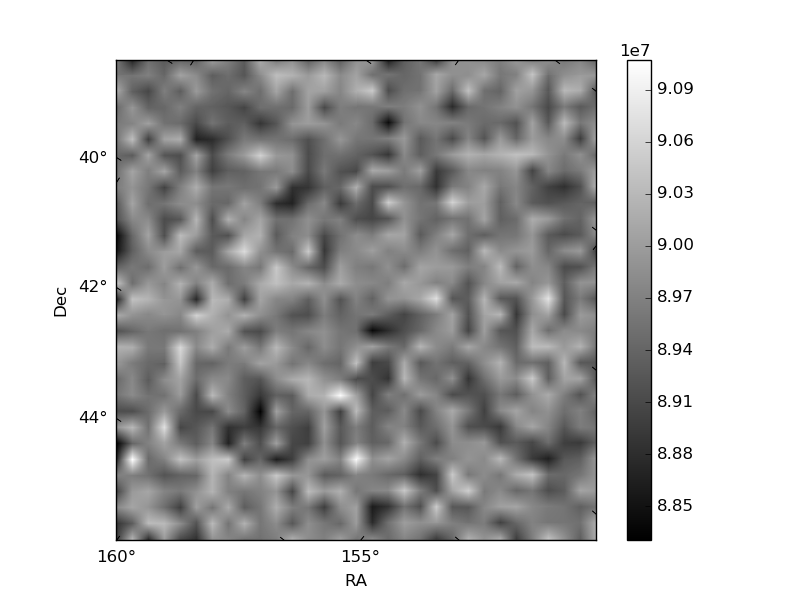
Histogram calculated using DETX and DETY for each event in the final _common_clean file
| Quadrant A | 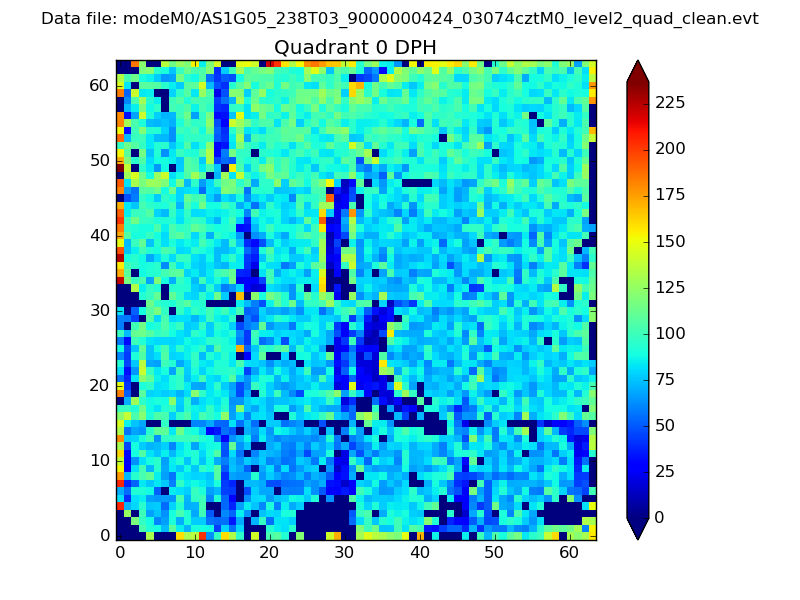 |
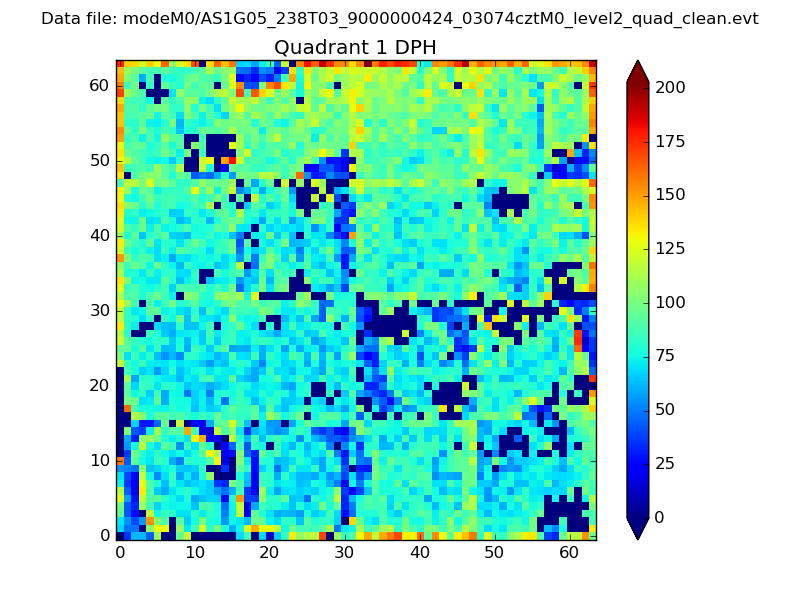 |
Quadrant B |
|---|---|---|---|
| Quadrant D | 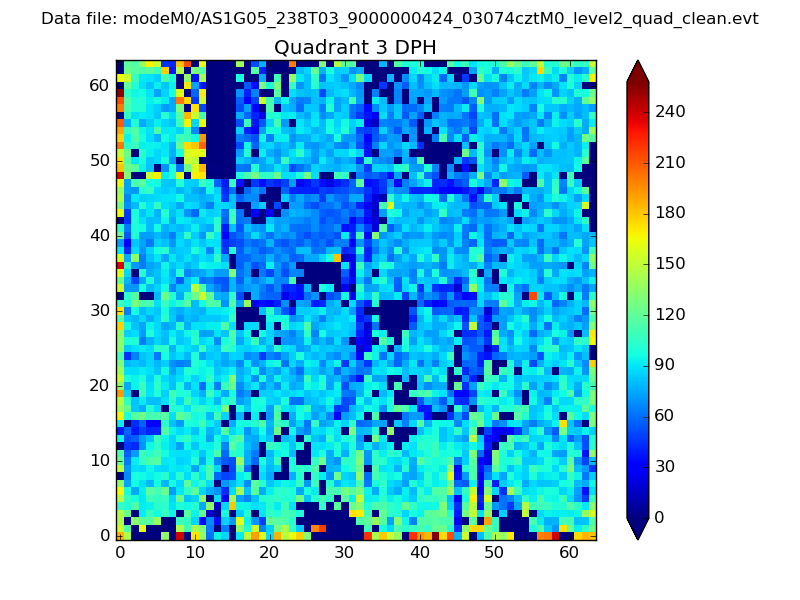 |
 |
Quadrant C |
| Plot type | Count rate plots | Images |
|---|---|---|
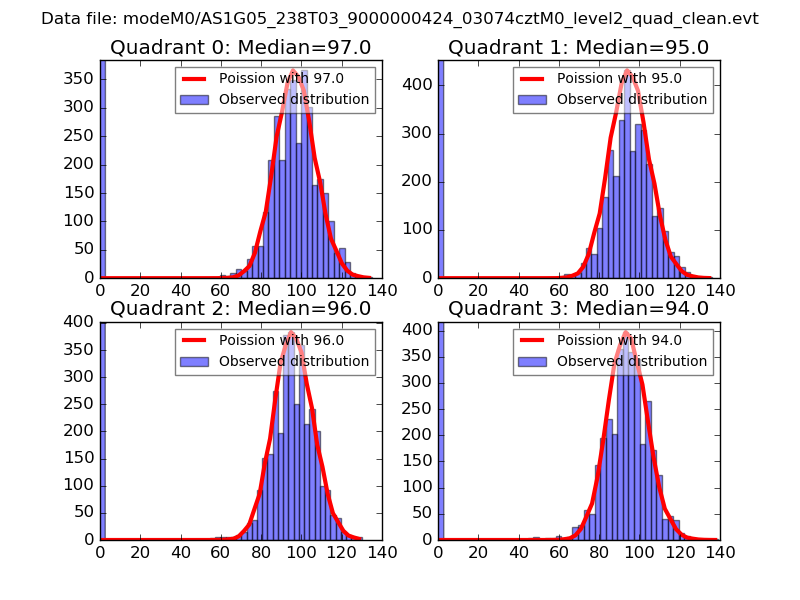
| Comparison with Poisson distribution Blue bars denote a histogram of data divided into 1 sec bins. Red curve is a Poisson curve with rate = median count rate of data. |
 |
 |
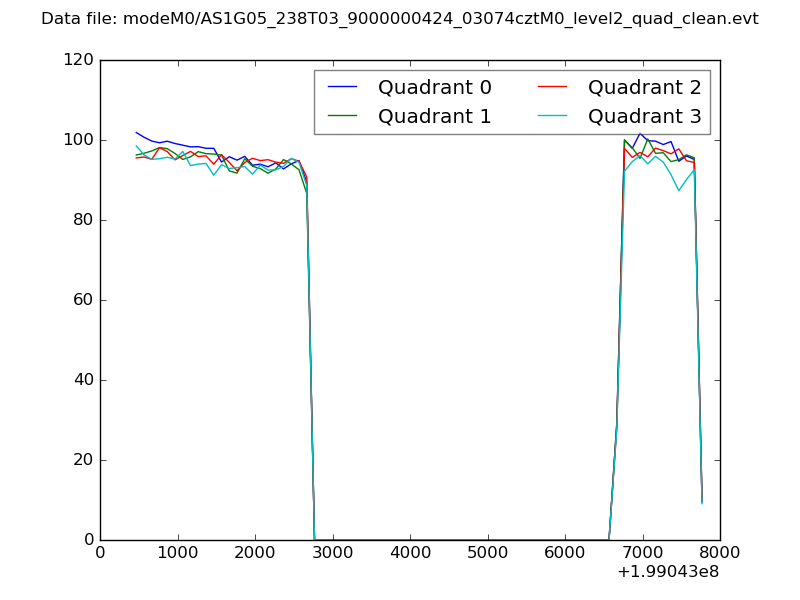
| Quadrant-wise count rates Data is divided into 100 sec bins |
 |
|
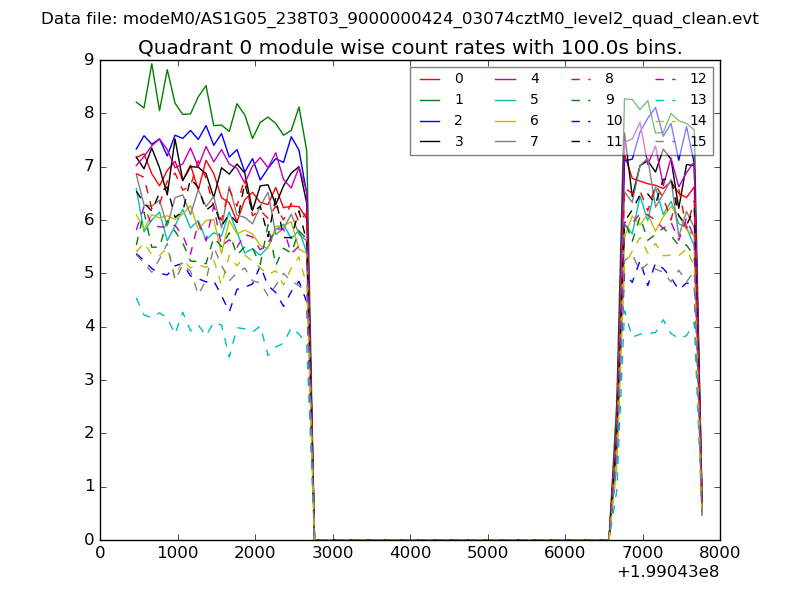
| Module-wise count rates for Quadrant A Data is divided into 100 sec bins |
 |
 |
| Module-wise count rates for Quadrant B Data is divided into 100 sec bins |
 |
 |
| Module-wise count rates for Quadrant C Data is divided into 100 sec bins |
 |
 |
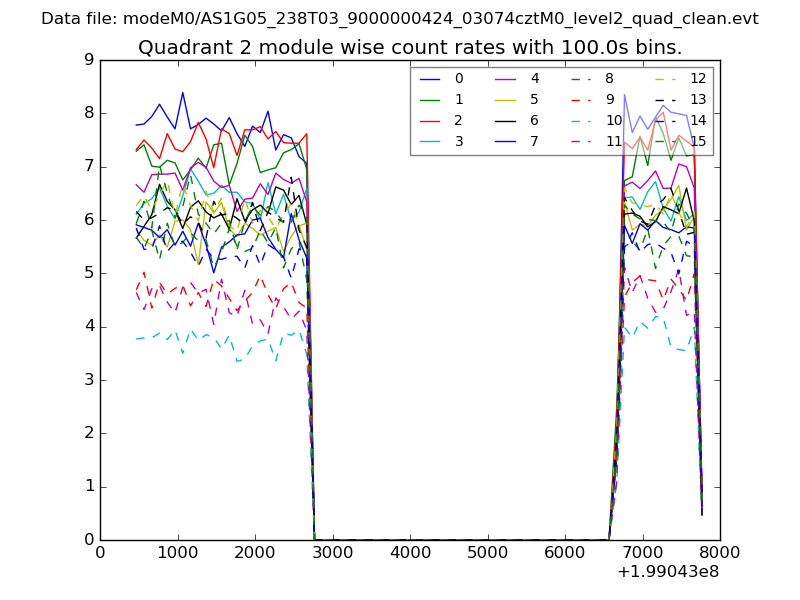
| Module-wise count rates for Quadrant D Data is divided into 100 sec bins |
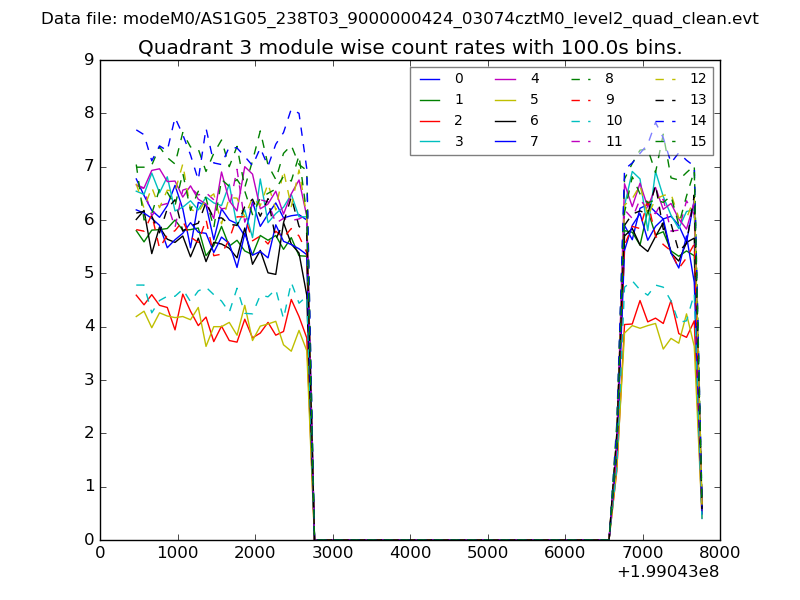 |
 |
| Parameter | Plot |
|---|---|
| CZT HV Monitor | 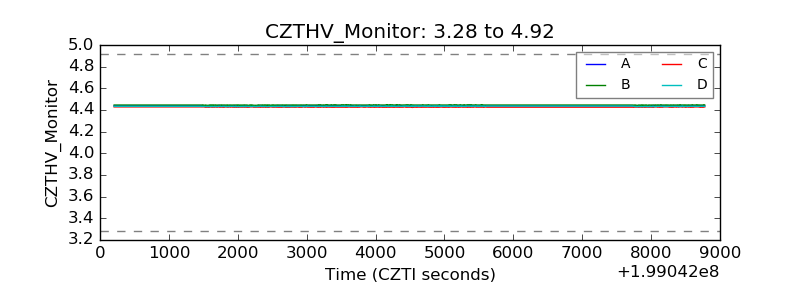 |
| D_VDD | 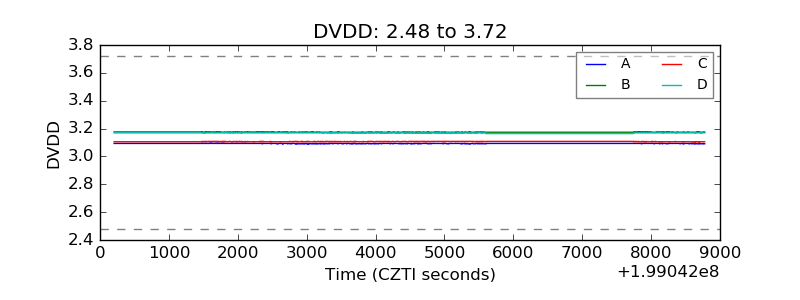 |
| Temperature 1 | 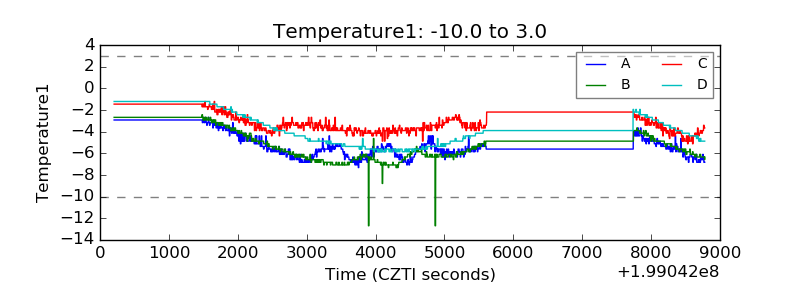 |
| Veto HV Monitor | 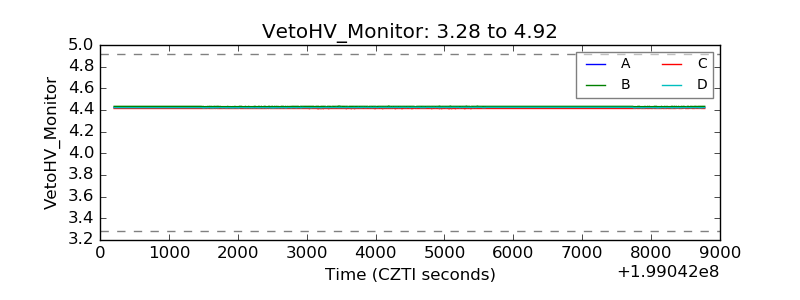 |
| Veto LLD | 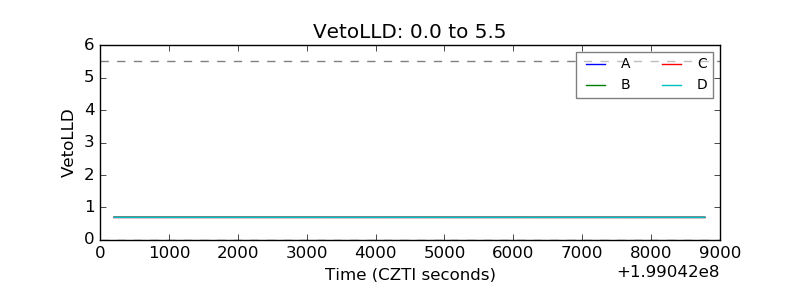 |
| Alpha Counter | 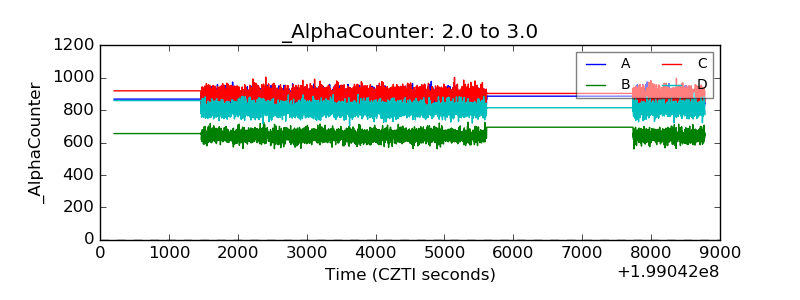 |
| _CPM_Rate | 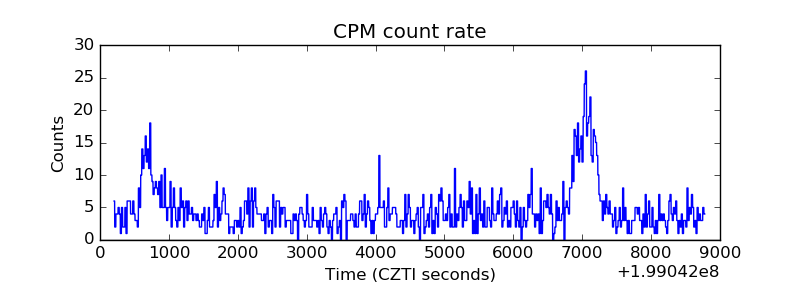 |
| CZT Counter | 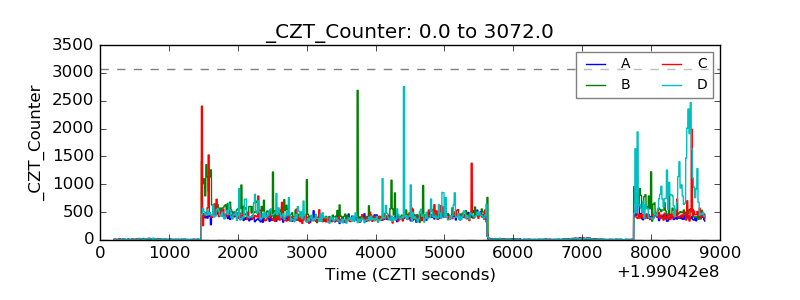 |
| +2.5 Volts monitor | 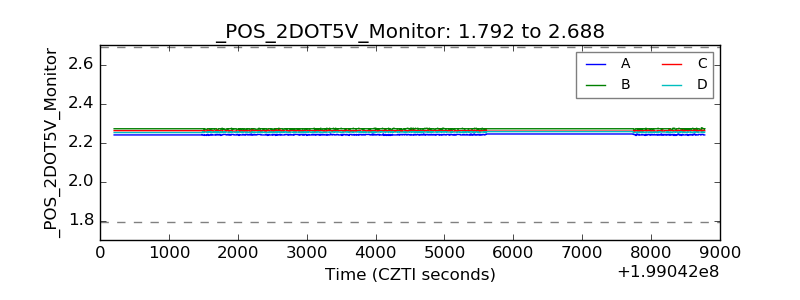 |
| +5 Volts monitor | 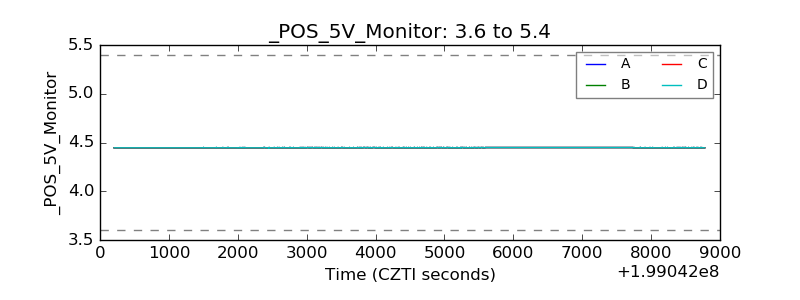 |
| _ROLL_ROT | 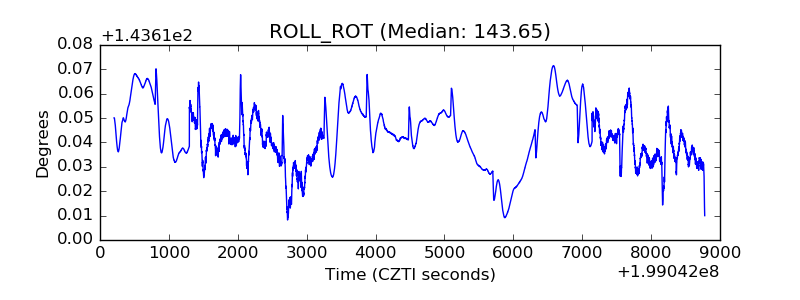 |
| _Roll_DEC | 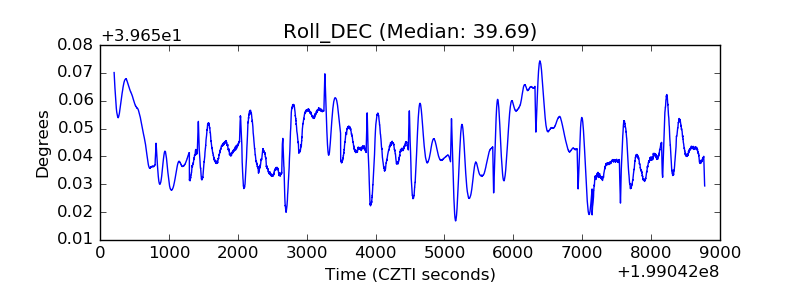 |
| _Roll_RA | 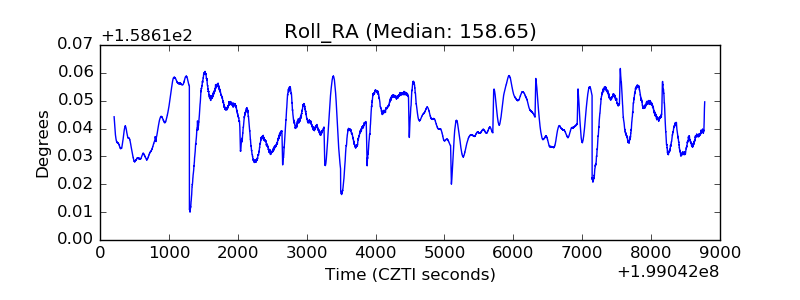 |
| Veto Counter | 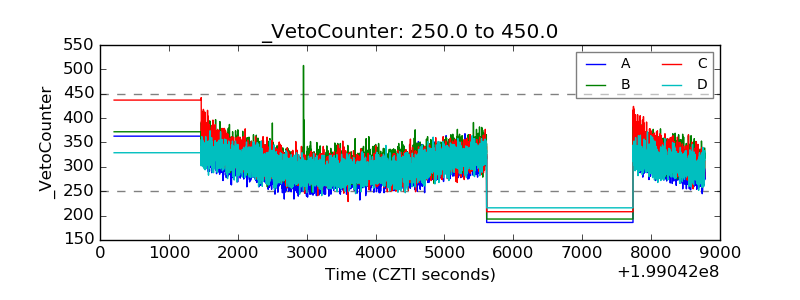 |