| Param | Original file | Final file |
|---|---|---|
| Filename | modeM0/AS1G05_238T03_9000000424_03076cztM0_level2.evt | modeM0/AS1G05_238T03_9000000424_03076cztM0_level2_quad_clean.evt |
| Size (bytes) | 113,693,760 | 24,099,840 |
| Size | 108.4 MB | 23.0 MB |
| Events in quadrant A | 641,086 | 155,637 |
| Events in quadrant B | 856,484 | 153,174 |
| Events in quadrant C | 711,867 | 152,927 |
| Events in quadrant D | 1,121,929 | 149,099 |
| Mode M0 | |||
|---|---|---|---|
| Quadrant | BADHDUFLAG | Total packets | Discarded packets |
| A | 0 | 3221 | 1 |
| B | 0 | 3679 | 1 |
| C | 0 | 3347 | 1 |
| D | 0 | 4507 | 1 |
| Mode M9 | |||
|---|---|---|---|
| Quadrant | BADHDUFLAG | Total packets | Discarded packets |
| A | 0 | 8 | 0 |
| B | 0 | 8 | 0 |
| C | 0 | 8 | 0 |
| D | 0 | 9 | 0 |
| Mode SS | |||
|---|---|---|---|
| Quadrant | BADHDUFLAG | Total packets | Discarded packets |
| A | 0 | 32 | 0 |
| B | 0 | 32 | 0 |
| C | 0 | 32 | 0 |
| D | 0 | 32 | 0 |
| Quadrant | Total seconds | Saturated seconds | Saturation percentage |
|---|---|---|---|
| A | 1606 | 1 | 0.062267% |
| B | 1606 | 3 | 0.186800% |
| C | 1606 | 7 | 0.435866% |
| D | 1606 | 47 | 2.926526% |
Noise dominated data is calculated using 1-second bins in cleaned event files. If a bin has >2000 counts, and if more than 50% of those come from <1% of pixels, then it is considered to be noise-dominated and hence unusable.
| Quadrant | # 1 sec bins | Bins with >0 counts | Bins with >2000 counts | High rate bins dominated by noise | Noise dominated (total time) | Noise dominated (detector-on time) | Marked lightcurve |
|---|---|---|---|---|---|---|---|
| A | 1606 | 1606 | 0 | 0 | 0.00% | 0.00% | 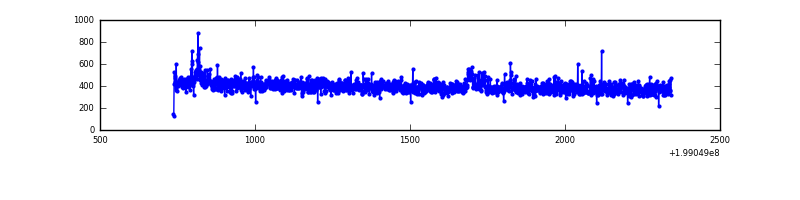 |
| B | 1606 | 1606 | 0 | 0 | 0.00% | 0.00% | 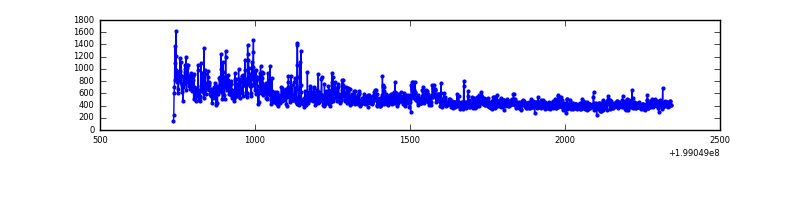 |
| C | 1606 | 1606 | 4 | 4 | 0.25% | 0.25% | 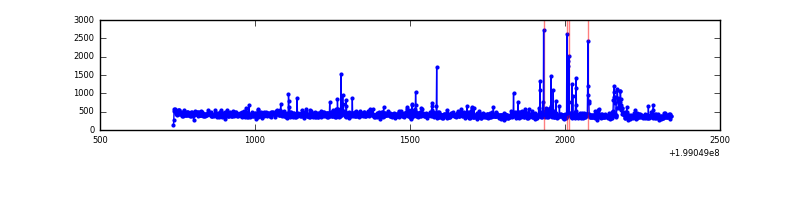 |
| D | 1606 | 1606 | 63 | 63 | 3.92% | 3.92% | 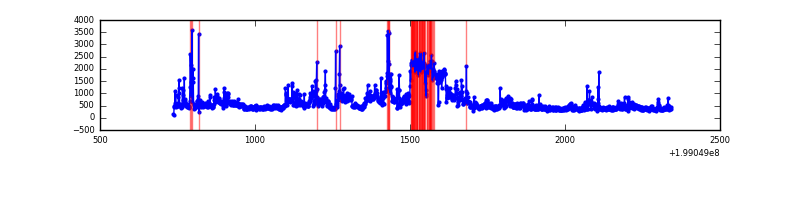 |
Top three noisy pixels from each quadrant. If the there are fewer than three noisy pixels in the level2.evt file, extra rows are filled as -1
| Pixel properties | Quadrant properties | ||||||
|---|---|---|---|---|---|---|---|
| Quadrant | DetID | PixID | Counts | Sigma | Mean | Median | Sigma |
| A | 8 | 15 | 8655 | 243.74 | 160 | 157 | 34.9 |
| A | 0 | 50 | 5368 | 149.46 | 160 | 157 | 34.9 |
| A | 12 | 189 | 2877 | 78.02 | 160 | 157 | 34.9 |
| B | 15 | 204 | 168573 | 5053.47 | 164 | 160 | 33.3 |
| B | 0 | 219 | 18662 | 555.18 | 164 | 160 | 33.3 |
| B | 2 | 249 | 14212 | 421.65 | 164 | 160 | 33.3 |
| C | 14 | 223 | 23120 | 577.11 | 160 | 160 | 39.8 |
| C | 1 | 16 | 19240 | 479.58 | 160 | 160 | 39.8 |
| C | 6 | 80 | 18019 | 448.89 | 160 | 160 | 39.8 |
| D | 13 | 114 | 352102 | 8683.81 | 158 | 153 | 40.5 |
| D | 10 | 213 | 65654 | 1616.14 | 158 | 153 | 40.5 |
| D | 2 | 136 | 37948 | 932.53 | 158 | 153 | 40.5 |
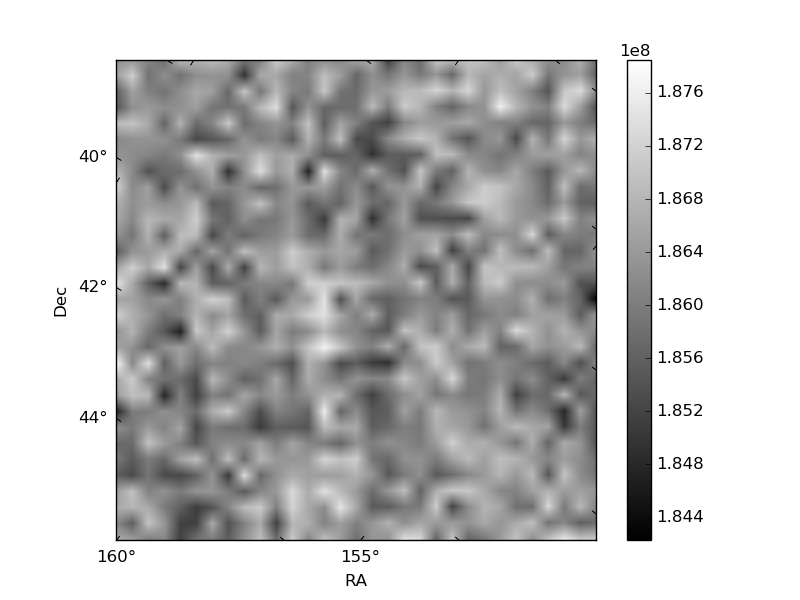
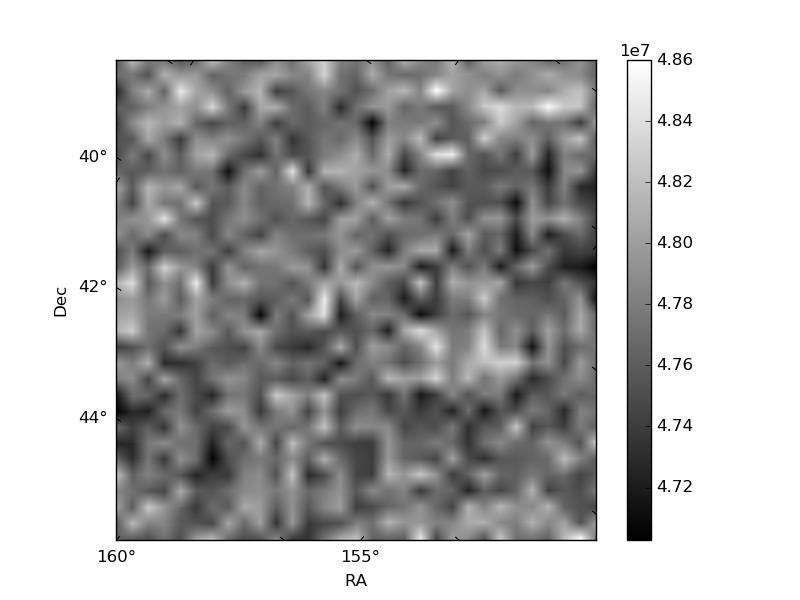
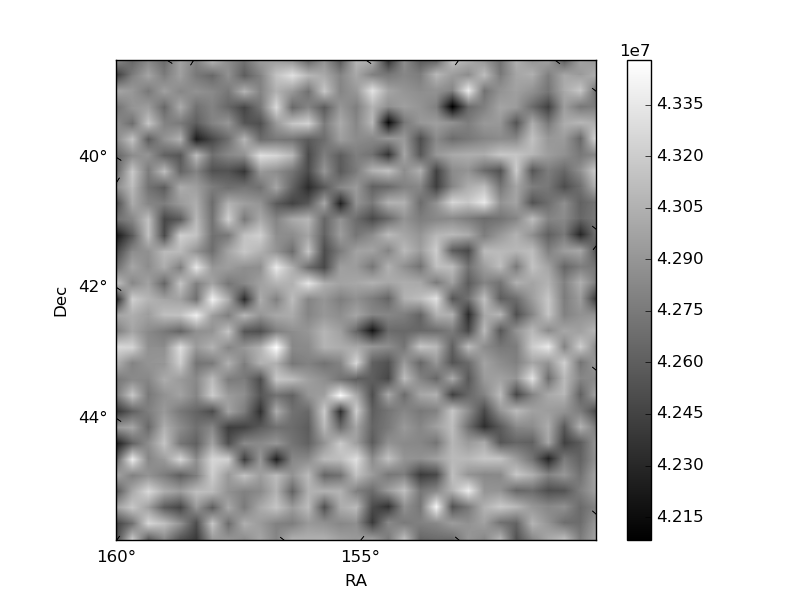
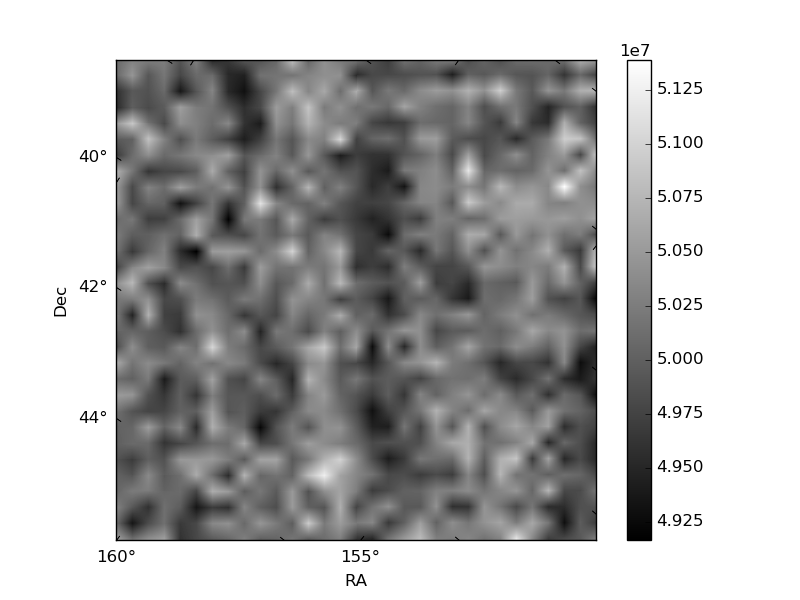
Histogram calculated using DETX and DETY for each event in the final _common_clean file
| Quadrant A | 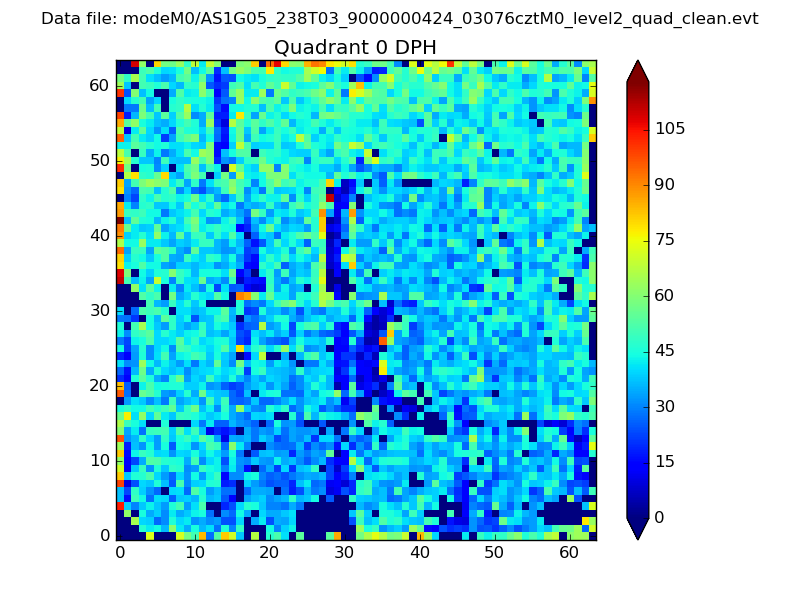 |
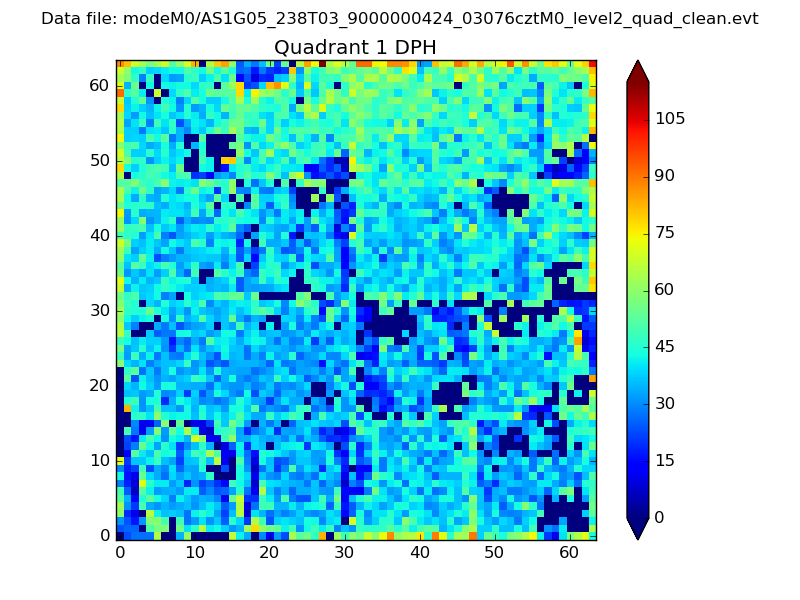 |
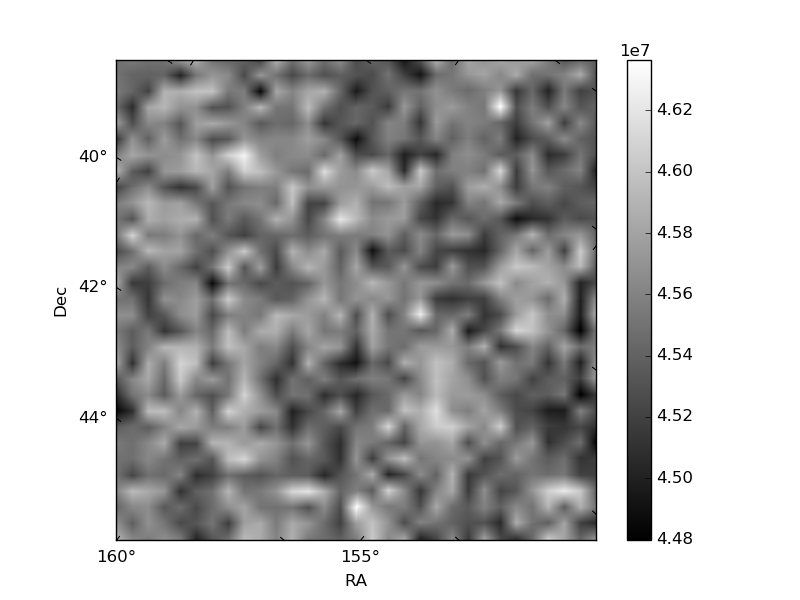
Quadrant B |
|---|---|---|---|
| Quadrant D | 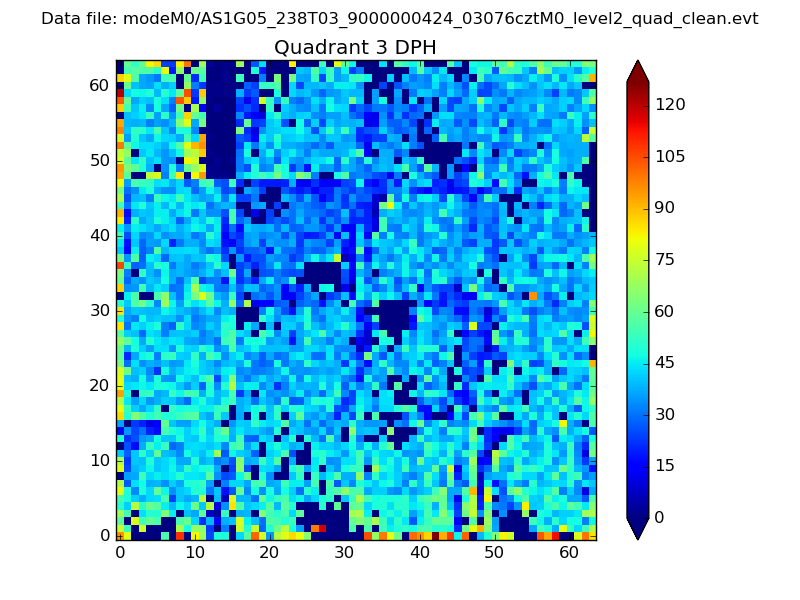 |
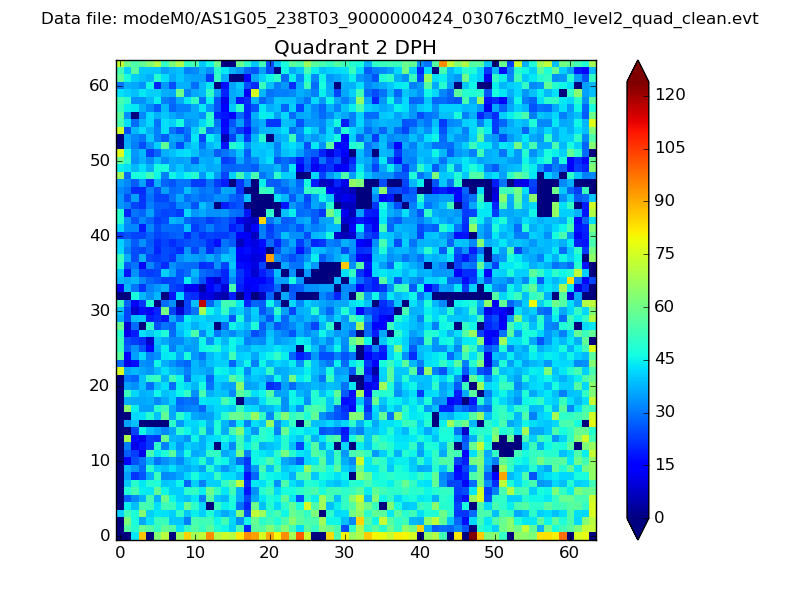 |
Quadrant C |
| Plot type | Count rate plots | Images |
|---|---|---|
| Comparison with Poisson distribution Blue bars denote a histogram of data divided into 1 sec bins. Red curve is a Poisson curve with rate = median count rate of data. |
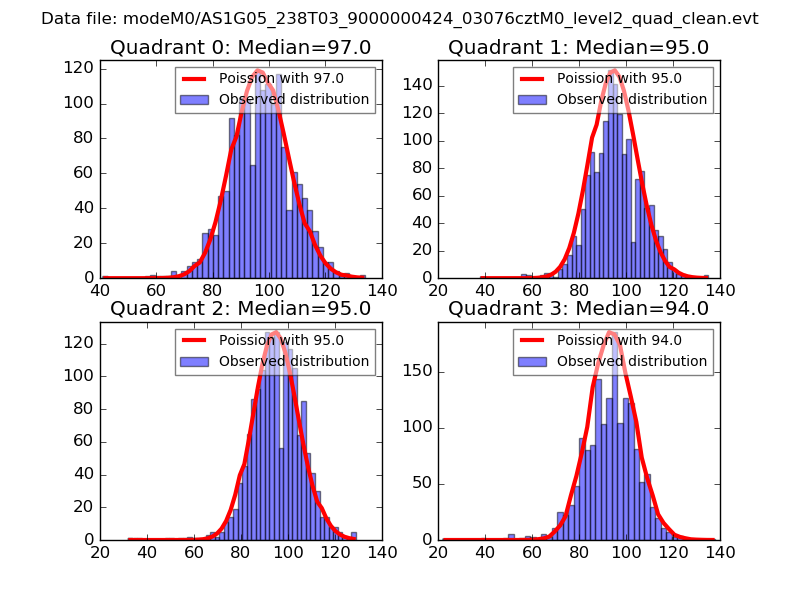 |
 |
| Quadrant-wise count rates Data is divided into 100 sec bins |
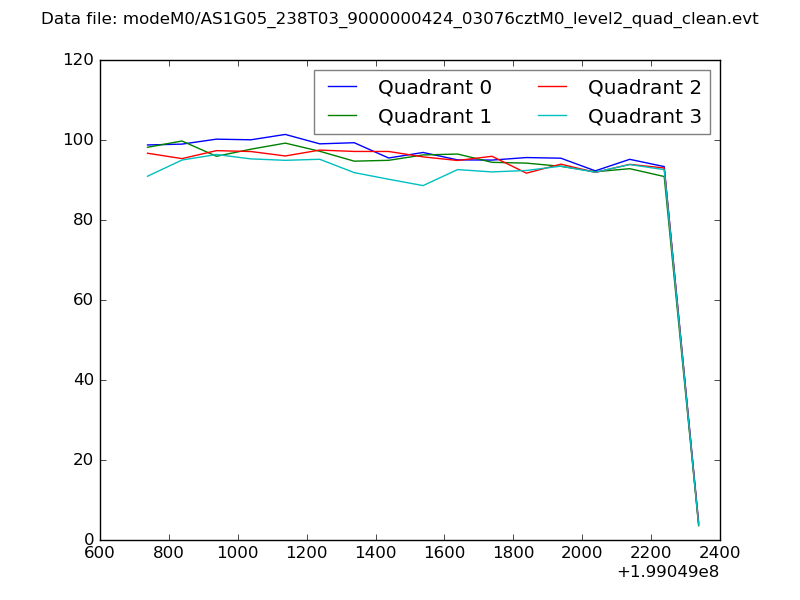 |
|
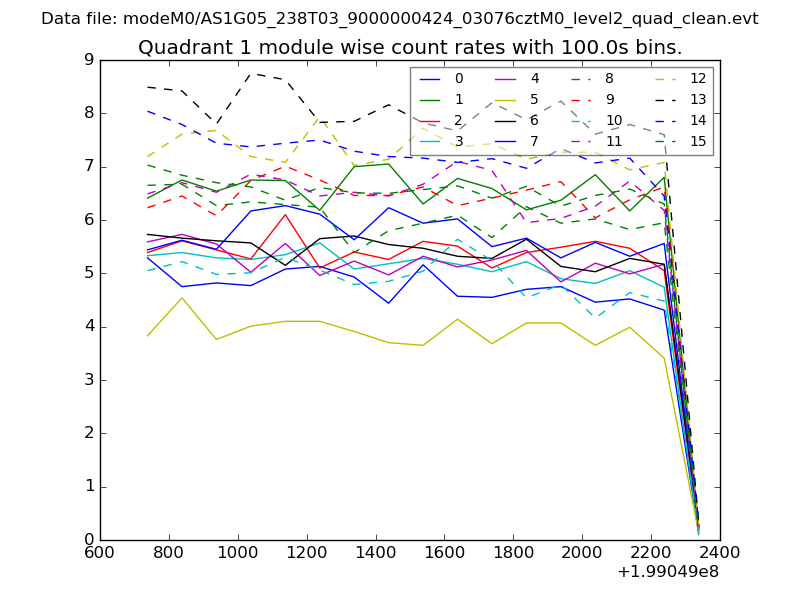
| Module-wise count rates for Quadrant A Data is divided into 100 sec bins |
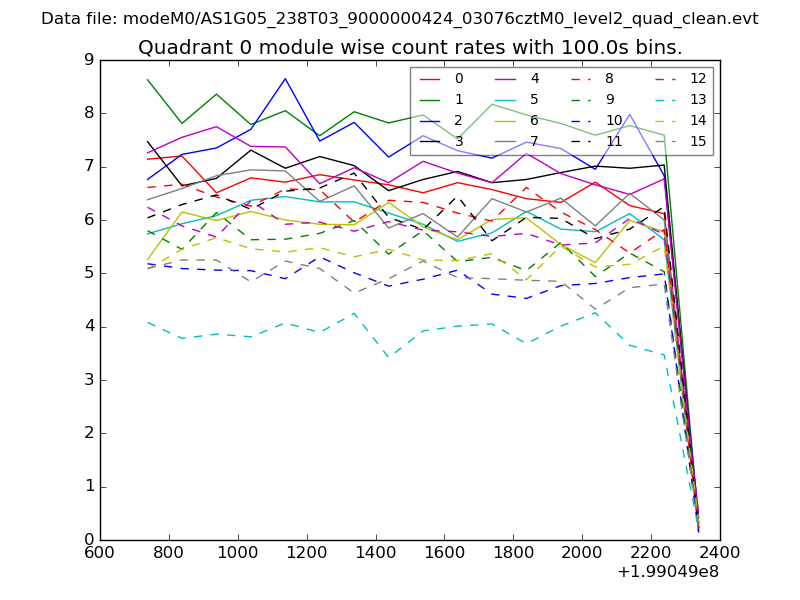 |
 |
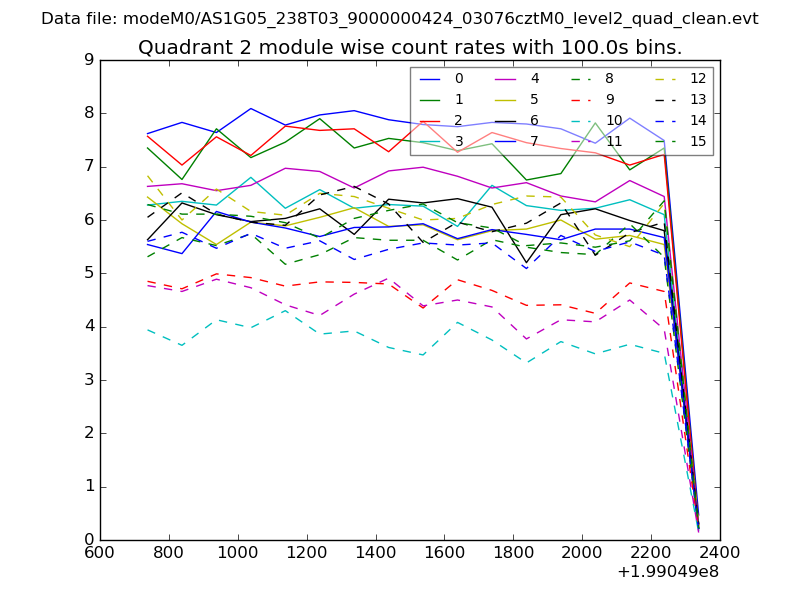
| Module-wise count rates for Quadrant B Data is divided into 100 sec bins |
 |
 |
| Module-wise count rates for Quadrant C Data is divided into 100 sec bins |
 |
 |
| Module-wise count rates for Quadrant D Data is divided into 100 sec bins |
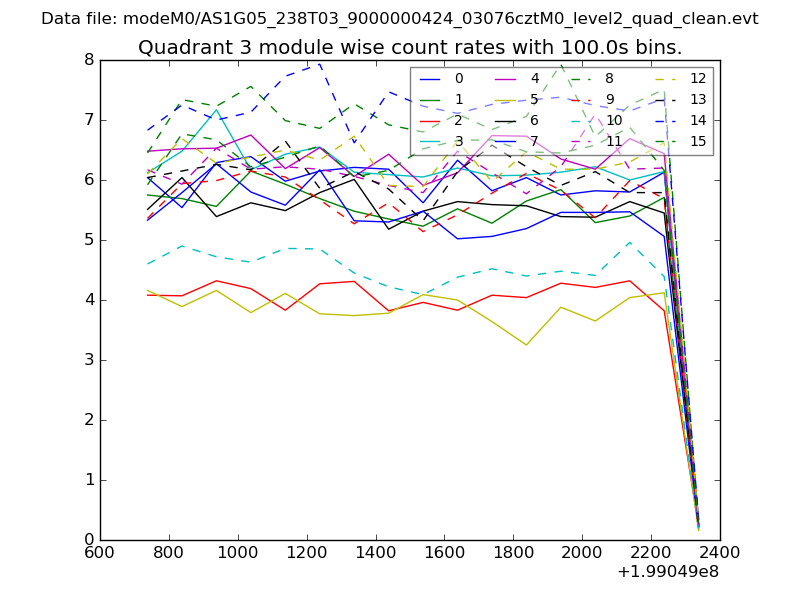 |
 |
| Parameter | Plot |
|---|---|
| CZT HV Monitor | 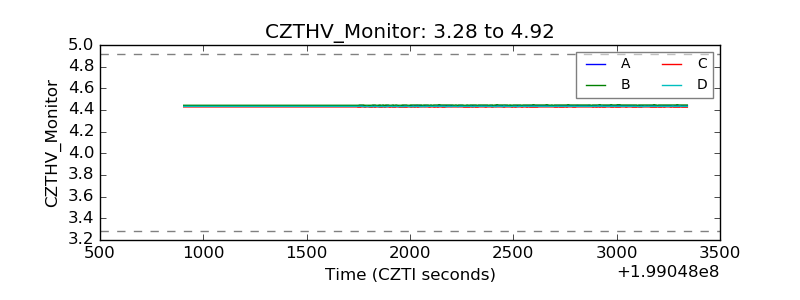 |
| D_VDD | 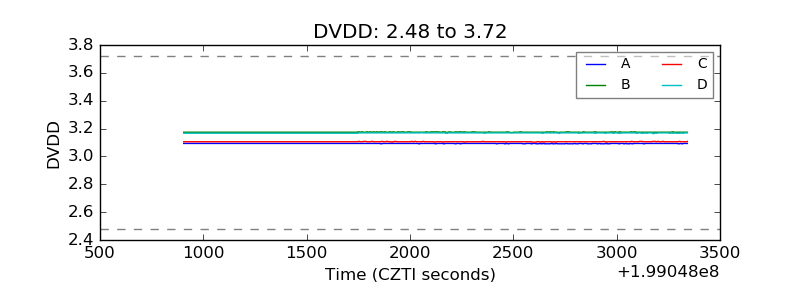 |
| Temperature 1 | 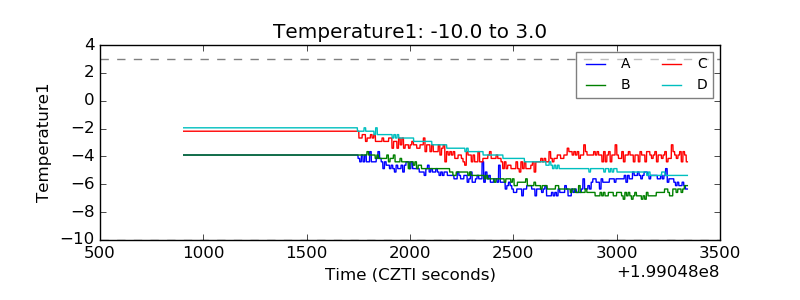 |
| Veto HV Monitor | 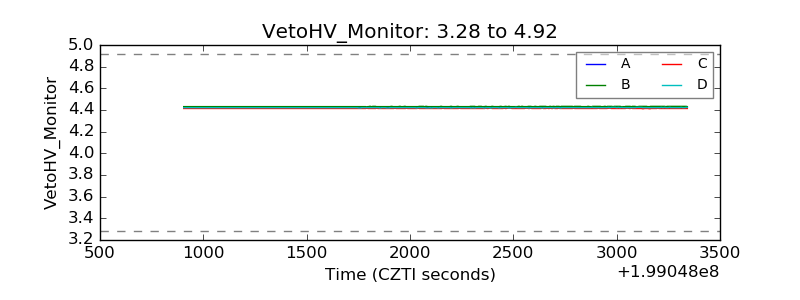 |
| Veto LLD | 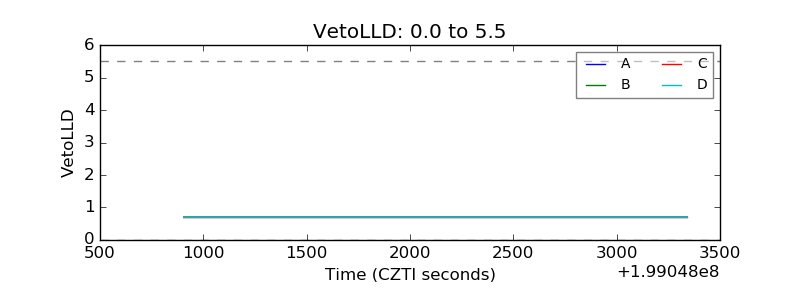 |
| Alpha Counter | 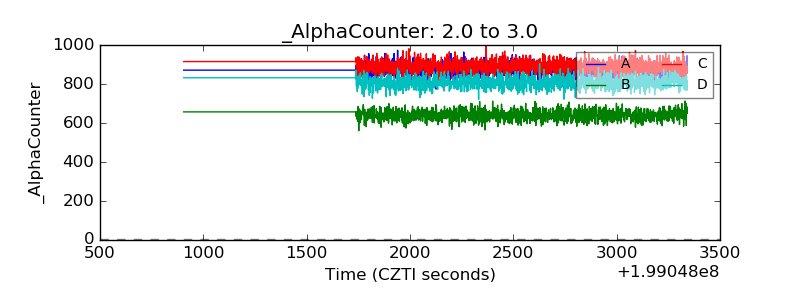 |
| _CPM_Rate | 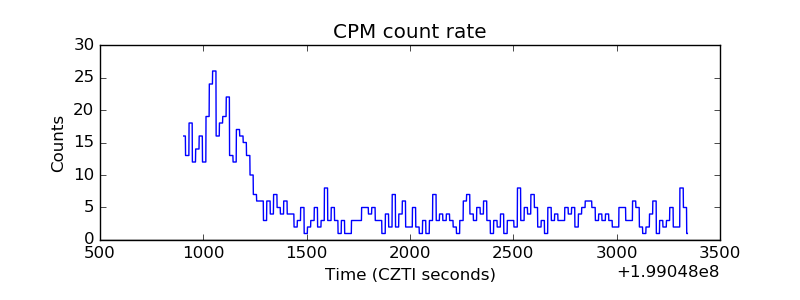 |
| CZT Counter | 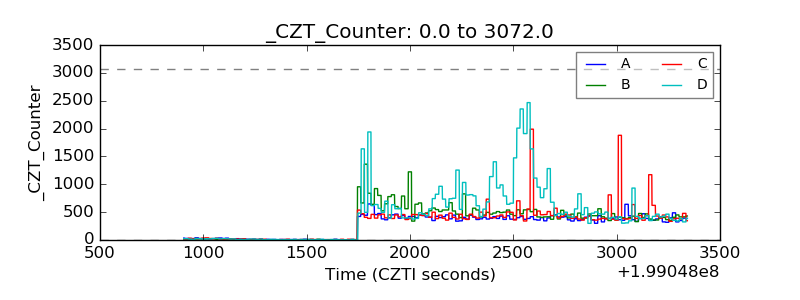 |
| +2.5 Volts monitor |  |
| +5 Volts monitor |  |
| _ROLL_ROT | 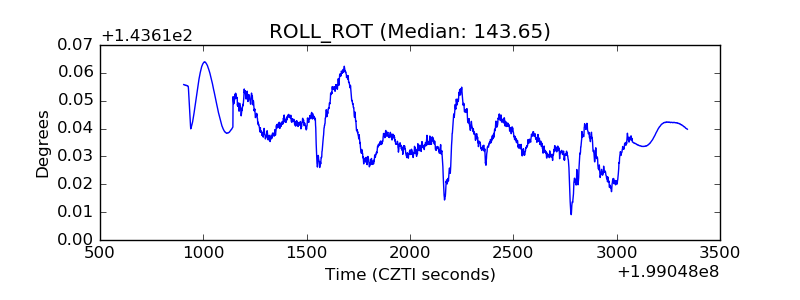 |
| _Roll_DEC | 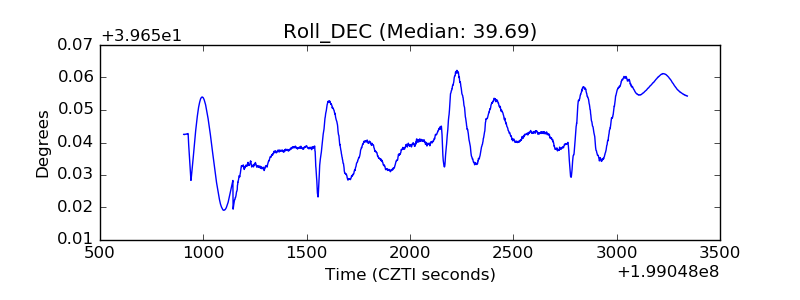 |
| _Roll_RA | 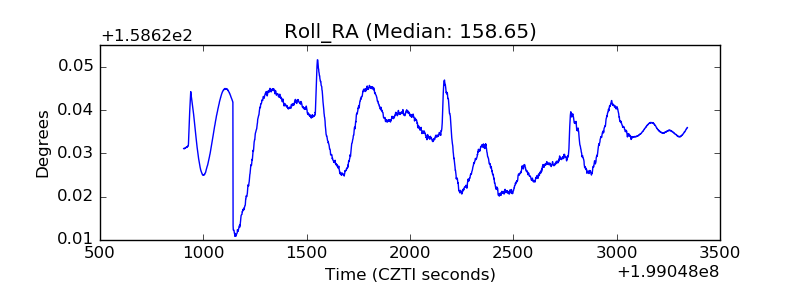 |
| Veto Counter | 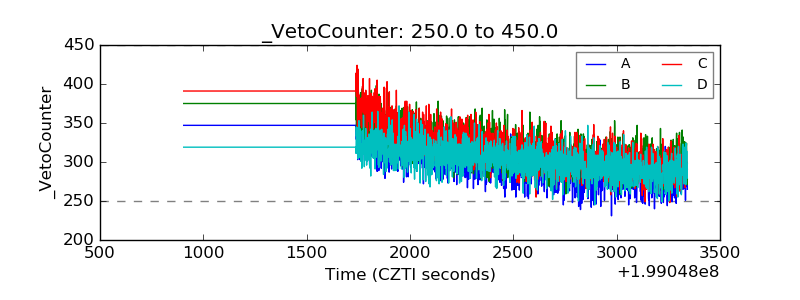 |