| Param | Original file | Final file |
|---|---|---|
| Filename | modeM0/AS1G05_237T03_9000000426cztM0_level2.fits | modeM0/AS1G05_237T03_9000000426cztM0_level2_quad_clean.evt |
| Size (bytes) | 1,492,951,680 | 1,737,218,880 |
| Size | 1.4 GB | 1.6 GB |
| Events in quadrant A | 8,995,640 | 10,814,370 |
| Events in quadrant B | 8,378,440 | 10,395,619 |
| Events in quadrant C | 8,693,518 | 10,260,727 |
| Events in quadrant D | 7,513,386 | 9,522,182 |
| Mode M9 | |||
|---|---|---|---|
| Quadrant | BADHDUFLAG | Total packets | Discarded packets |
| A | 0 | 343 | 0 |
| B | 0 | 343 | 0 |
| C | 0 | 343 | 0 |
| D | 0 | 343 | 0 |
| Mode M0 | |||
|---|---|---|---|
| Quadrant | BADHDUFLAG | Total packets | Discarded packets |
| A | 0 | 370374 | 0 |
| B | 0 | 410355 | 0 |
| C | 0 | 412805 | 0 |
| D | 0 | 412100 | 0 |
| Mode SS | |||
|---|---|---|---|
| Quadrant | BADHDUFLAG | Total packets | Discarded packets |
| A | 0 | 3460 | 0 |
| B | 0 | 3460 | 0 |
| C | 0 | 3460 | 0 |
| D | 0 | 3460 | 0 |
| Quadrant | Total seconds | Saturated seconds | Saturation percentage |
|---|---|---|---|
| A | 169679 | 3018 | 1.778653% |
| B | 169655 | 8632 | 5.087973% |
| C | 169650 | 5851 | 3.448865% |
| D | 169671 | 5525 | 3.256302% |
Noise dominated data is calculated using 1-second bins in cleaned event files. If a bin has >2000 counts, and if more than 50% of those come from <1% of pixels, then it is considered to be noise-dominated and hence unusable.
| Quadrant | # 1 sec bins | Bins with >0 counts | Bins with >2000 counts | High rate bins dominated by noise | Noise dominated (total time) | Noise dominated (detector-on time) | Marked lightcurve |
|---|---|---|---|---|---|---|---|
| A | 204458 | 169703 | 0 | 0 | 0.00% | 0.00% | 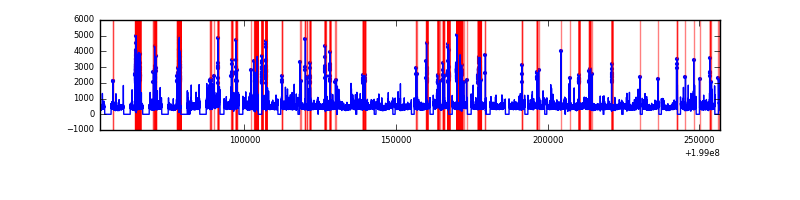 |
| B | 204458 | 165795 | 0 | 0 | 0.00% | 0.00% |  |
| C | 204458 | 169524 | 0 | 0 | 0.00% | 0.00% |  |
| D | 204458 | 169687 | 0 | 0 | 0.00% | 0.00% |  |
Top three noisy pixels from each quadrant. If the there are fewer than three noisy pixels in the level2.evt file, extra rows are filled as -1
| Pixel properties | Quadrant properties | ||||||
|---|---|---|---|---|---|---|---|
| Quadrant | DetID | PixID | Counts | Sigma | Mean | Median | Sigma |
| A | 0 | 29 | 7994 | 9.59 | 2341 | 2182 | 606.2 |
| A | 7 | 110 | 7930 | 9.48 | 2341 | 2182 | 606.2 |
| A | 9 | 19 | 7008 | 7.96 | 2341 | 2182 | 606.2 |
| B | 2 | 9 | 7450 | 12.1 | 2220 | 2119 | 440.6 |
| B | 12 | 226 | 6748 | 10.51 | 2220 | 2119 | 440.6 |
| B | 5 | 128 | 5919 | 8.62 | 2220 | 2119 | 440.6 |
| C | 1 | 80 | 7025 | 7.97 | 2302 | 2126 | 614.9 |
| C | 1 | 81 | 6976 | 7.89 | 2302 | 2126 | 614.9 |
| C | 9 | 188 | 5970 | 6.25 | 2302 | 2126 | 614.9 |
| D | 3 | 14 | 5750 | 6.6 | 2152 | 1952 | 575.5 |
| D | 6 | 44 | 5682 | 6.48 | 2152 | 1952 | 575.5 |
| D | 6 | 231 | 5652 | 6.43 | 2152 | 1952 | 575.5 |
Histogram calculated using DETX and DETY for each event in the final _common_clean file
| Quadrant A | 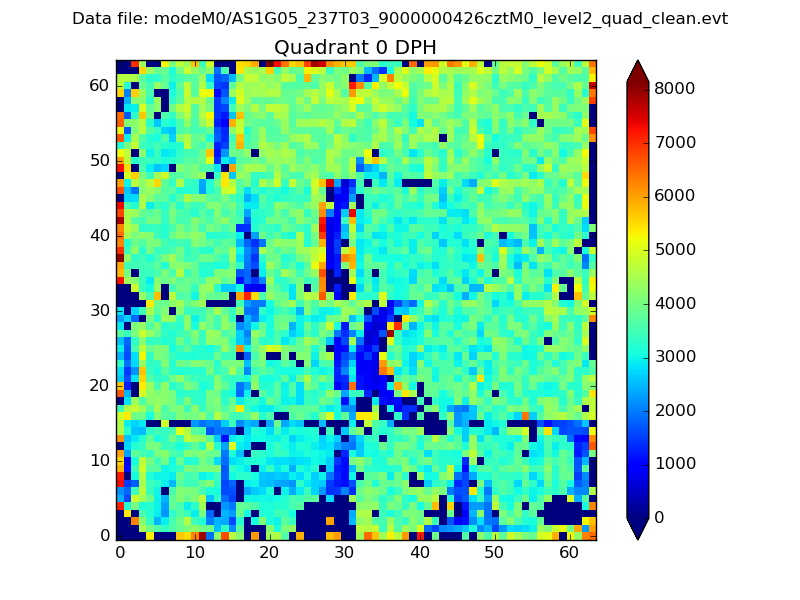 |
 |
Quadrant B |
|---|---|---|---|
| Quadrant D |  |
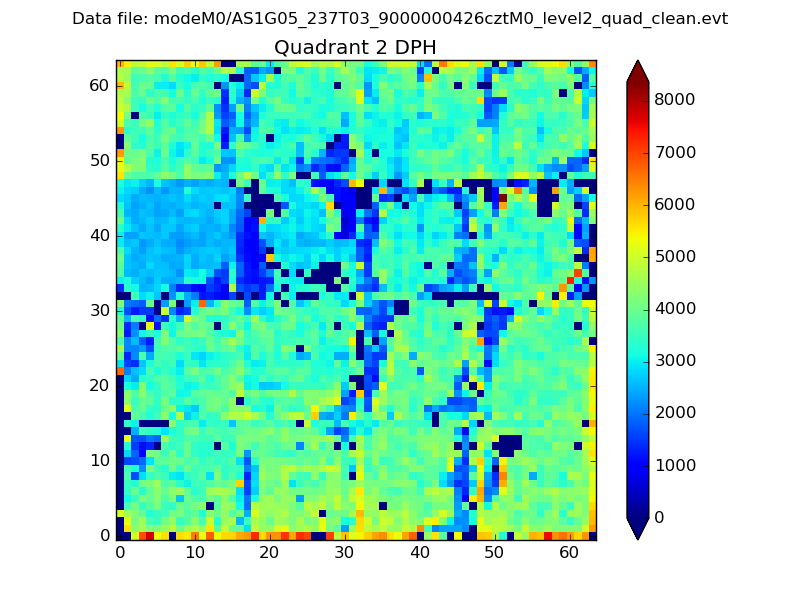 |
Quadrant C |
| Plot type | Count rate plots | Images |
|---|---|---|
| Comparison with Poisson distribution Blue bars denote a histogram of data divided into 1 sec bins. Red curve is a Poisson curve with rate = median count rate of data. |
 |
 |
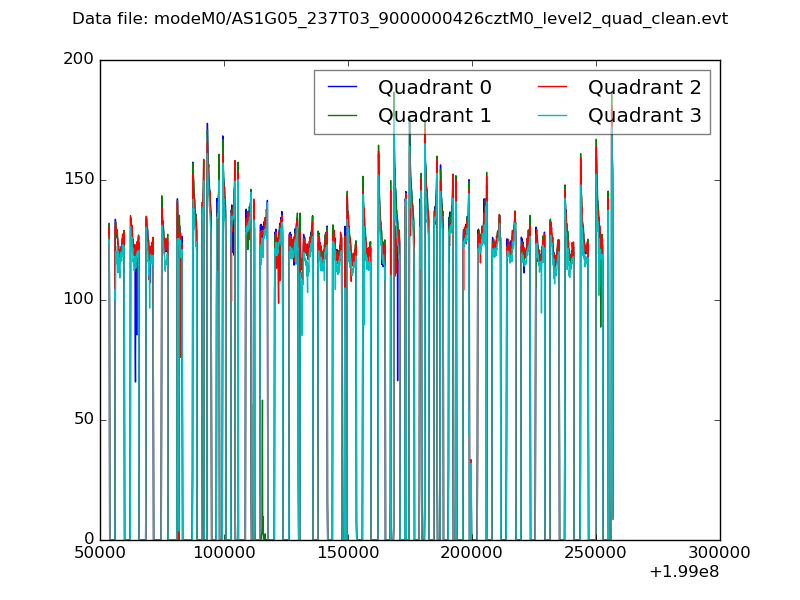
| Quadrant-wise count rates Data is divided into 100 sec bins |
 |
|
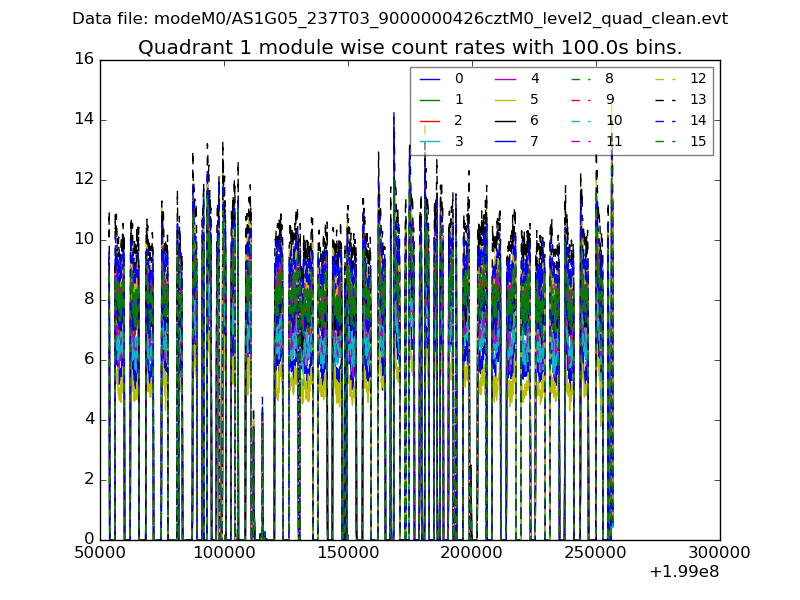
| Module-wise count rates for Quadrant A Data is divided into 100 sec bins |
 |
 |
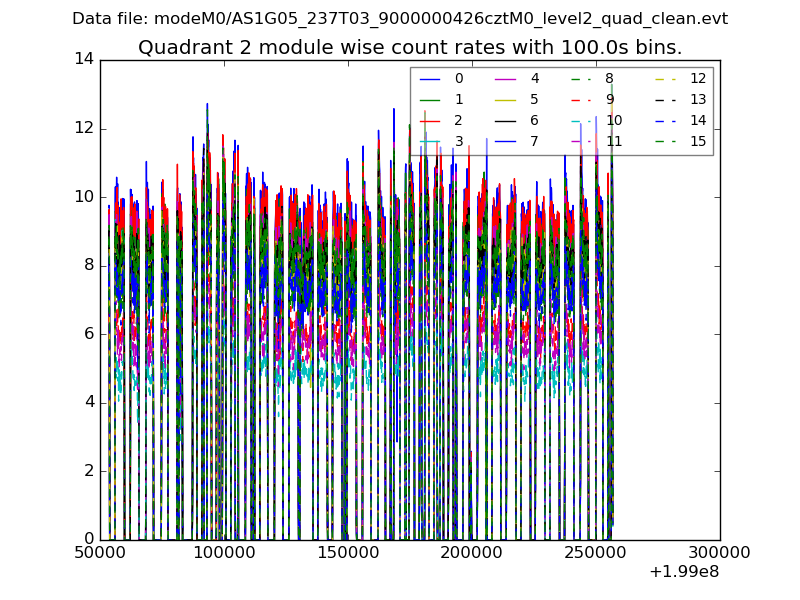
| Module-wise count rates for Quadrant B Data is divided into 100 sec bins |
 |
 |
| Module-wise count rates for Quadrant C Data is divided into 100 sec bins |
 |
 |
| Module-wise count rates for Quadrant D Data is divided into 100 sec bins |
 |
 |
| Parameter | Plot |
|---|---|
| CZT HV Monitor |  |
| D_VDD | 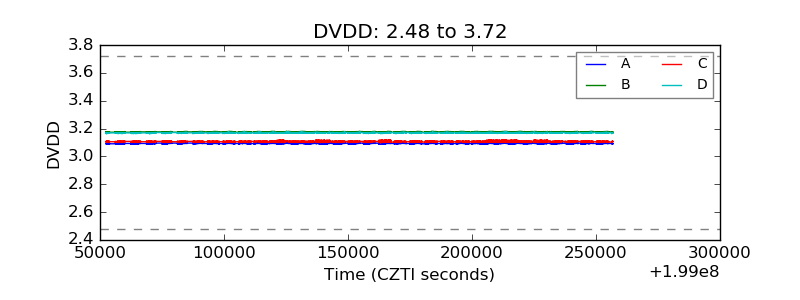 |
| Temperature 1 | 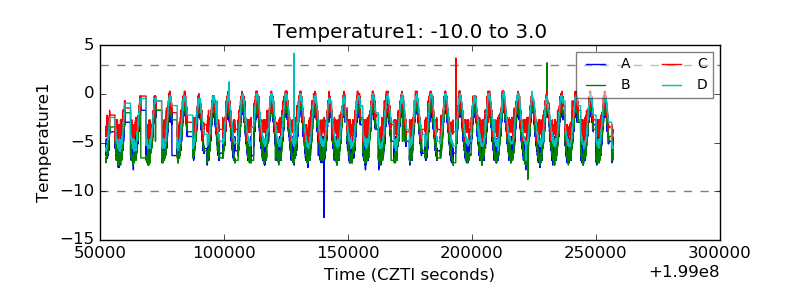 |
| Veto HV Monitor | 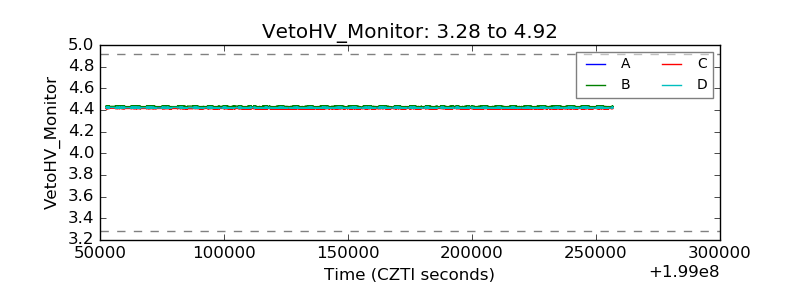 |
| Veto LLD |  |
| Alpha Counter |  |
| _CPM_Rate |  |
| CZT Counter |  |
| +2.5 Volts monitor | 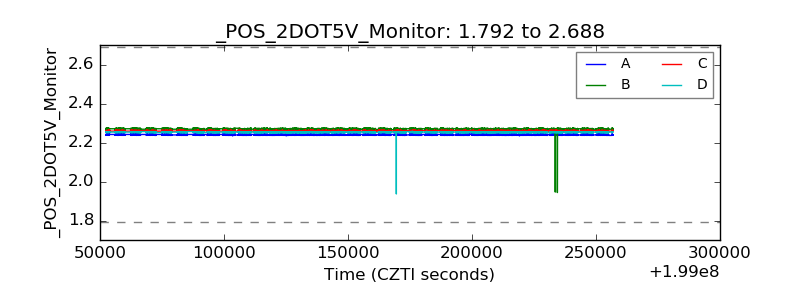 |
| +5 Volts monitor |  |
| _ROLL_ROT |  |
| _Roll_DEC |  |
| _Roll_RA |  |
| Veto Counter |  |