| Param | Original file | Final file |
|---|---|---|
| Filename | modeM0/AS1G05_237T03_9000000426_03077cztM0_level2.evt | modeM0/AS1G05_237T03_9000000426_03077cztM0_level2_quad_clean.evt |
| Size (bytes) | 575,363,520 | 137,243,520 |
| Size | 548.7 MB | 130.9 MB |
| Events in quadrant A | 4,468,930 | 891,202 |
| Events in quadrant B | 4,348,687 | 909,317 |
| Events in quadrant C | 3,925,292 | 907,982 |
| Events in quadrant D | 4,118,964 | 872,003 |
| Mode M9 | |||
|---|---|---|---|
| Quadrant | BADHDUFLAG | Total packets | Discarded packets |
| A | 0 | 43 | 0 |
| B | 0 | 43 | 0 |
| C | 0 | 43 | 0 |
| D | 0 | 43 | 0 |
| Mode M0 | |||
|---|---|---|---|
| Quadrant | BADHDUFLAG | Total packets | Discarded packets |
| A | 0 | 19386 | 3 |
| B | 0 | 18449 | 2 |
| C | 0 | 18010 | 2 |
| D | 0 | 18671 | 2 |
| Mode SS | |||
|---|---|---|---|
| Quadrant | BADHDUFLAG | Total packets | Discarded packets |
| A | 0 | 170 | 0 |
| B | 0 | 170 | 0 |
| C | 0 | 170 | 0 |
| D | 0 | 170 | 0 |
| Quadrant | Total seconds | Saturated seconds | Saturation percentage |
|---|---|---|---|
| A | 8294 | 292 | 3.520617% |
| B | 8294 | 25 | 0.301423% |
| C | 8294 | 125 | 1.507114% |
| D | 8294 | 101 | 1.217748% |
Noise dominated data is calculated using 1-second bins in cleaned event files. If a bin has >2000 counts, and if more than 50% of those come from <1% of pixels, then it is considered to be noise-dominated and hence unusable.
| Quadrant | # 1 sec bins | Bins with >0 counts | Bins with >2000 counts | High rate bins dominated by noise | Noise dominated (total time) | Noise dominated (detector-on time) | Marked lightcurve |
|---|---|---|---|---|---|---|---|
| A | 12603 | 8296 | 262 | 262 | 2.08% | 3.16% | 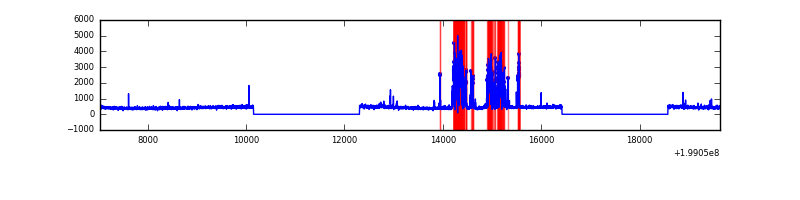 |
| B | 12603 | 8296 | 13 | 13 | 0.10% | 0.16% | 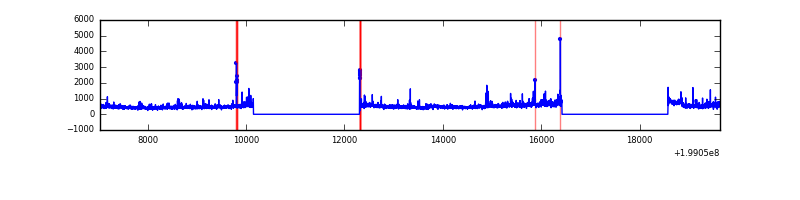 |
| C | 12603 | 8296 | 114 | 114 | 0.90% | 1.37% | 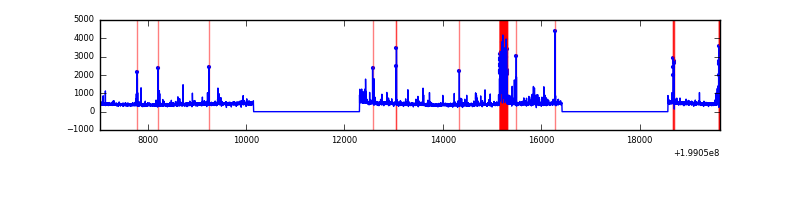 |
| D | 12603 | 8296 | 107 | 107 | 0.85% | 1.29% | 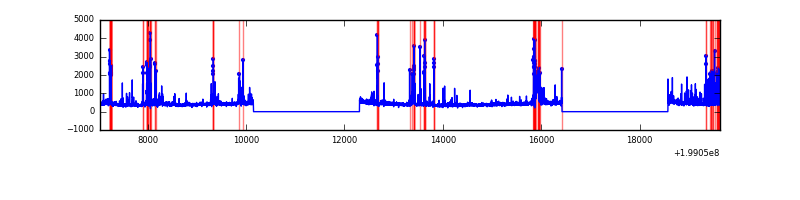 |
Top three noisy pixels from each quadrant. If the there are fewer than three noisy pixels in the level2.evt file, extra rows are filled as -1
| Pixel properties | Quadrant properties | ||||||
|---|---|---|---|---|---|---|---|
| Quadrant | DetID | PixID | Counts | Sigma | Mean | Median | Sigma |
| A | 12 | 113 | 974830 | 5461.2 | 869 | 852 | 178.3 |
| A | 8 | 15 | 43448 | 238.84 | 869 | 852 | 178.3 |
| A | 12 | 194 | 32713 | 178.65 | 869 | 852 | 178.3 |
| B | 15 | 204 | 372253 | 2124.33 | 898 | 877 | 174.8 |
| B | 4 | 81 | 239788 | 1366.61 | 898 | 877 | 174.8 |
| B | 0 | 219 | 84172 | 476.46 | 898 | 877 | 174.8 |
| C | 4 | 248 | 298882 | 1486.57 | 855 | 865 | 200.5 |
| C | 14 | 223 | 78321 | 386.37 | 855 | 865 | 200.5 |
| C | 6 | 80 | 76580 | 377.68 | 855 | 865 | 200.5 |
| D | 2 | 152 | 334838 | 1640.65 | 845 | 824 | 203.6 |
| D | 7 | 6 | 179179 | 876.07 | 845 | 824 | 203.6 |
| D | 10 | 85 | 90541 | 440.68 | 845 | 824 | 203.6 |
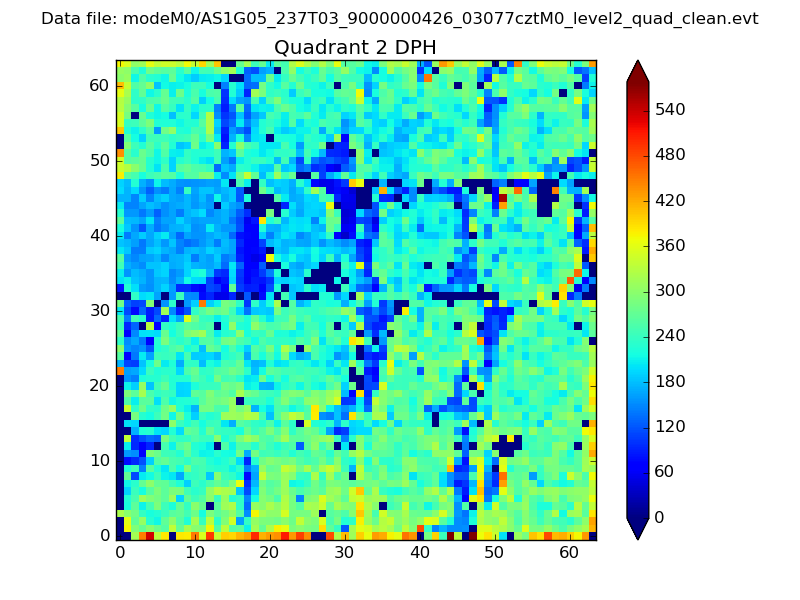
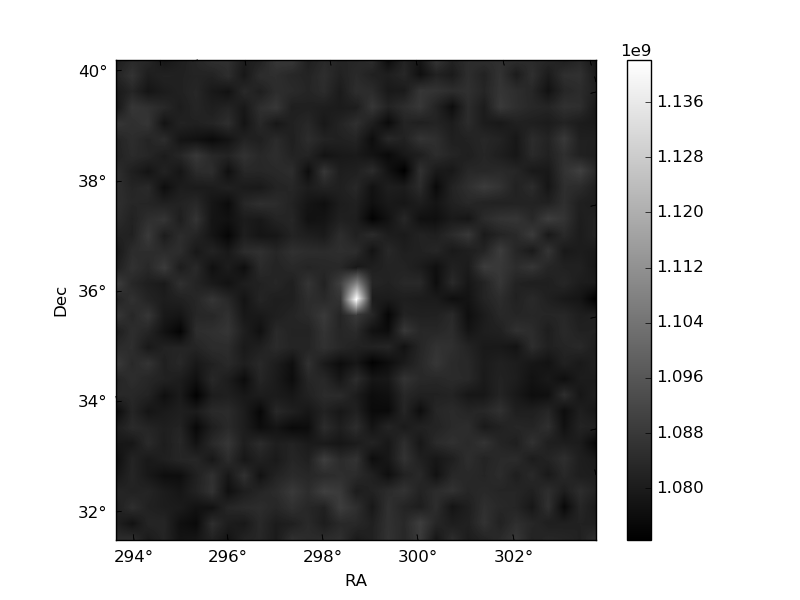
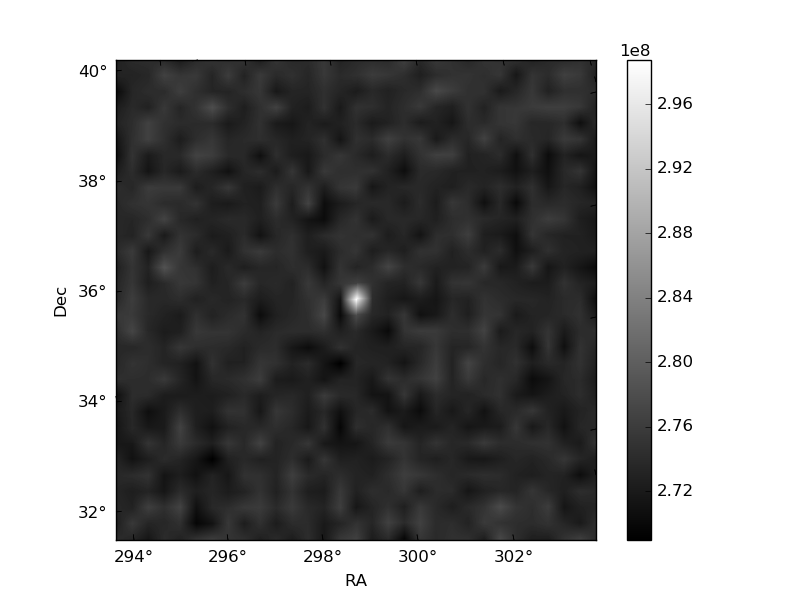
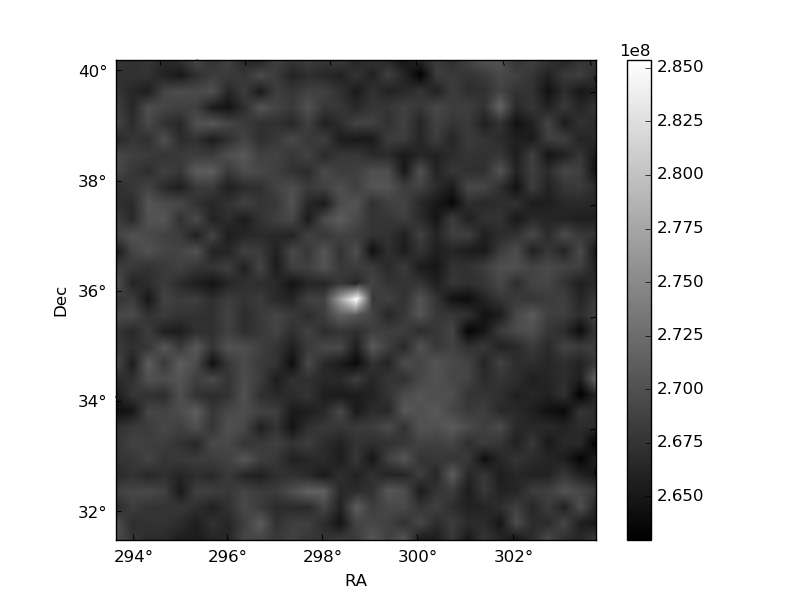
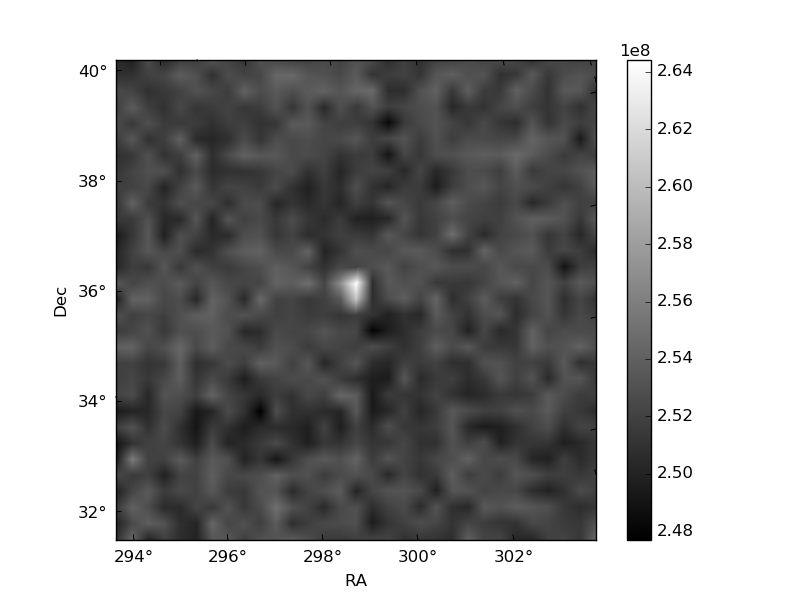
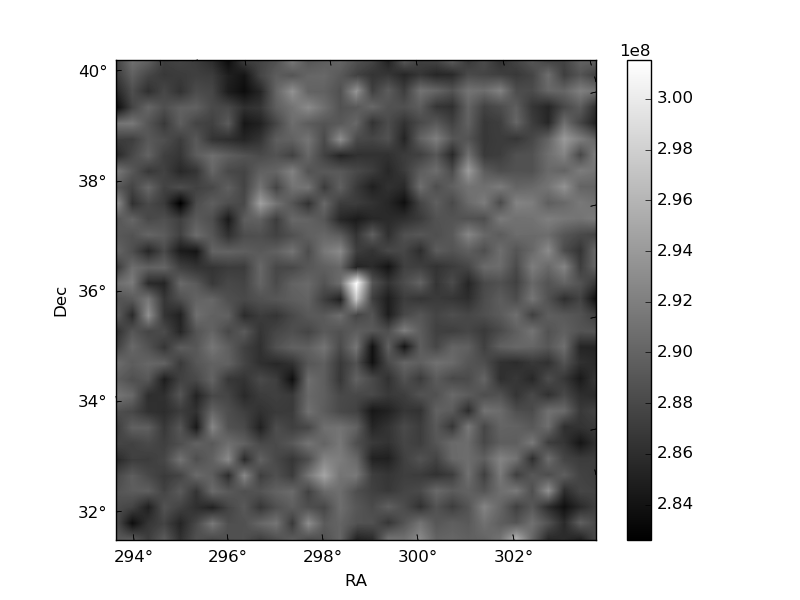
Histogram calculated using DETX and DETY for each event in the final _common_clean file
| Quadrant A | 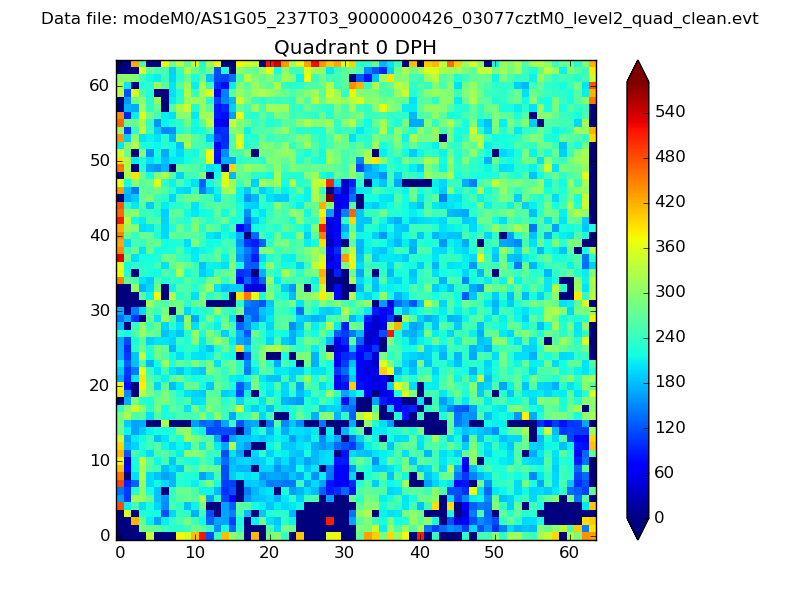 |
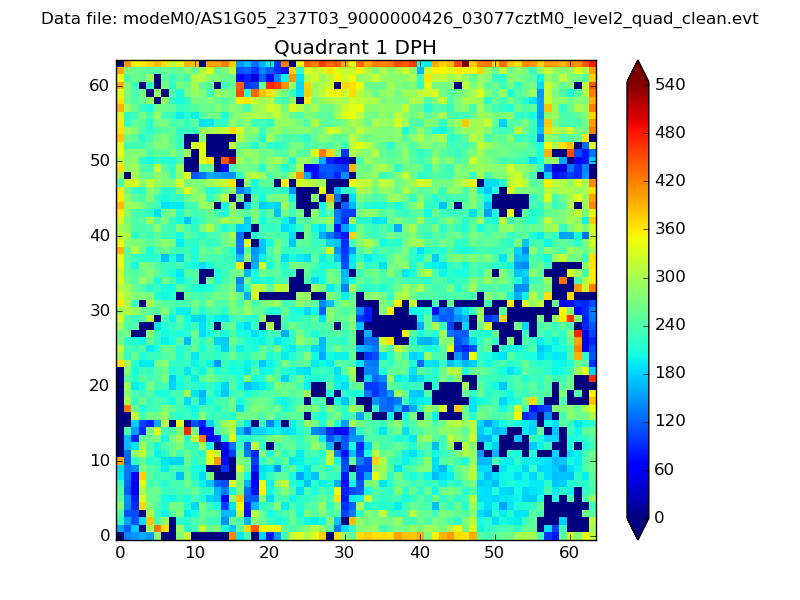 |
Quadrant B |
|---|---|---|---|
| Quadrant D | 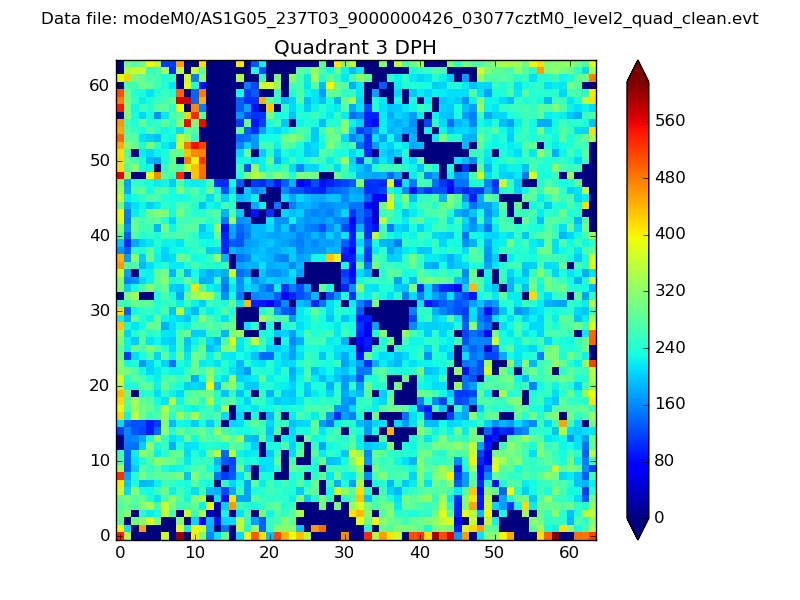 |
 |
Quadrant C |
| Plot type | Count rate plots | Images |
|---|---|---|
| Comparison with Poisson distribution Blue bars denote a histogram of data divided into 1 sec bins. Red curve is a Poisson curve with rate = median count rate of data. |
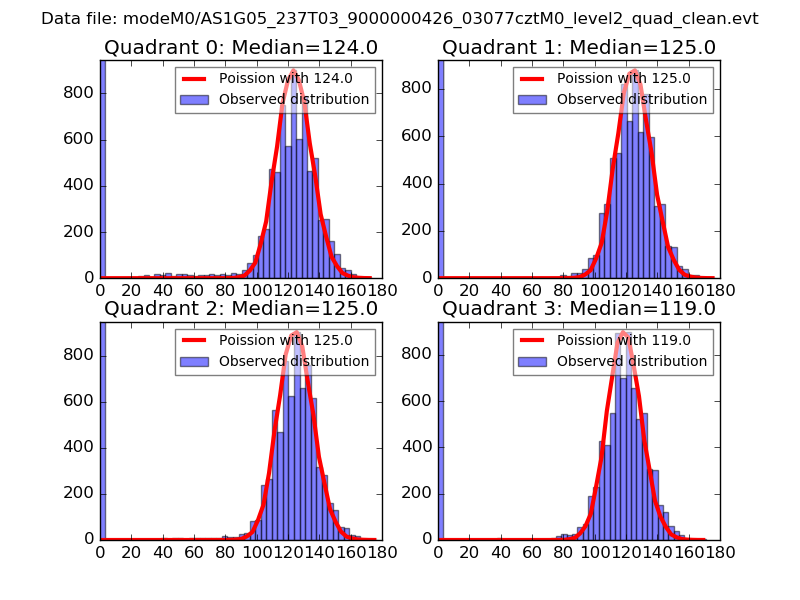 |
 |
| Quadrant-wise count rates Data is divided into 100 sec bins |
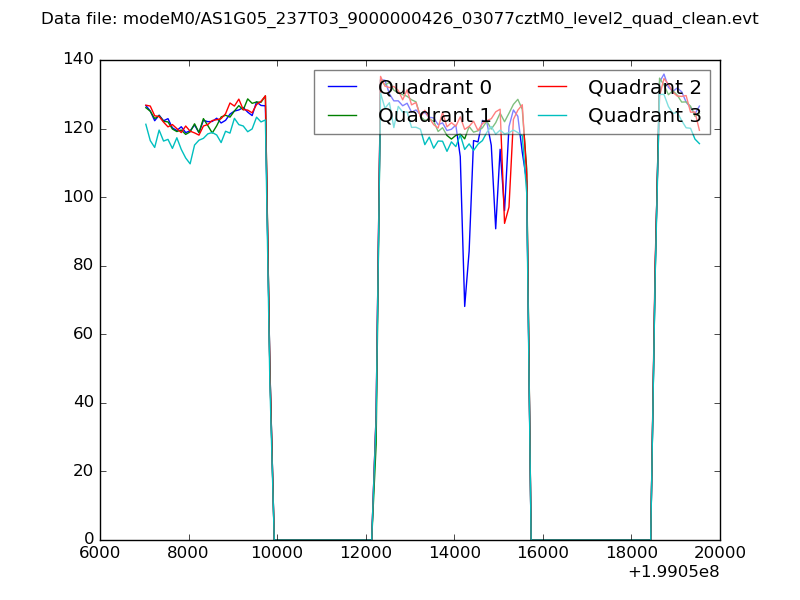 |
|
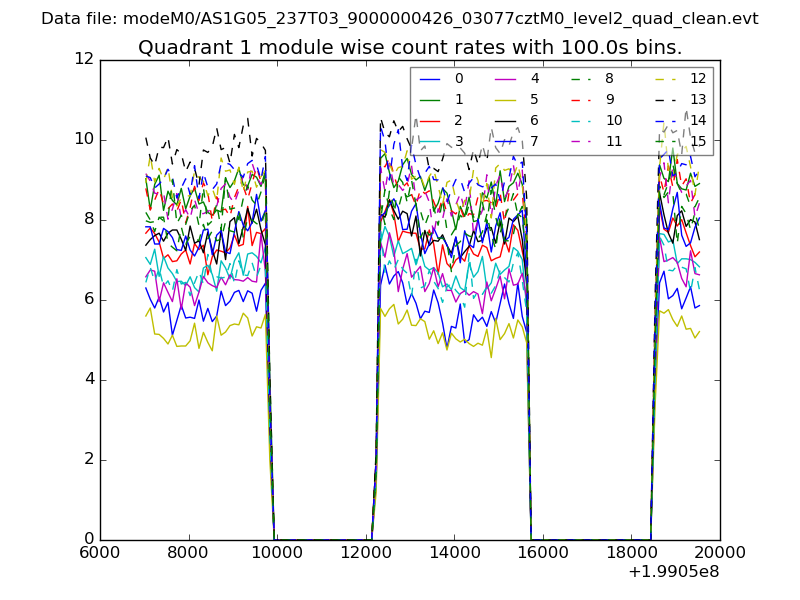
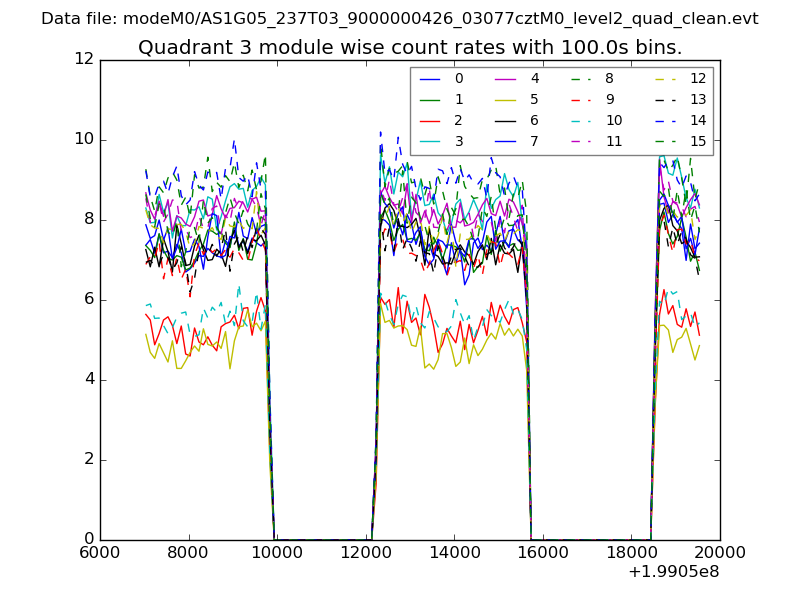
| Module-wise count rates for Quadrant A Data is divided into 100 sec bins |
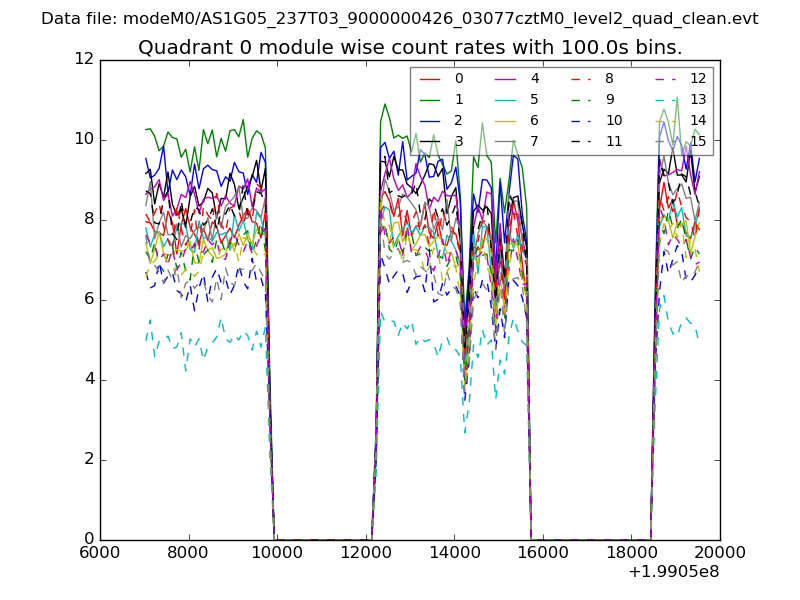 |
 |
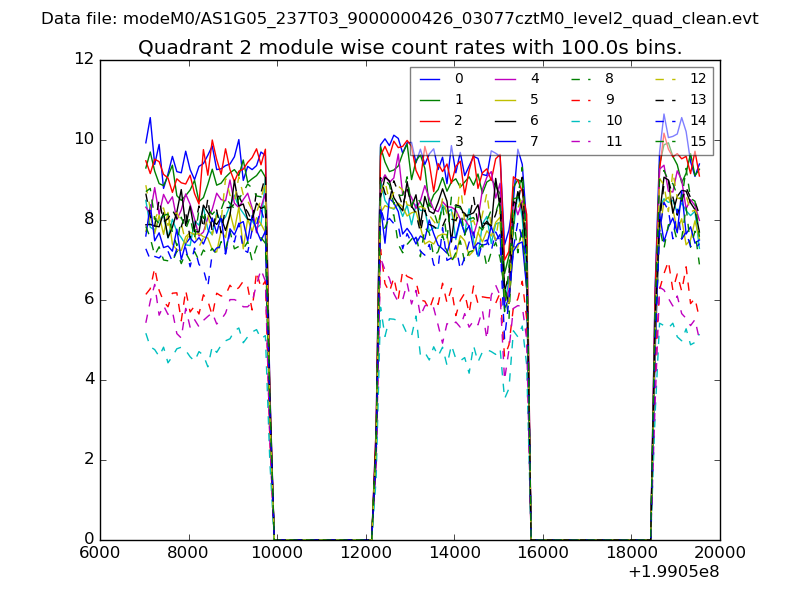
| Module-wise count rates for Quadrant B Data is divided into 100 sec bins |
 |
 |
| Module-wise count rates for Quadrant C Data is divided into 100 sec bins |
 |
 |
| Module-wise count rates for Quadrant D Data is divided into 100 sec bins |
 |
 |
| Parameter | Plot |
|---|---|
| CZT HV Monitor | 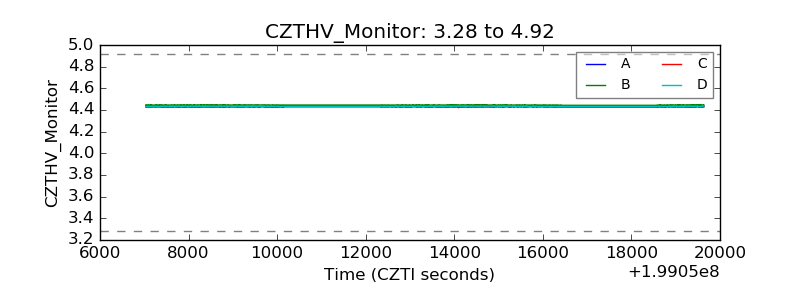 |
| D_VDD | 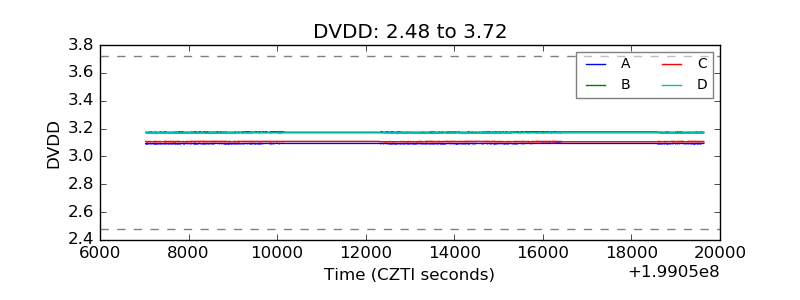 |
| Temperature 1 | 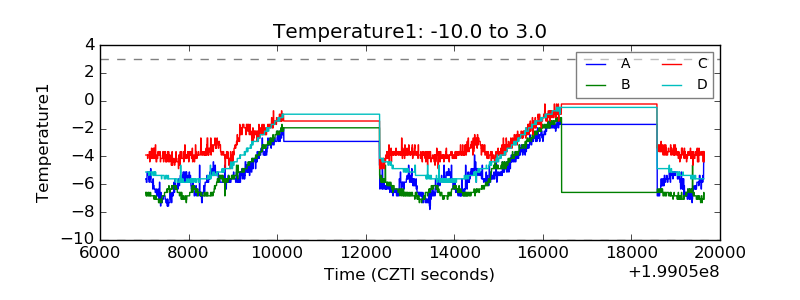 |
| Veto HV Monitor | 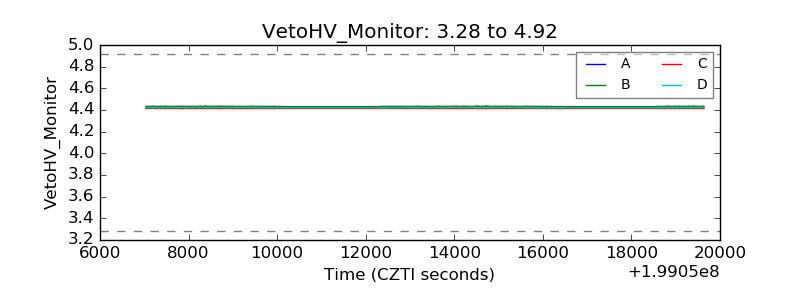 |
| Veto LLD | 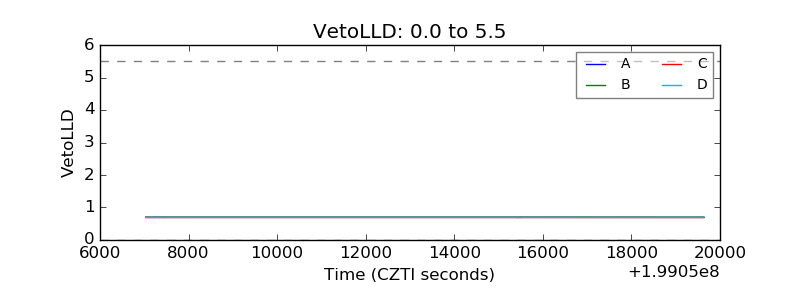 |
| Alpha Counter | 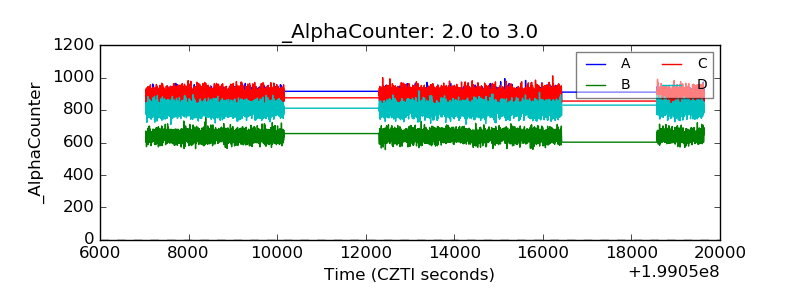 |
| _CPM_Rate | 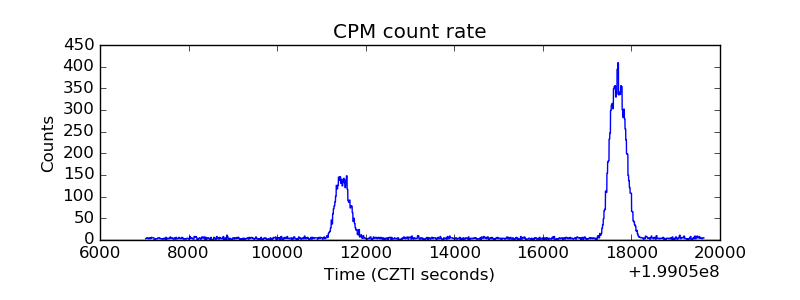 |
| CZT Counter | 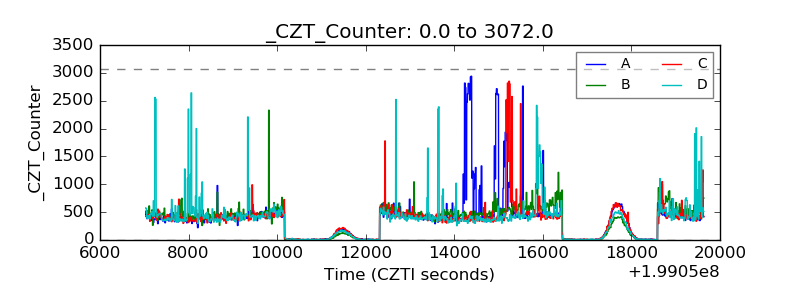 |
| +2.5 Volts monitor |  |
| +5 Volts monitor |  |
| _ROLL_ROT | 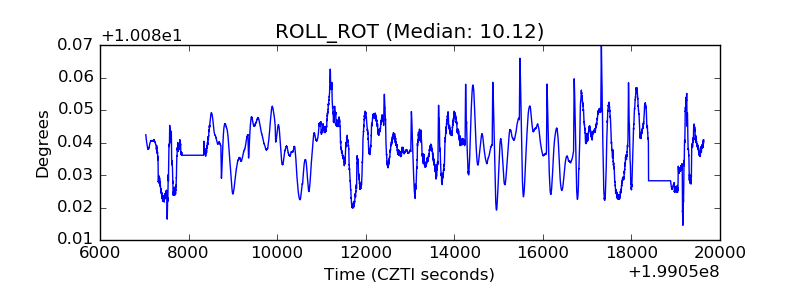 |
| _Roll_DEC | 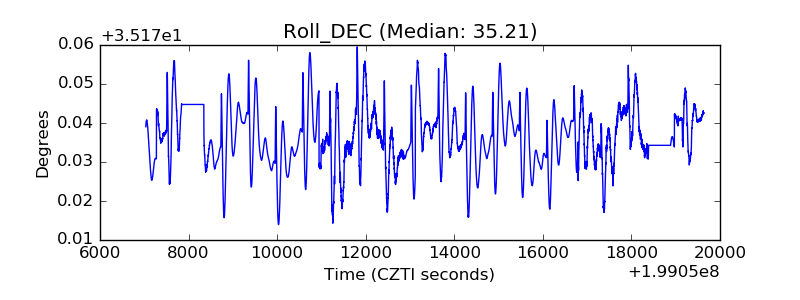 |
| _Roll_RA | 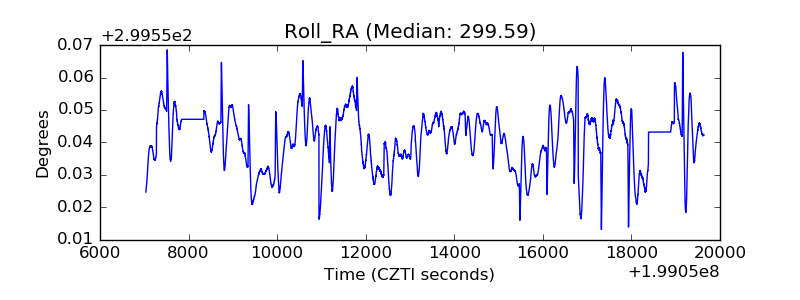 |
| Veto Counter | 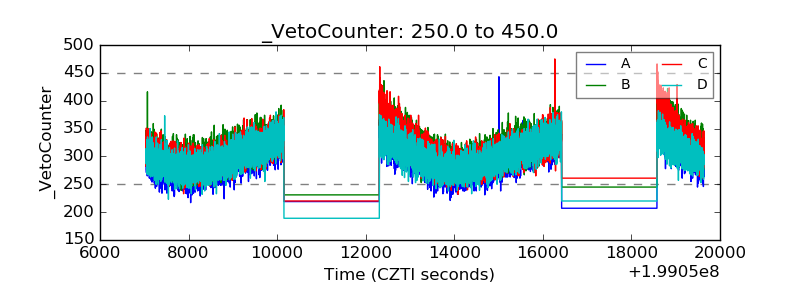 |