| Param | Original file | Final file |
|---|---|---|
| Filename | modeM0/AS1G05_237T03_9000000426_03078cztM0_level2.evt | modeM0/AS1G05_237T03_9000000426_03078cztM0_level2_common_clean.evt |
| Size (bytes) | 170,663,040 | 22,037,760 |
| Size | 162.8 MB | 21.0 MB |
| Events in quadrant A | 900,740 | 132,095 |
| Events in quadrant B | 1,583,035 | 132,535 |
| Events in quadrant C | 1,020,308 | 132,663 |
| Events in quadrant D | 1,527,503 | 126,644 |
| Mode M9 | |||
|---|---|---|---|
| Quadrant | BADHDUFLAG | Total packets | Discarded packets |
| A | 0 | 22 | 0 |
| B | 0 | 22 | 0 |
| C | 0 | 22 | 0 |
| D | 0 | 22 | 0 |
| Mode M0 | |||
|---|---|---|---|
| Quadrant | BADHDUFLAG | Total packets | Discarded packets |
| A | 0 | 4024 | 6 |
| B | 0 | 6065 | 10 |
| C | 0 | 4449 | 7 |
| D | 0 | 6021 | 15 |
| Mode SS | |||
|---|---|---|---|
| Quadrant | BADHDUFLAG | Total packets | Discarded packets |
| A | 0 | 40 | 0 |
| B | 0 | 40 | 0 |
| C | 0 | 40 | 0 |
| D | 0 | 40 | 0 |
| Quadrant | Total seconds | Saturated seconds | Saturation percentage |
|---|---|---|---|
| A | 1986 | 4 | 0.201410% |
| B | 1984 | 286 | 14.415323% |
| C | 1984 | 32 | 1.612903% |
| D | 1984 | 274 | 13.810484% |
Noise dominated data is calculated using 1-second bins in cleaned event files. If a bin has >2000 counts, and if more than 50% of those come from <1% of pixels, then it is considered to be noise-dominated and hence unusable.
| Quadrant | # 1 sec bins | Bins with >0 counts | Bins with >2000 counts | High rate bins dominated by noise | Noise dominated (total time) | Noise dominated (detector-on time) | Marked lightcurve |
|---|---|---|---|---|---|---|---|
| A | 4142 | 1988 | 0 | 0 | 0.00% | 0.00% | 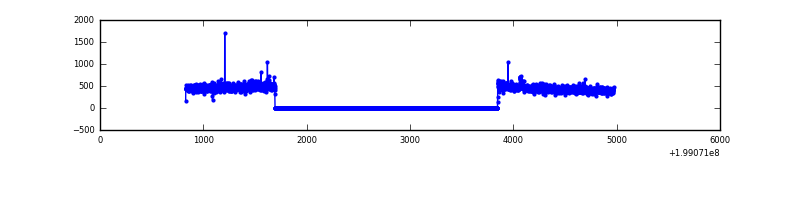 |
| B | 4142 | 1988 | 5 | 5 | 0.12% | 0.25% | 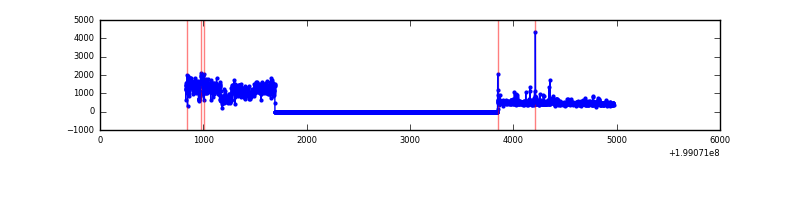 |
| C | 4142 | 1988 | 20 | 20 | 0.48% | 1.01% | 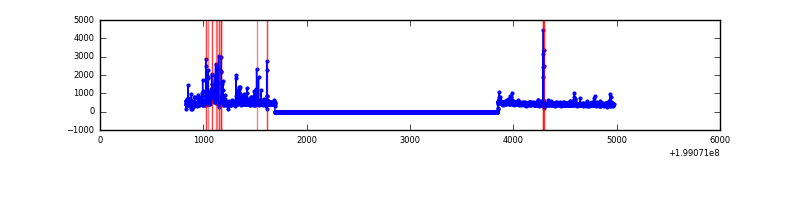 |
| D | 4142 | 1988 | 214 | 214 | 5.17% | 10.76% | 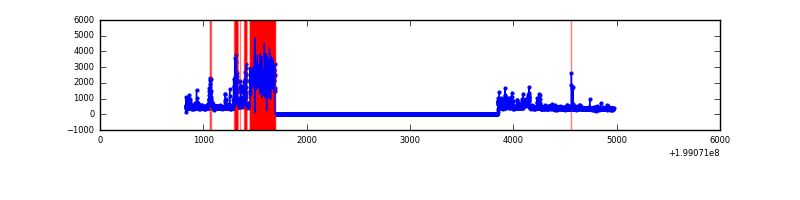 |
Top three noisy pixels from each quadrant. If the there are fewer than three noisy pixels in the level2.evt file, extra rows are filled as -1
| Pixel properties | Quadrant properties | ||||||
|---|---|---|---|---|---|---|---|
| Quadrant | DetID | PixID | Counts | Sigma | Mean | Median | Sigma |
| A | 8 | 15 | 29528 | 626.74 | 220 | 216 | 46.8 |
| A | 0 | 31 | 5847 | 120.4 | 220 | 216 | 46.8 |
| A | 0 | 50 | 5235 | 107.31 | 220 | 216 | 46.8 |
| B | 4 | 81 | 504095 | 11671.77 | 217 | 212 | 43.2 |
| B | 15 | 204 | 157645 | 3646.72 | 217 | 212 | 43.2 |
| B | 0 | 219 | 24161 | 554.75 | 217 | 212 | 43.2 |
| C | 14 | 223 | 137933 | 2694.01 | 213 | 214 | 51.1 |
| C | 6 | 80 | 25284 | 490.41 | 213 | 214 | 51.1 |
| C | 1 | 16 | 9717 | 185.89 | 213 | 214 | 51.1 |
| D | 1 | 20 | 494747 | 10034.16 | 197 | 191 | 49.3 |
| D | 2 | 152 | 200872 | 4071.66 | 197 | 191 | 49.3 |
| D | 10 | 172 | 17161 | 344.31 | 197 | 191 | 49.3 |
Histogram calculated using DETX and DETY for each event in the final _common_clean file
| Quadrant A | 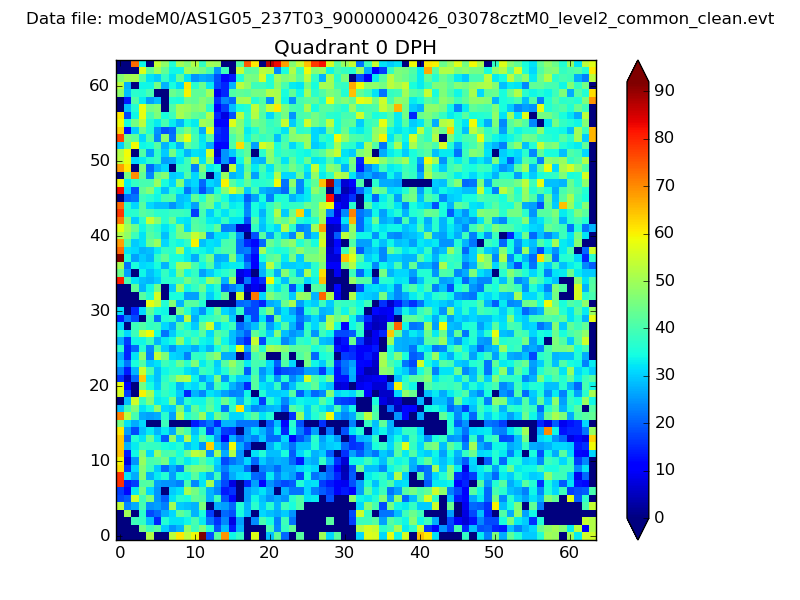 |
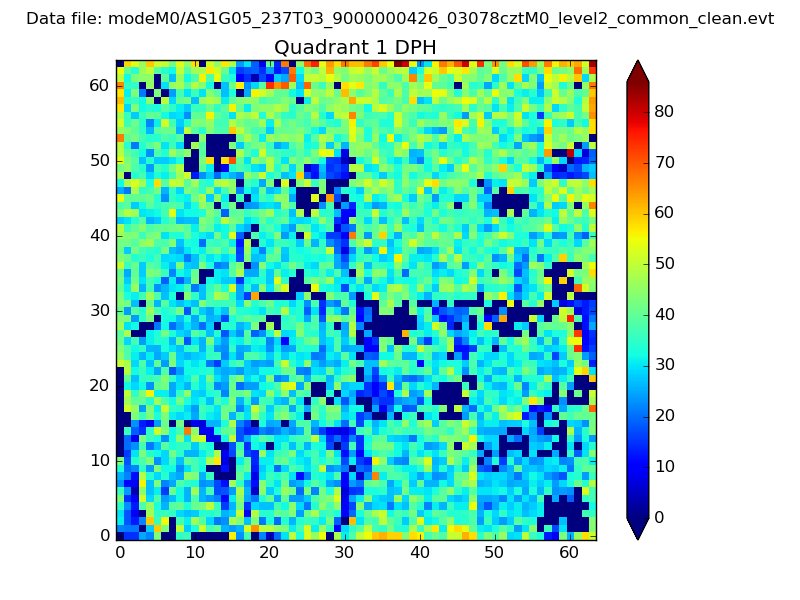 |
Quadrant B |
|---|---|---|---|
| Quadrant D | 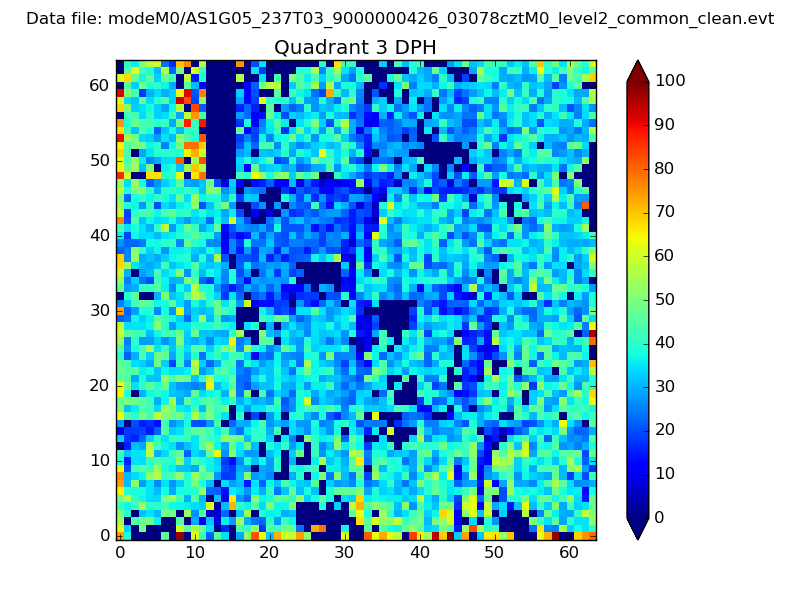 |
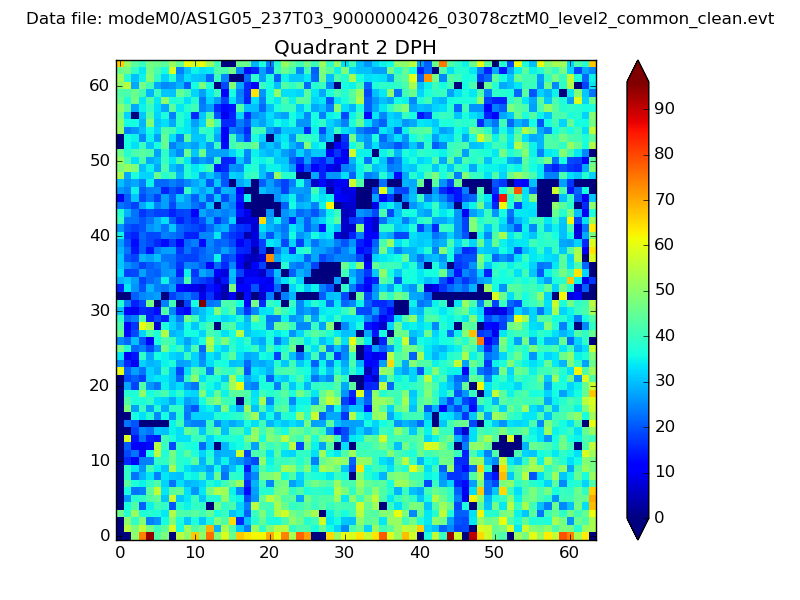 |
Quadrant C |
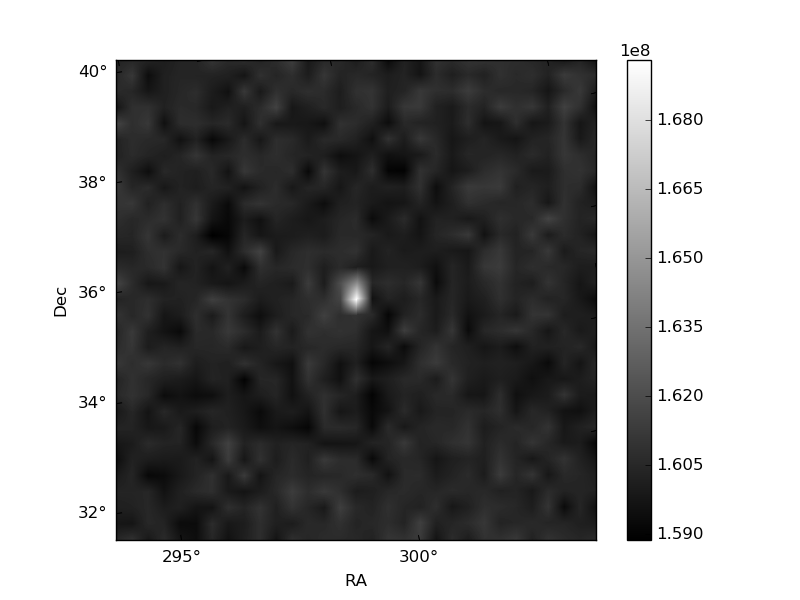
| Plot type | Count rate plots | Images |
|---|---|---|
| Comparison with Poisson distribution Blue bars denote a histogram of data divided into 1 sec bins. Red curve is a Poisson curve with rate = median count rate of data. |
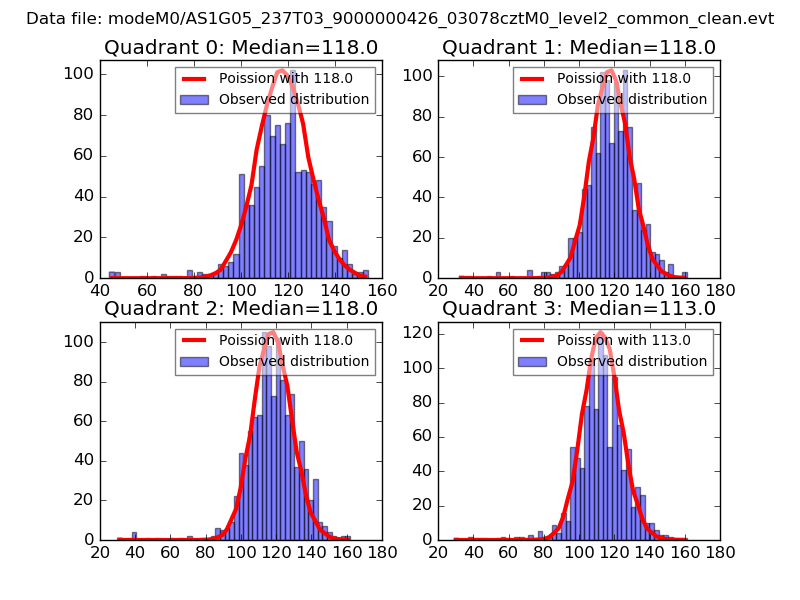 |
 |
| Quadrant-wise count rates Data is divided into 100 sec bins |
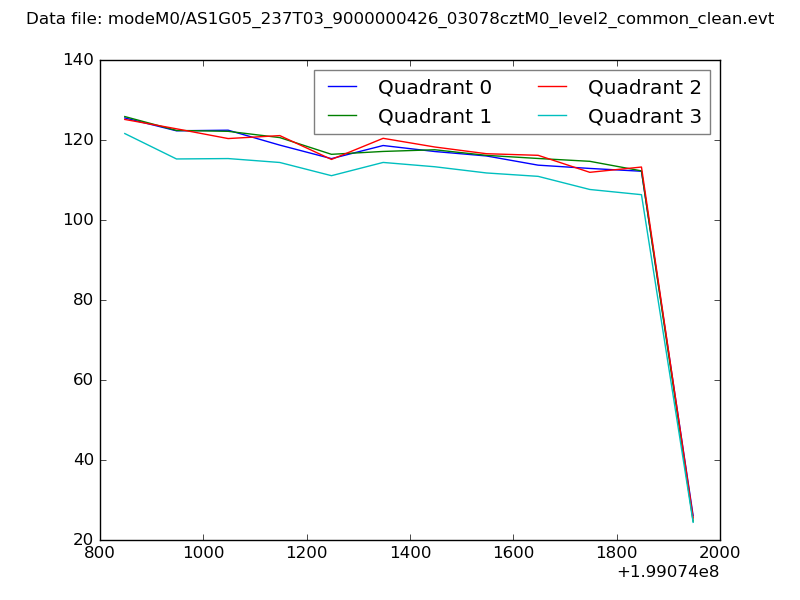 |
|
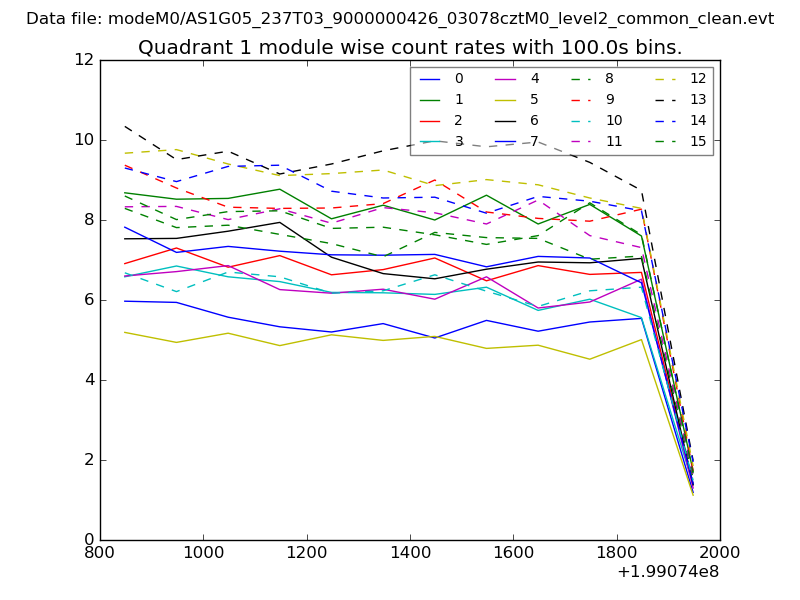
| Module-wise count rates for Quadrant A Data is divided into 100 sec bins |
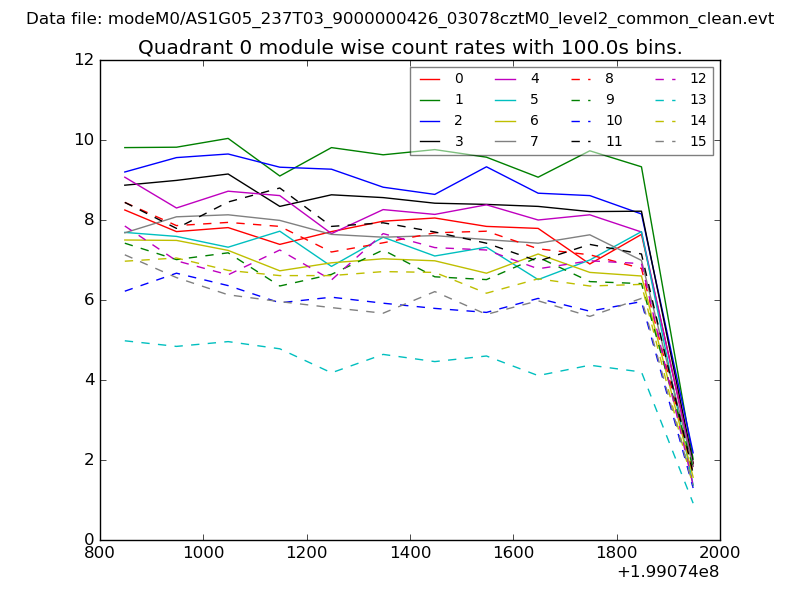 |
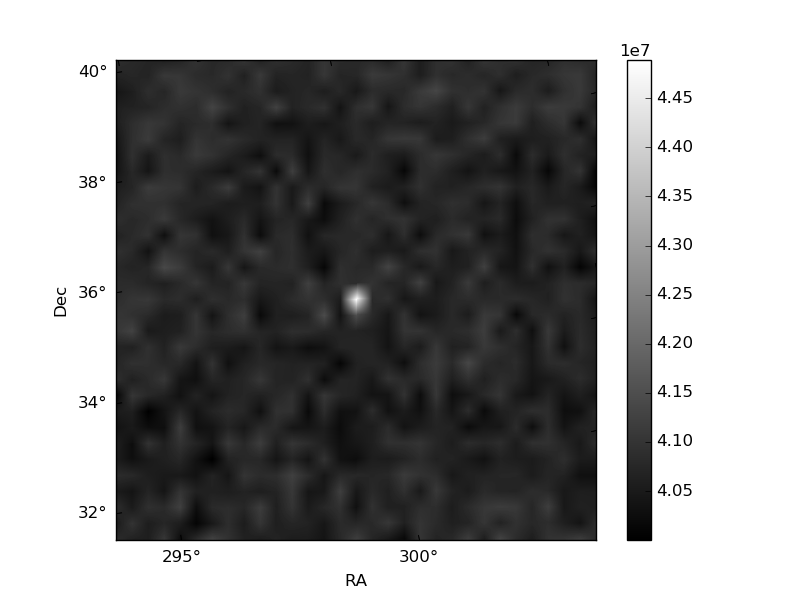 |
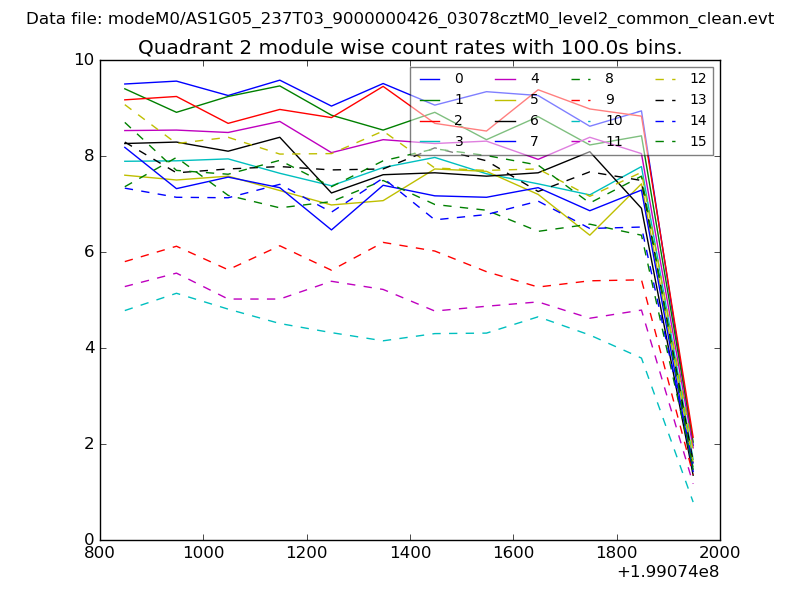
| Module-wise count rates for Quadrant B Data is divided into 100 sec bins |
 |
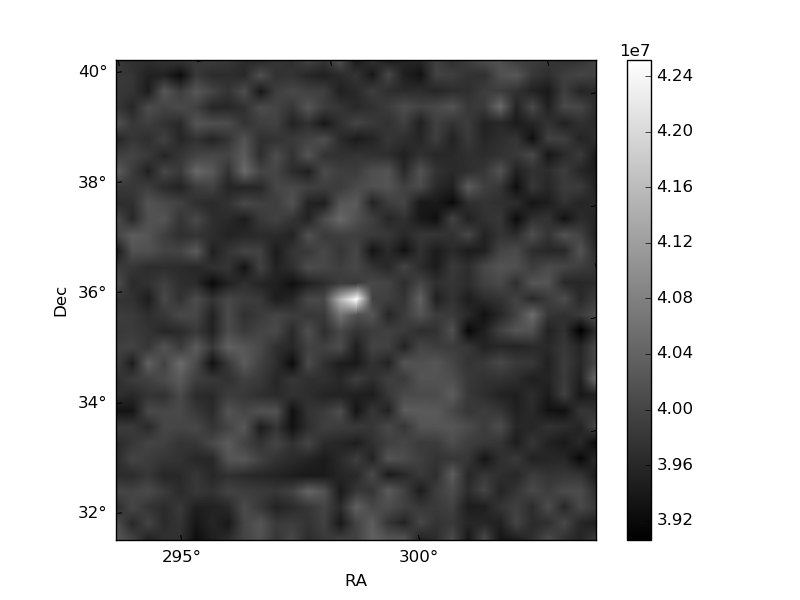 |
| Module-wise count rates for Quadrant C Data is divided into 100 sec bins |
 |
 |
| Module-wise count rates for Quadrant D Data is divided into 100 sec bins |
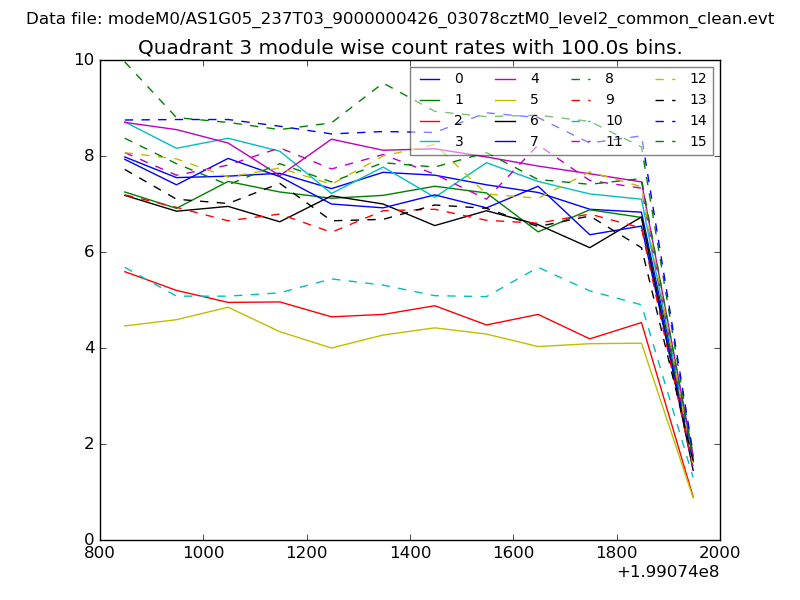 |
 |
| Parameter | Plot |
|---|---|
| CZT HV Monitor | 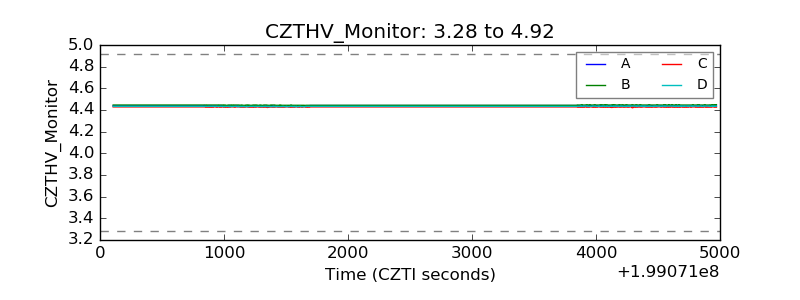 |
| D_VDD | 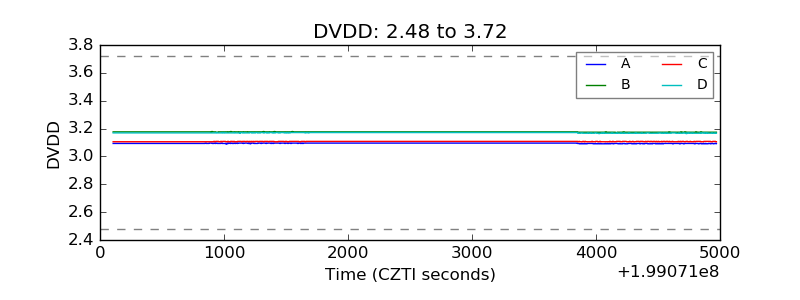 |
| Temperature 1 | 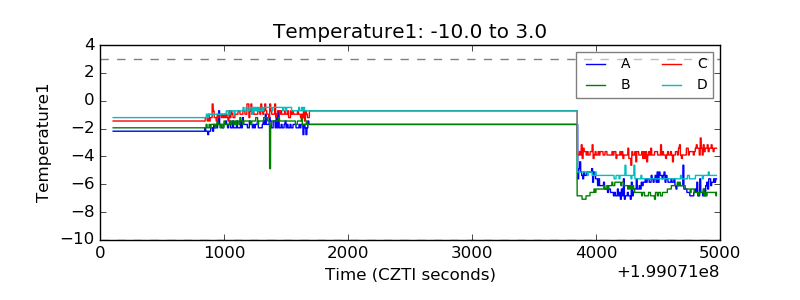 |
| Veto HV Monitor | 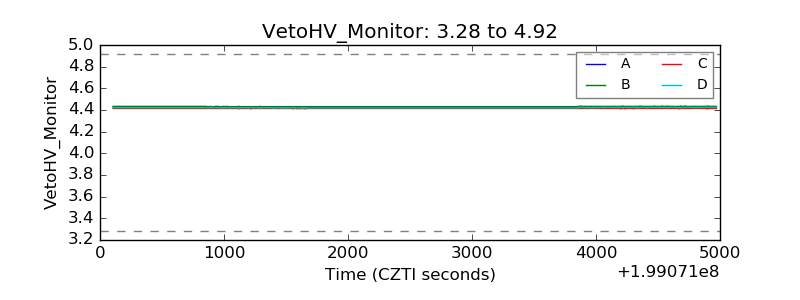 |
| Veto LLD | 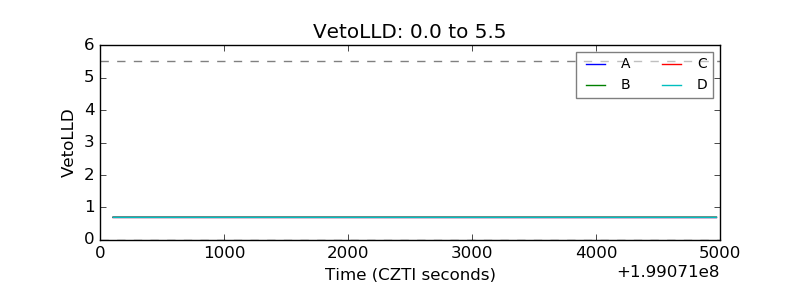 |
| Alpha Counter | 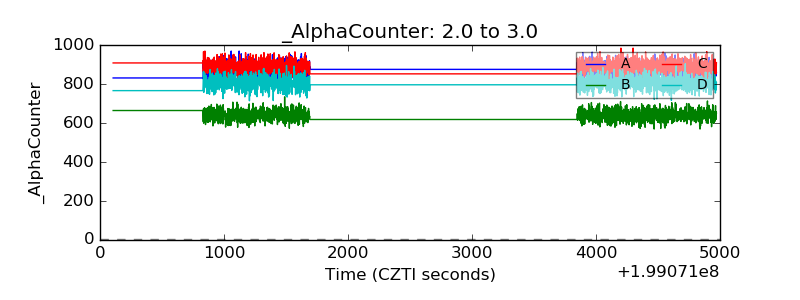 |
| _CPM_Rate | 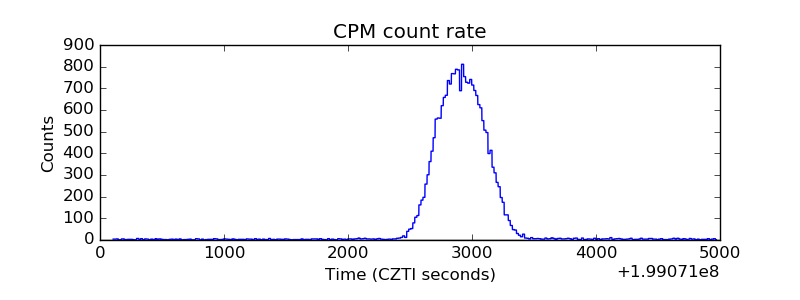 |
| CZT Counter | 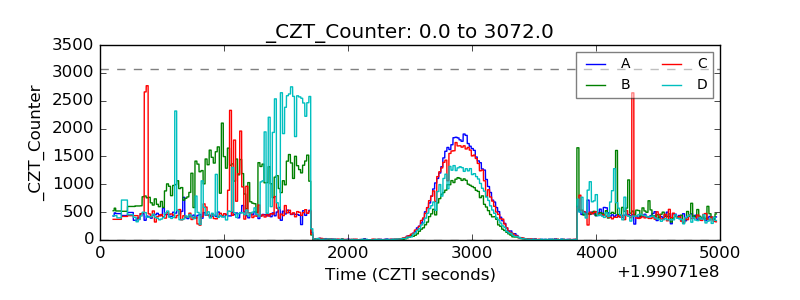 |
| +2.5 Volts monitor |  |
| +5 Volts monitor |  |
| Veto Counter | 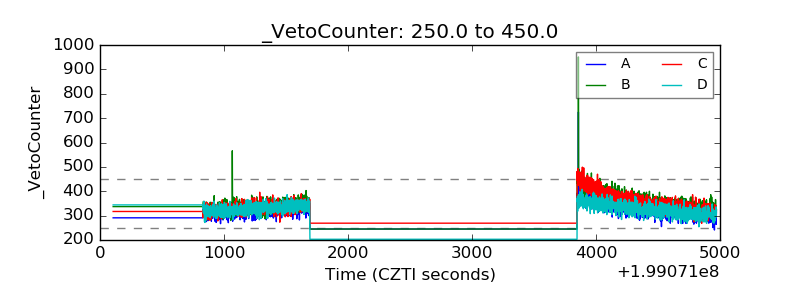 |