| Param | Original file | Final file |
|---|---|---|
| Filename | modeM0/AS1G05_237T03_9000000426_03080cztM0_level2.evt | modeM0/AS1G05_237T03_9000000426_03080cztM0_level2_common_clean.evt |
| Size (bytes) | 674,104,320 | 105,143,040 |
| Size | 642.9 MB | 100.3 MB |
| Events in quadrant A | 4,625,531 | 652,822 |
| Events in quadrant B | 5,400,450 | 654,126 |
| Events in quadrant C | 4,383,932 | 655,092 |
| Events in quadrant D | 5,420,676 | 624,164 |
| Mode M9 | |||
|---|---|---|---|
| Quadrant | BADHDUFLAG | Total packets | Discarded packets |
| A | 0 | 44 | 0 |
| B | 0 | 44 | 0 |
| C | 0 | 44 | 0 |
| D | 0 | 44 | 0 |
| Mode M0 | |||
|---|---|---|---|
| Quadrant | BADHDUFLAG | Total packets | Discarded packets |
| A | 0 | 20340 | 503 |
| B | 0 | 22310 | 512 |
| C | 0 | 20803 | 1269 |
| D | 0 | 23190 | 531 |
| Mode SS | |||
|---|---|---|---|
| Quadrant | BADHDUFLAG | Total packets | Discarded packets |
| A | 0 | 180 | 4 |
| B | 0 | 180 | 4 |
| C | 0 | 180 | 4 |
| D | 0 | 180 | 4 |
| Quadrant | Total seconds | Saturated seconds | Saturation percentage |
|---|---|---|---|
| A | 8641 | 291 | 3.367666% |
| B | 8639 | 353 | 4.086121% |
| C | 8612 | 148 | 1.718532% |
| D | 8631 | 400 | 4.634457% |
Noise dominated data is calculated using 1-second bins in cleaned event files. If a bin has >2000 counts, and if more than 50% of those come from <1% of pixels, then it is considered to be noise-dominated and hence unusable.
| Quadrant | # 1 sec bins | Bins with >0 counts | Bins with >2000 counts | High rate bins dominated by noise | Noise dominated (total time) | Noise dominated (detector-on time) | Marked lightcurve |
|---|---|---|---|---|---|---|---|
| A | 13354 | 8679 | 205 | 205 | 1.54% | 2.36% | 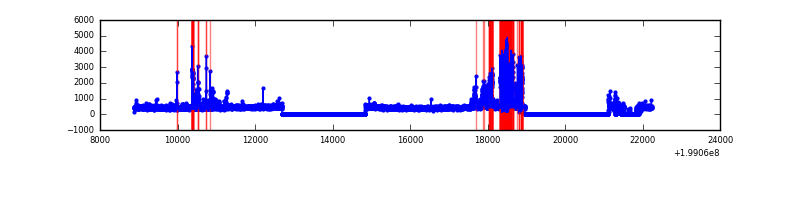 |
| B | 13354 | 8685 | 26 | 26 | 0.19% | 0.30% | 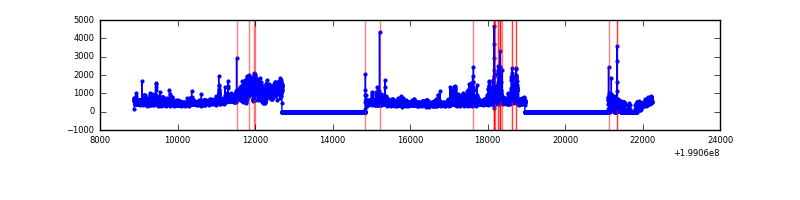 |
| C | 13354 | 8646 | 107 | 107 | 0.80% | 1.24% | 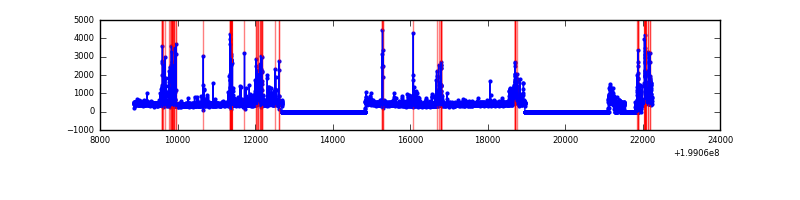 |
| D | 13354 | 8679 | 377 | 377 | 2.82% | 4.34% | 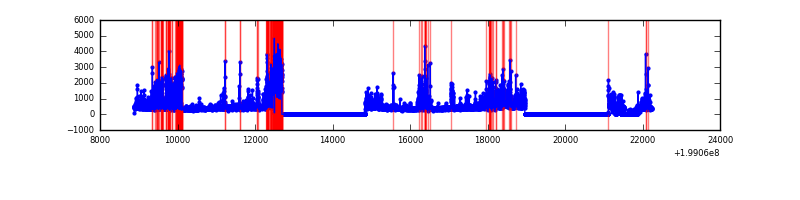 |
Top three noisy pixels from each quadrant. If the there are fewer than three noisy pixels in the level2.evt file, extra rows are filled as -1
| Pixel properties | Quadrant properties | ||||||
|---|---|---|---|---|---|---|---|
| Quadrant | DetID | PixID | Counts | Sigma | Mean | Median | Sigma |
| A | 14 | 249 | 783117 | 4194.84 | 913 | 895 | 186.5 |
| A | 8 | 15 | 127827 | 680.7 | 913 | 895 | 186.5 |
| A | 0 | 31 | 86409 | 458.59 | 913 | 895 | 186.5 |
| B | 4 | 81 | 973105 | 5503.6 | 935 | 916 | 176.6 |
| B | 15 | 204 | 306996 | 1732.73 | 935 | 916 | 176.6 |
| B | 2 | 249 | 153641 | 864.58 | 935 | 916 | 176.6 |
| C | 14 | 223 | 420890 | 2028.06 | 888 | 896 | 207.1 |
| C | 0 | 219 | 241041 | 1159.61 | 888 | 896 | 207.1 |
| C | 6 | 80 | 142039 | 681.55 | 888 | 896 | 207.1 |
| D | 1 | 20 | 913864 | 4240.78 | 871 | 851 | 215.3 |
| D | 2 | 152 | 517794 | 2401.1 | 871 | 851 | 215.3 |
| D | 13 | 239 | 151490 | 699.69 | 871 | 851 | 215.3 |
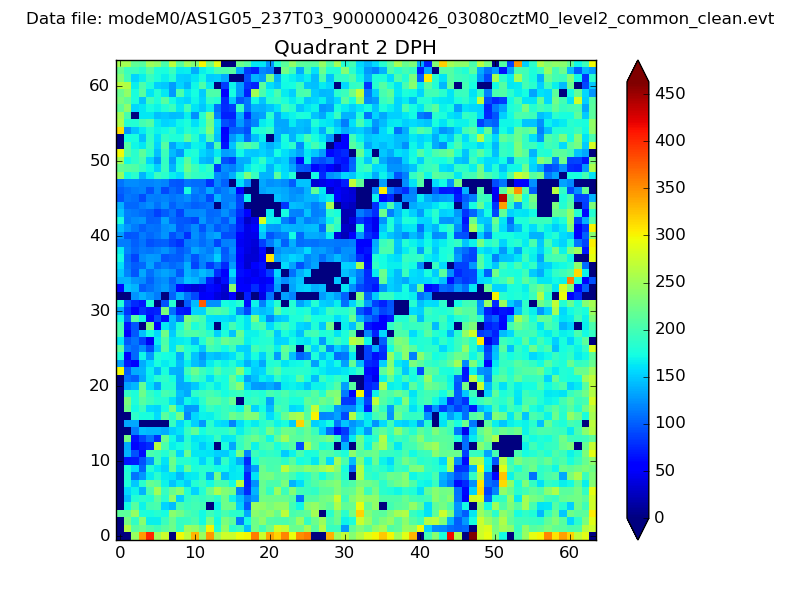
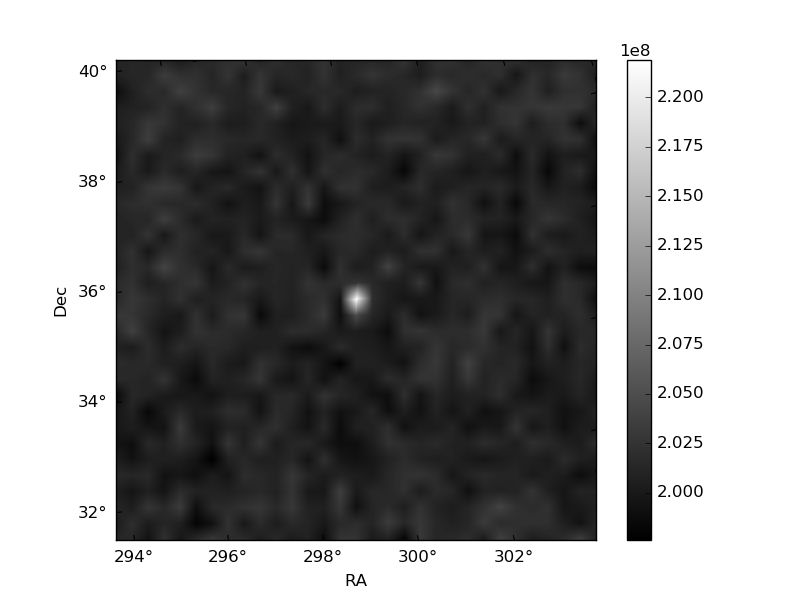
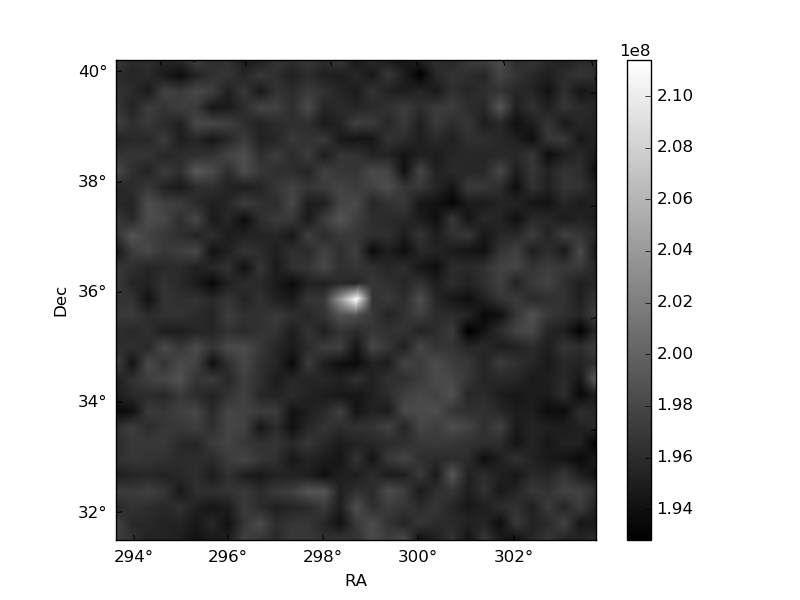
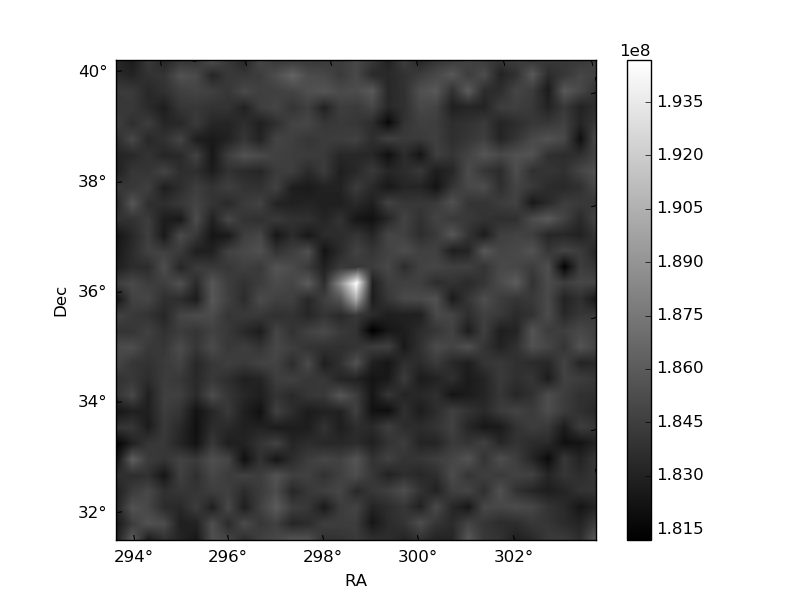
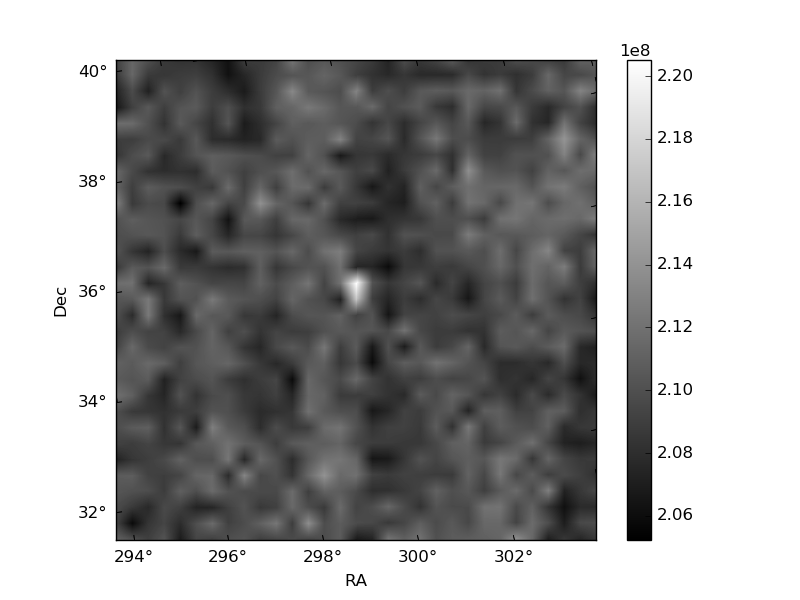
Histogram calculated using DETX and DETY for each event in the final _common_clean file
| Quadrant A | 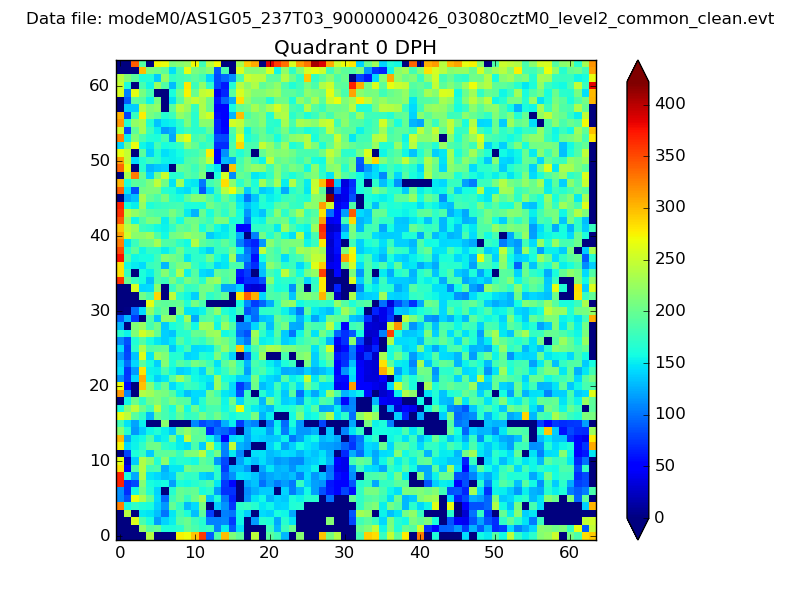 |
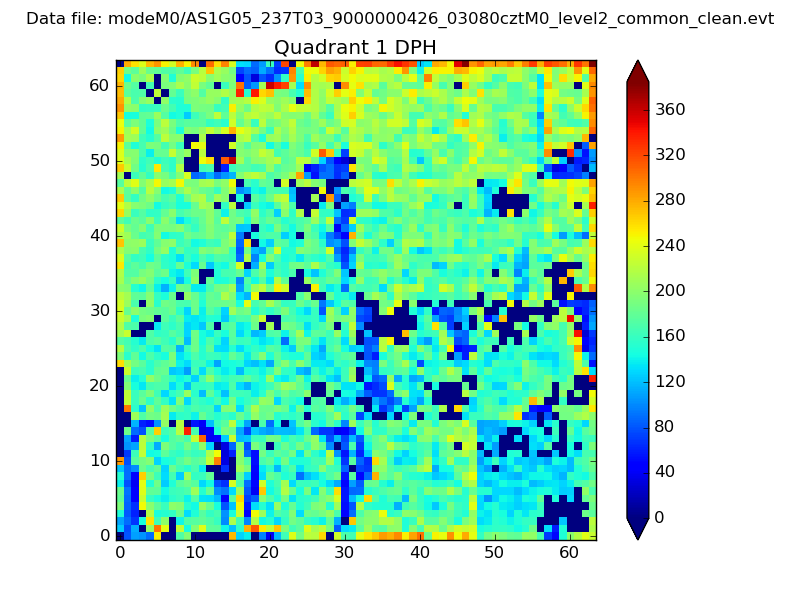 |
Quadrant B |
|---|---|---|---|
| Quadrant D | 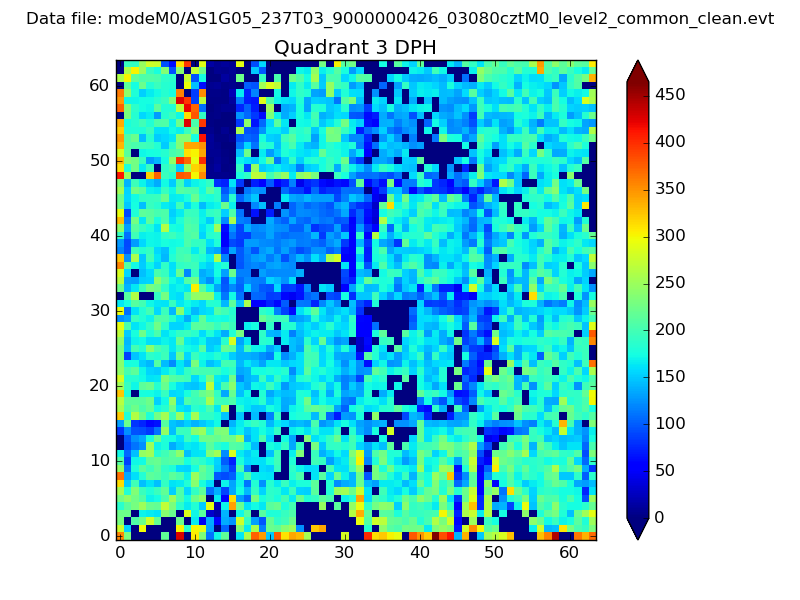 |
 |
Quadrant C |
| Plot type | Count rate plots | Images |
|---|---|---|
| Comparison with Poisson distribution Blue bars denote a histogram of data divided into 1 sec bins. Red curve is a Poisson curve with rate = median count rate of data. |
 |
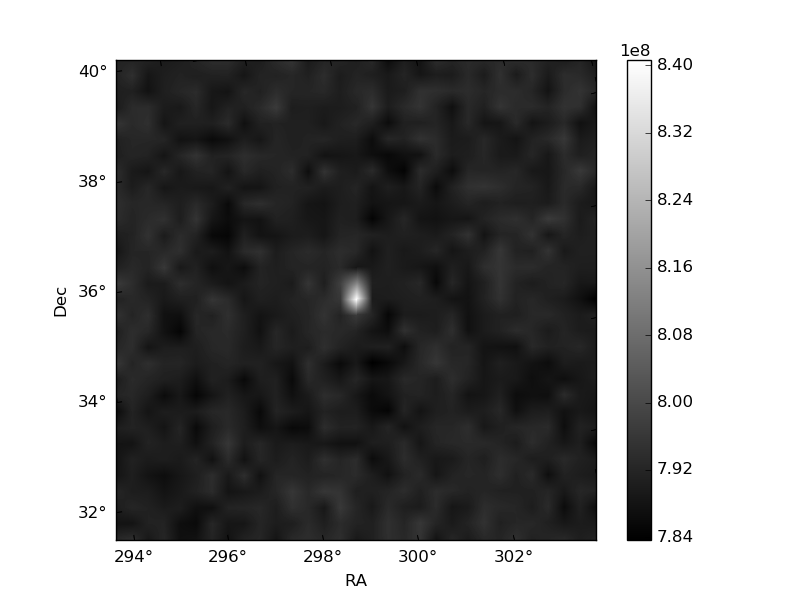 |
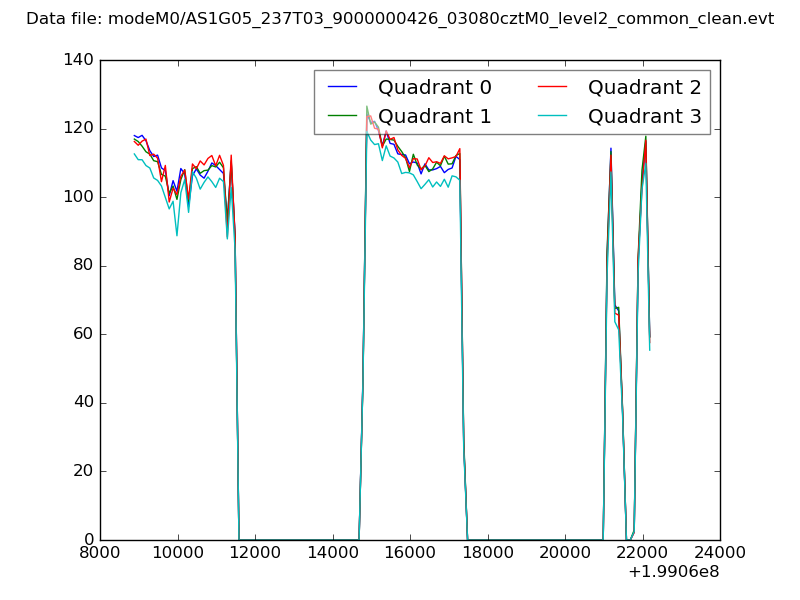
| Quadrant-wise count rates Data is divided into 100 sec bins |
 |
|
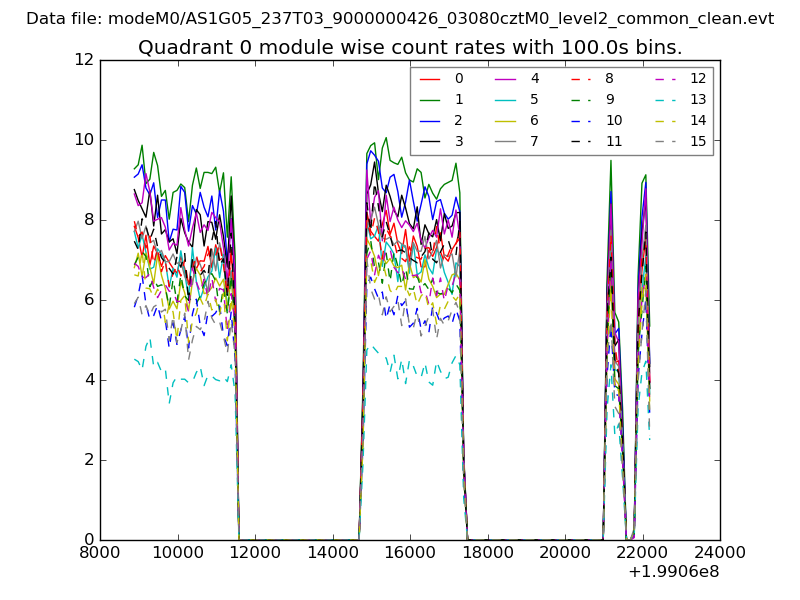
| Module-wise count rates for Quadrant A Data is divided into 100 sec bins |
 |
 |
| Module-wise count rates for Quadrant B Data is divided into 100 sec bins |
 |
 |
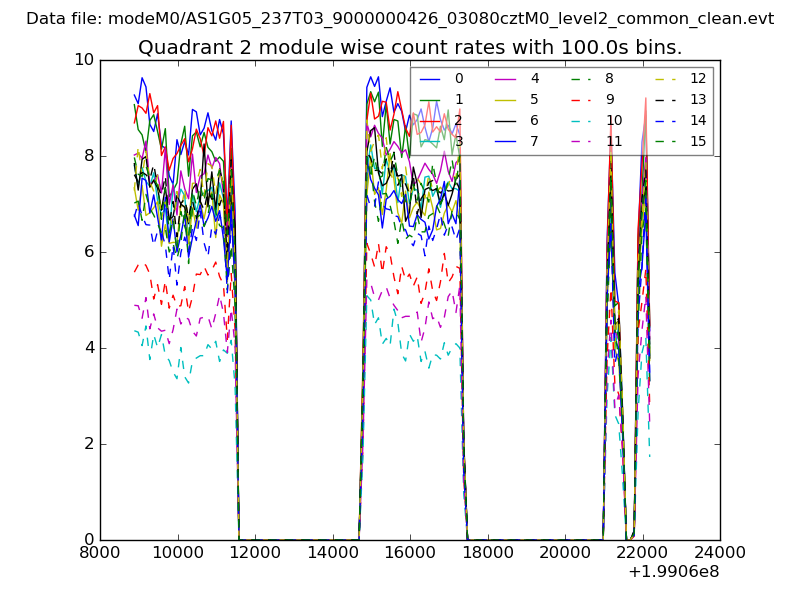
| Module-wise count rates for Quadrant C Data is divided into 100 sec bins |
 |
 |
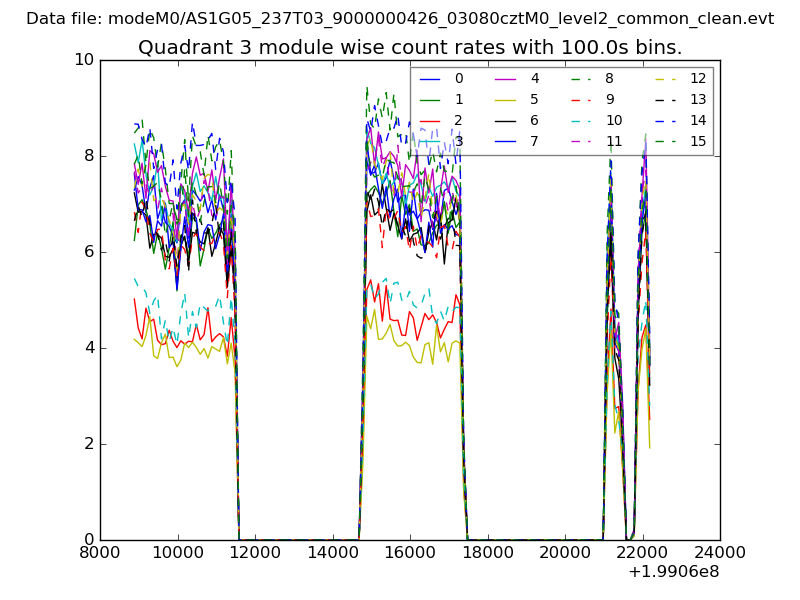
| Module-wise count rates for Quadrant D Data is divided into 100 sec bins |
 |
 |
| Parameter | Plot |
|---|---|
| CZT HV Monitor | 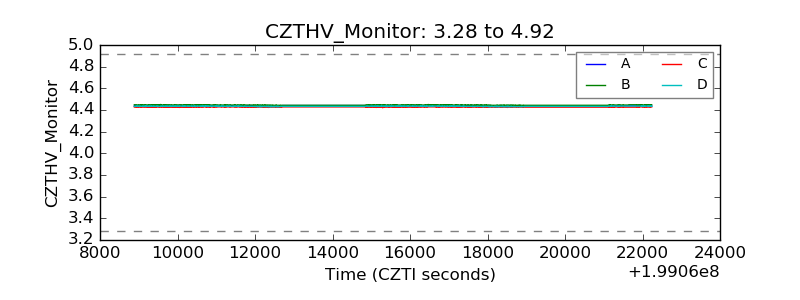 |
| D_VDD | 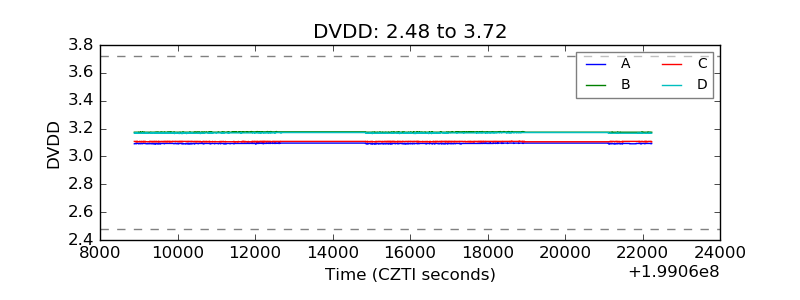 |
| Temperature 1 | 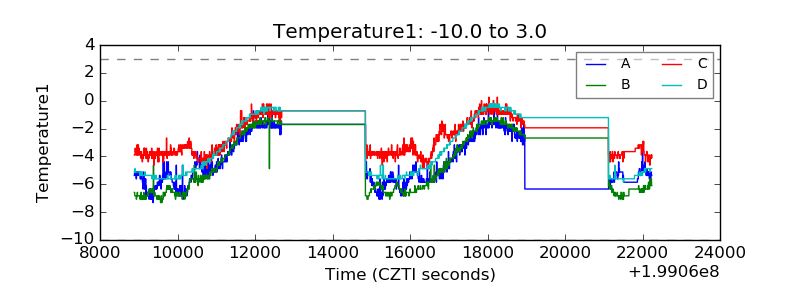 |
| Veto HV Monitor | 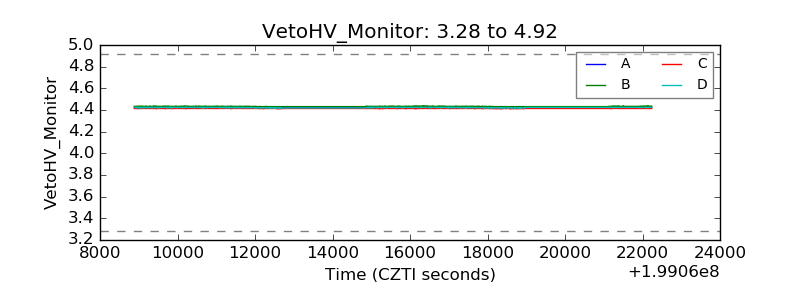 |
| Veto LLD | 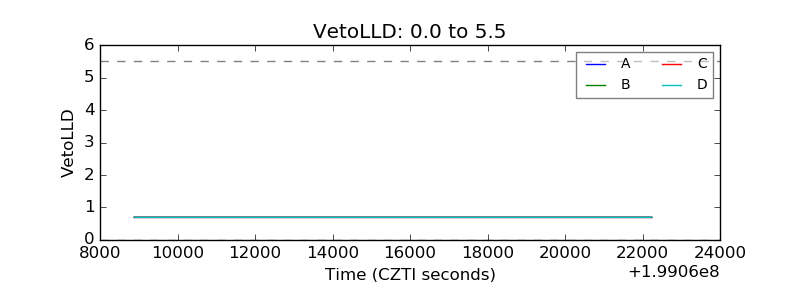 |
| Alpha Counter | 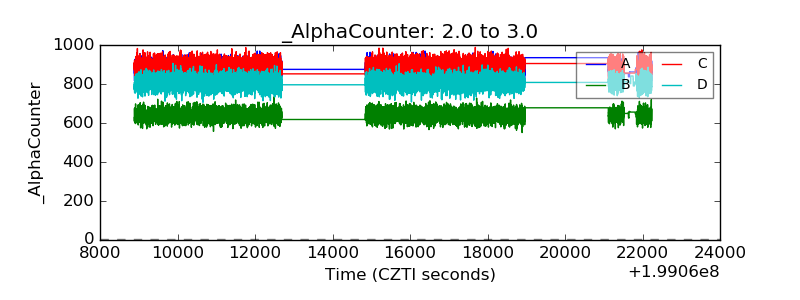 |
| _CPM_Rate | 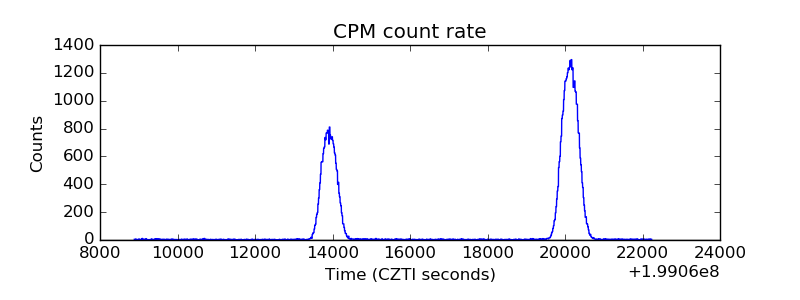 |
| CZT Counter | 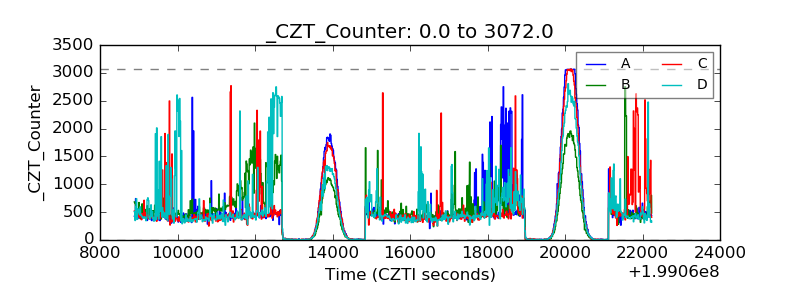 |
| +2.5 Volts monitor |  |
| +5 Volts monitor |  |
| Veto Counter | 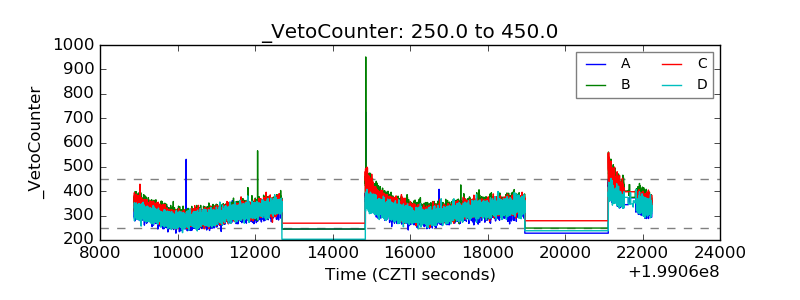 |