| Param | Original file | Final file |
|---|---|---|
| Filename | modeM0/AS1G05_237T03_9000000426_03081cztM0_level2.evt | modeM0/AS1G05_237T03_9000000426_03081cztM0_level2_quad_clean.evt |
| Size (bytes) | 502,001,280 | 63,961,920 |
| Size | 478.7 MB | 61.0 MB |
| Events in quadrant A | 2,670,401 | 401,077 |
| Events in quadrant B | 4,944,808 | 398,247 |
| Events in quadrant C | 4,428,769 | 387,198 |
| Events in quadrant D | 2,802,098 | 380,949 |
| Mode M9 | |||
|---|---|---|---|
| Quadrant | BADHDUFLAG | Total packets | Discarded packets |
| A | 0 | 21 | 0 |
| B | 0 | 21 | 0 |
| C | 0 | 21 | 0 |
| D | 0 | 21 | 0 |
| Mode M0 | |||
|---|---|---|---|
| Quadrant | BADHDUFLAG | Total packets | Discarded packets |
| A | 0 | 11243 | 3 |
| B | 0 | 18280 | 2 |
| C | 0 | 16851 | 2 |
| D | 0 | 12141 | 2 |
| Mode SS | |||
|---|---|---|---|
| Quadrant | BADHDUFLAG | Total packets | Discarded packets |
| A | 0 | 108 | 0 |
| B | 0 | 108 | 0 |
| C | 0 | 108 | 0 |
| D | 0 | 108 | 0 |
| Quadrant | Total seconds | Saturated seconds | Saturation percentage |
|---|---|---|---|
| A | 5266 | 7 | 0.132928% |
| B | 5266 | 478 | 9.077098% |
| C | 5266 | 353 | 6.703380% |
| D | 5266 | 100 | 1.898975% |
Noise dominated data is calculated using 1-second bins in cleaned event files. If a bin has >2000 counts, and if more than 50% of those come from <1% of pixels, then it is considered to be noise-dominated and hence unusable.
| Quadrant | # 1 sec bins | Bins with >0 counts | Bins with >2000 counts | High rate bins dominated by noise | Noise dominated (total time) | Noise dominated (detector-on time) | Marked lightcurve |
|---|---|---|---|---|---|---|---|
| A | 7422 | 5267 | 0 | 0 | 0.00% | 0.00% | 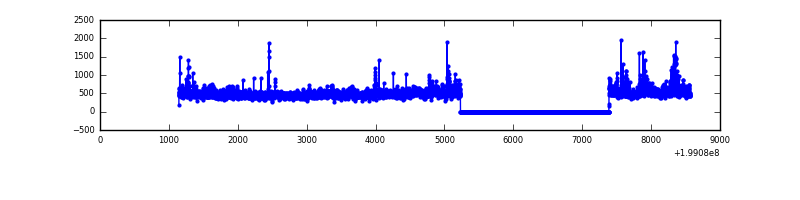 |
| B | 7422 | 5267 | 443 | 443 | 5.97% | 8.41% | 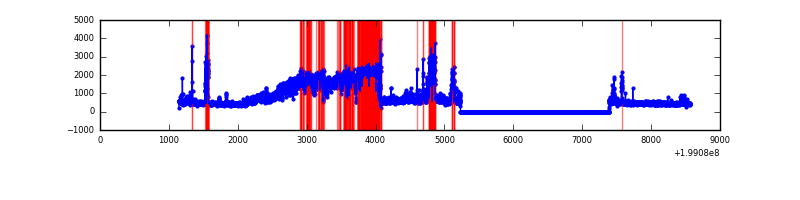 |
| C | 7422 | 5267 | 274 | 274 | 3.69% | 5.20% | 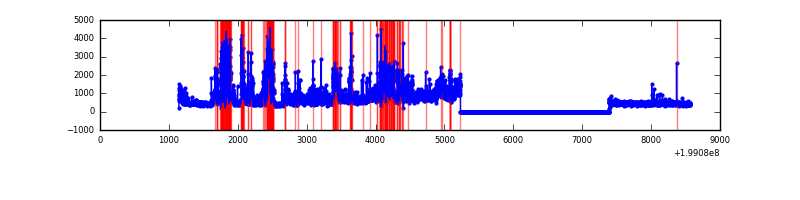 |
| D | 7422 | 5267 | 77 | 77 | 1.04% | 1.46% | 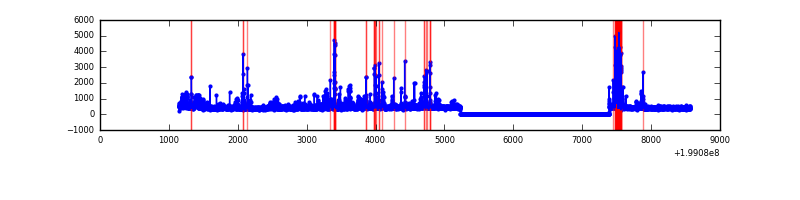 |
Top three noisy pixels from each quadrant. If the there are fewer than three noisy pixels in the level2.evt file, extra rows are filled as -1
| Pixel properties | Quadrant properties | ||||||
|---|---|---|---|---|---|---|---|
| Quadrant | DetID | PixID | Counts | Sigma | Mean | Median | Sigma |
| A | 8 | 15 | 166566 | 1380.77 | 595 | 585 | 120.2 |
| A | 0 | 50 | 117303 | 970.96 | 595 | 585 | 120.2 |
| A | 5 | 113 | 27082 | 220.42 | 595 | 585 | 120.2 |
| B | 4 | 81 | 2041448 | 18336.68 | 587 | 575 | 111.3 |
| B | 2 | 249 | 236108 | 2116.2 | 587 | 575 | 111.3 |
| B | 15 | 204 | 162950 | 1458.89 | 587 | 575 | 111.3 |
| C | 0 | 219 | 1589128 | 12402.61 | 553 | 559 | 128.1 |
| C | 14 | 223 | 557017 | 4344.49 | 553 | 559 | 128.1 |
| C | 15 | 208 | 49623 | 383.06 | 553 | 559 | 128.1 |
| D | 7 | 6 | 326261 | 2311.86 | 560 | 546 | 140.9 |
| D | 10 | 199 | 87521 | 617.33 | 560 | 546 | 140.9 |
| D | 9 | 82 | 72963 | 514.0 | 560 | 546 | 140.9 |
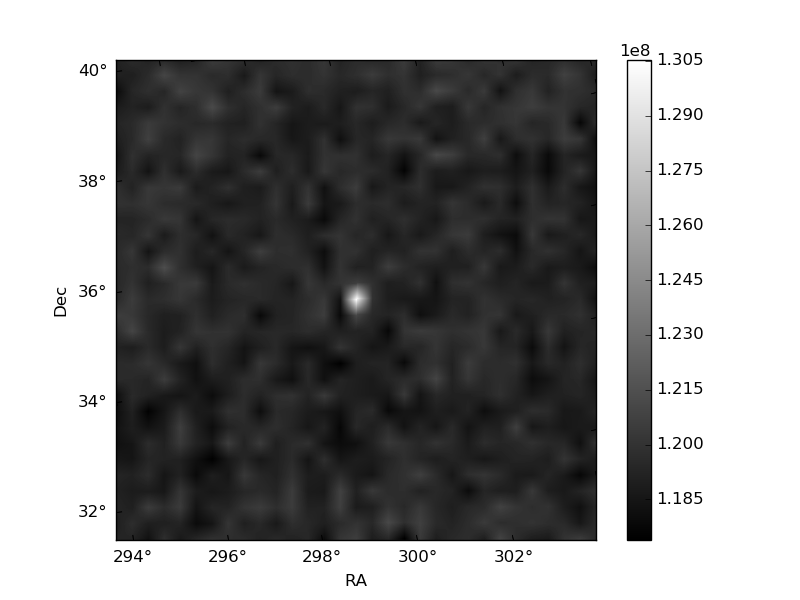
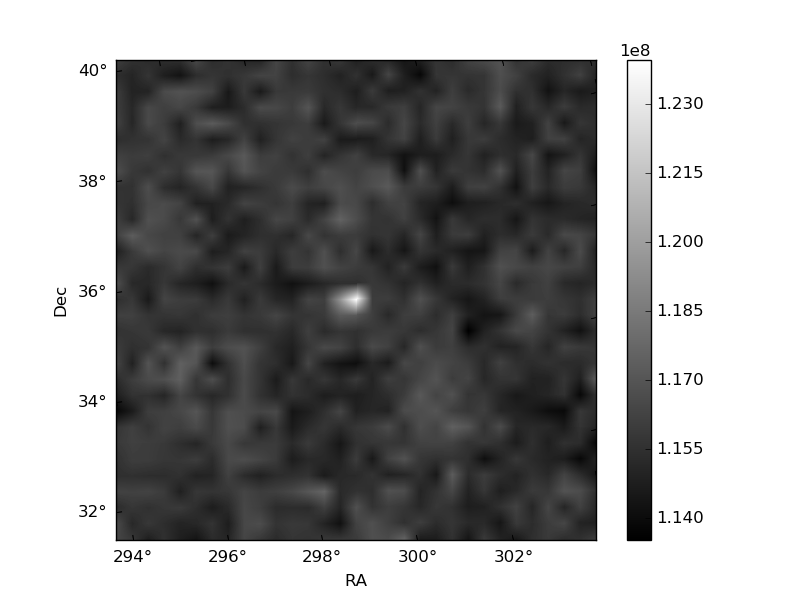
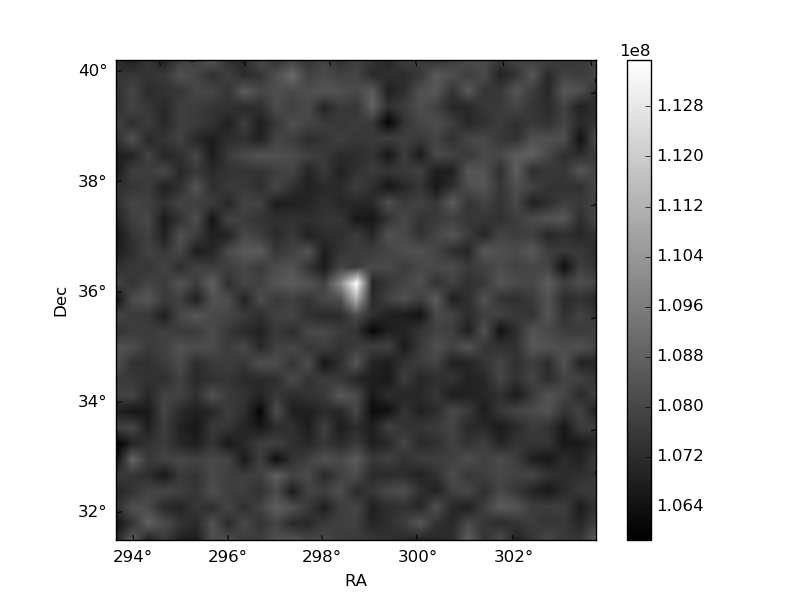
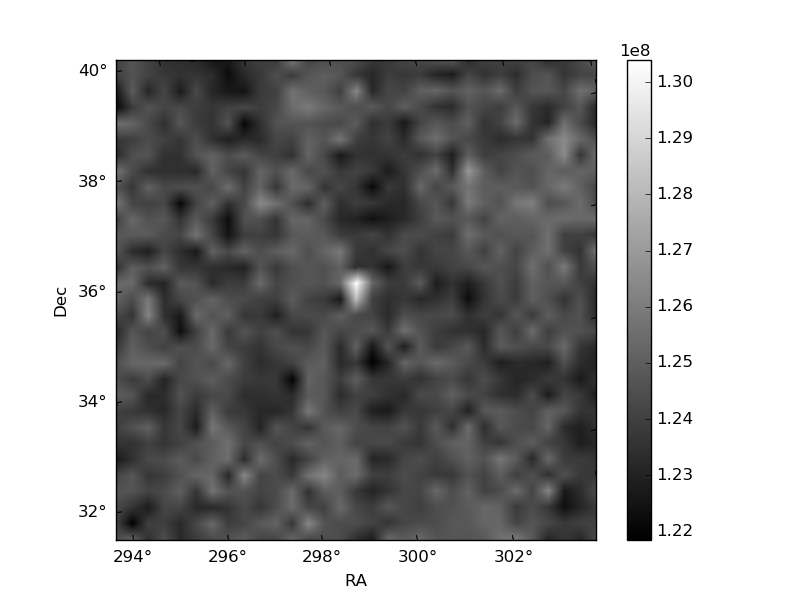
Histogram calculated using DETX and DETY for each event in the final _common_clean file
| Quadrant A | 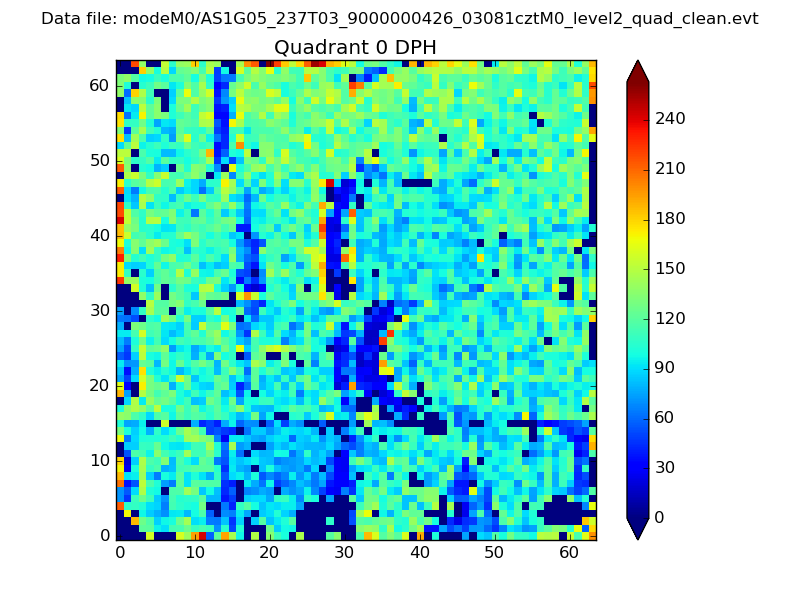 |
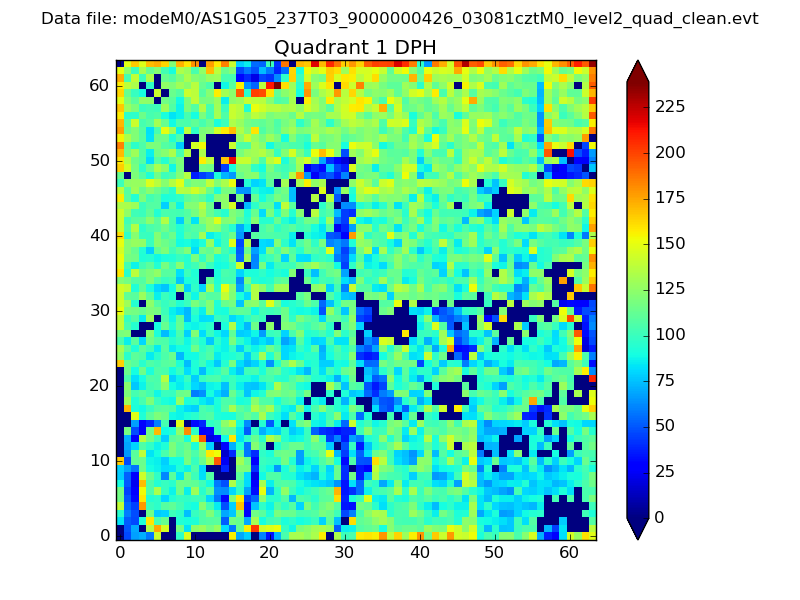 |
Quadrant B |
|---|---|---|---|
| Quadrant D | 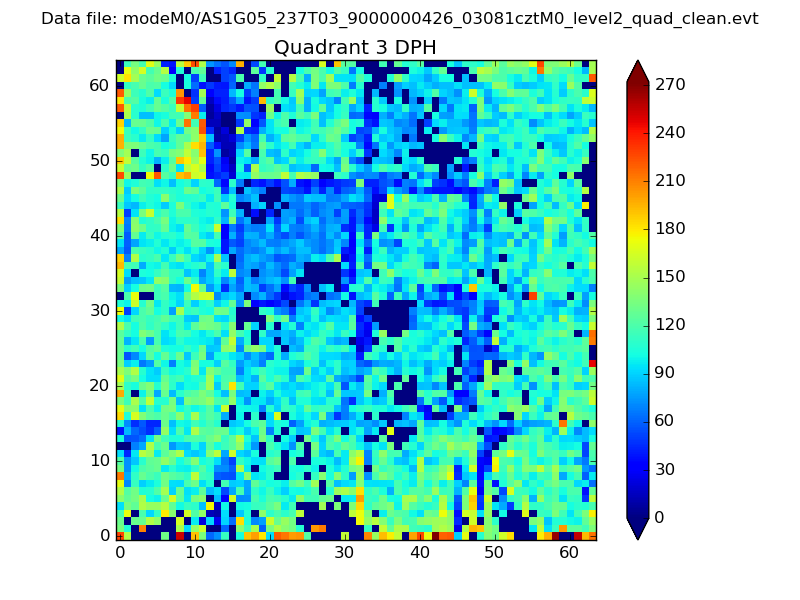 |
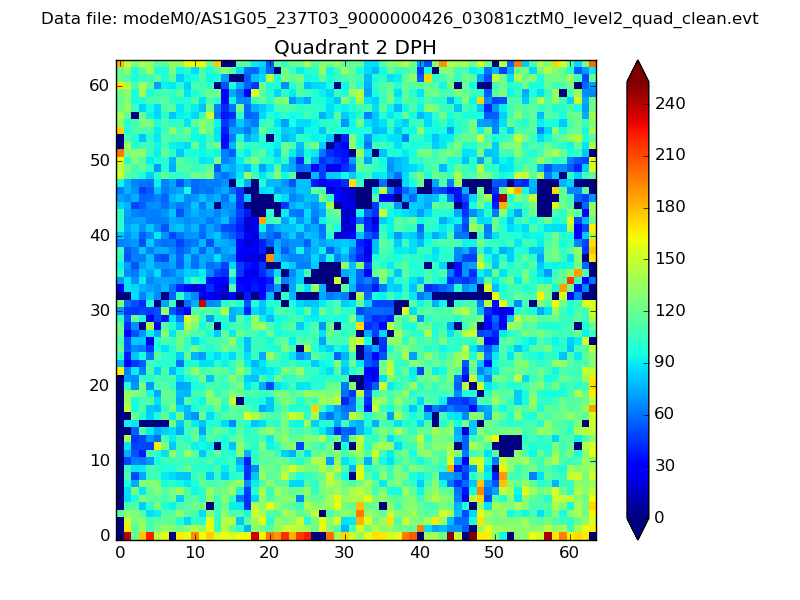 |
Quadrant C |
| Plot type | Count rate plots | Images |
|---|---|---|
| Comparison with Poisson distribution Blue bars denote a histogram of data divided into 1 sec bins. Red curve is a Poisson curve with rate = median count rate of data. |
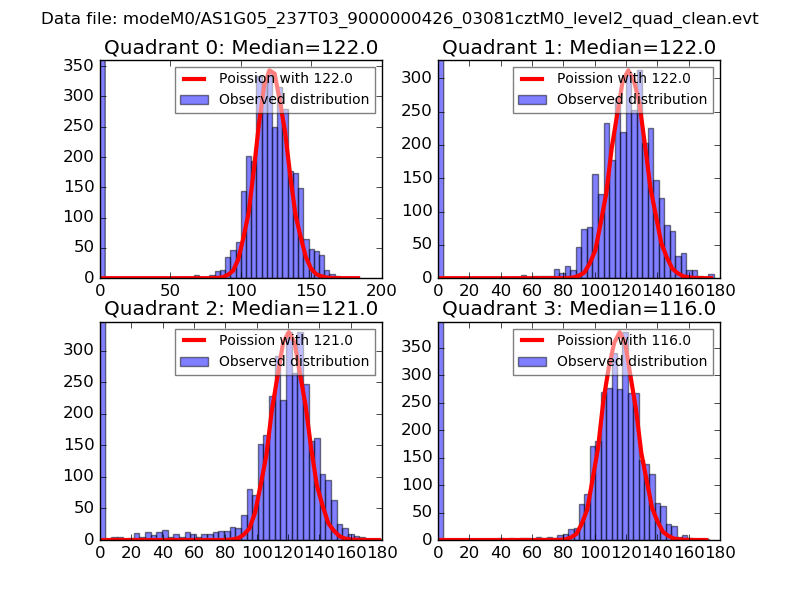 |
 |
| Quadrant-wise count rates Data is divided into 100 sec bins |
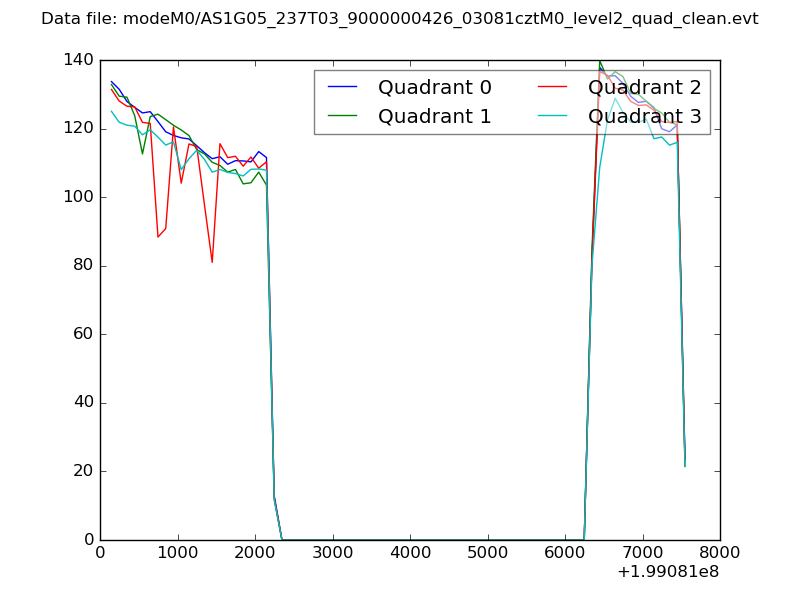 |
|
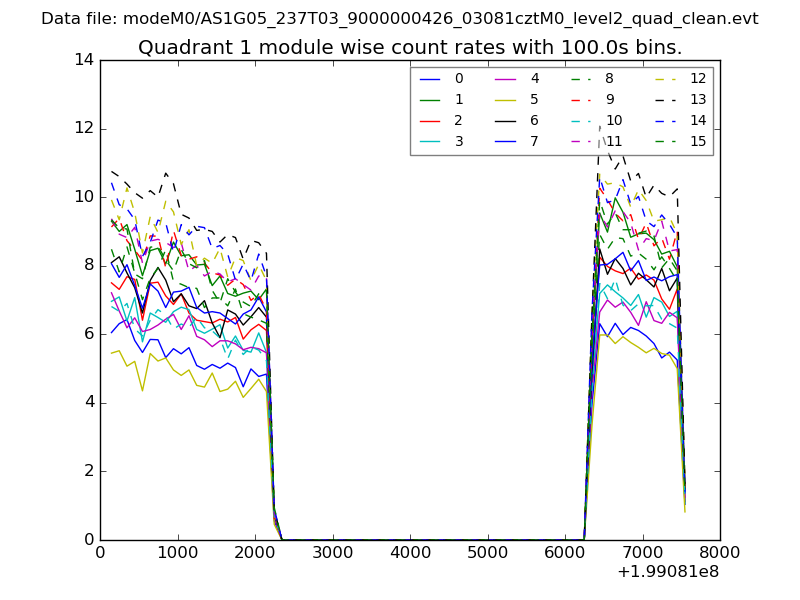
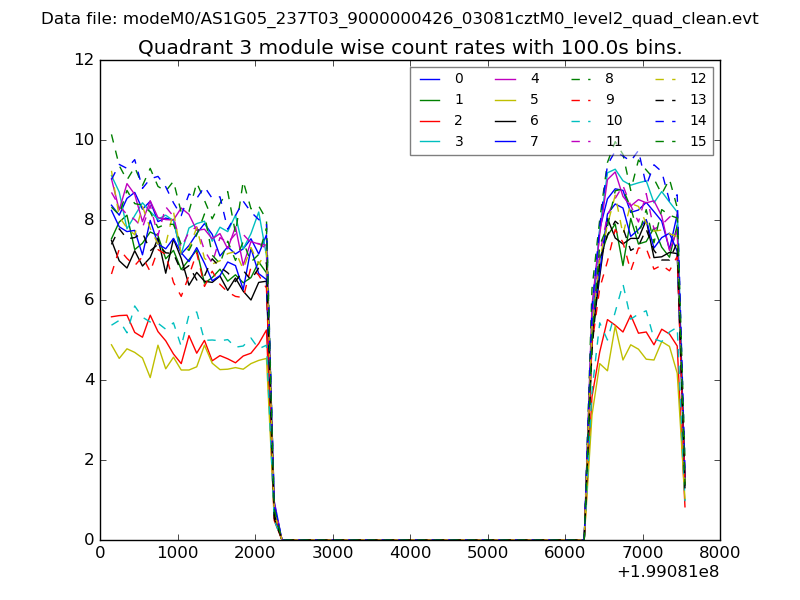
| Module-wise count rates for Quadrant A Data is divided into 100 sec bins |
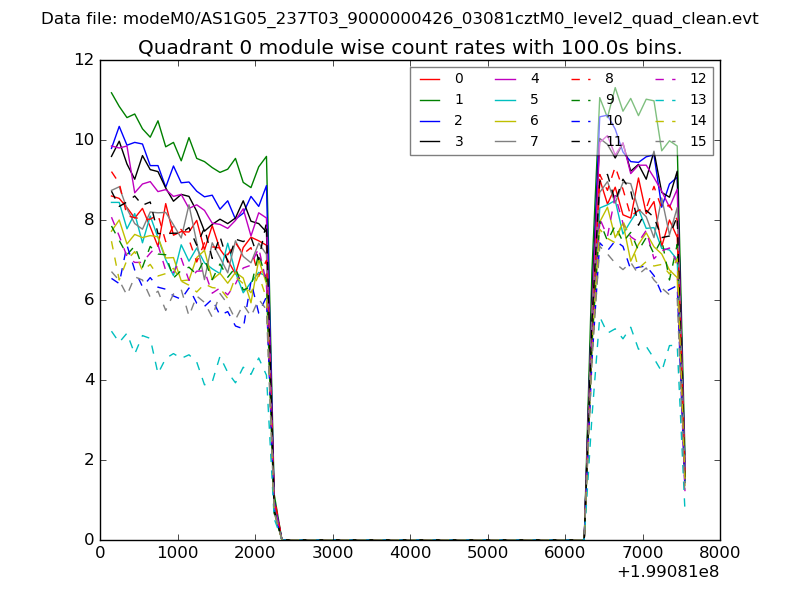 |
 |
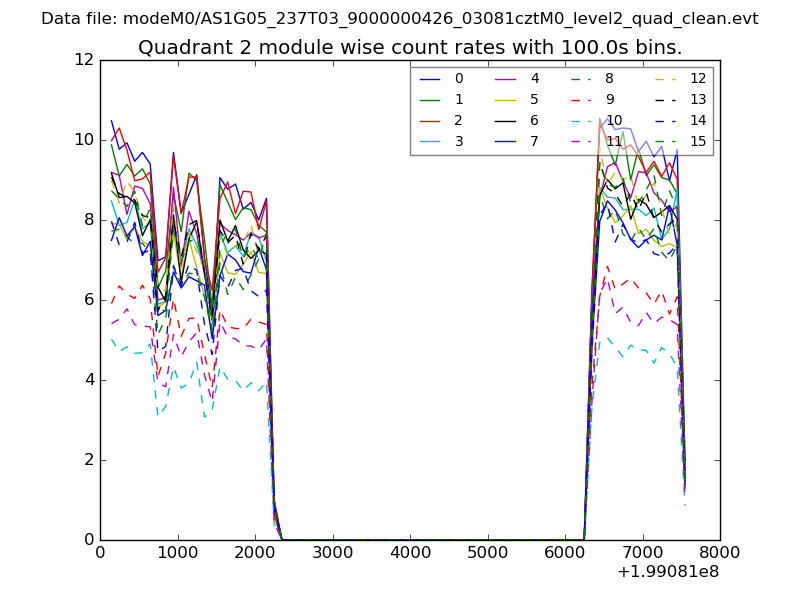
| Module-wise count rates for Quadrant B Data is divided into 100 sec bins |
 |
 |
| Module-wise count rates for Quadrant C Data is divided into 100 sec bins |
 |
 |
| Module-wise count rates for Quadrant D Data is divided into 100 sec bins |
 |
 |
| Parameter | Plot |
|---|---|
| CZT HV Monitor | 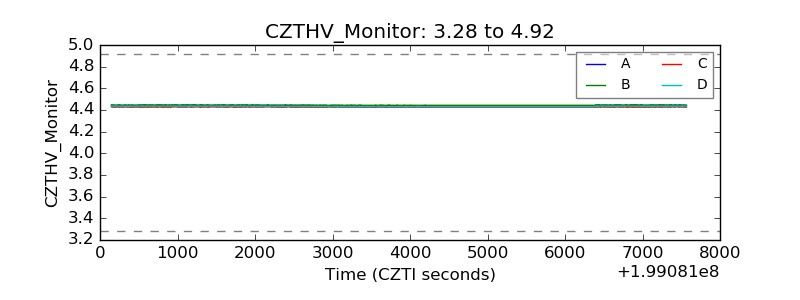 |
| D_VDD | 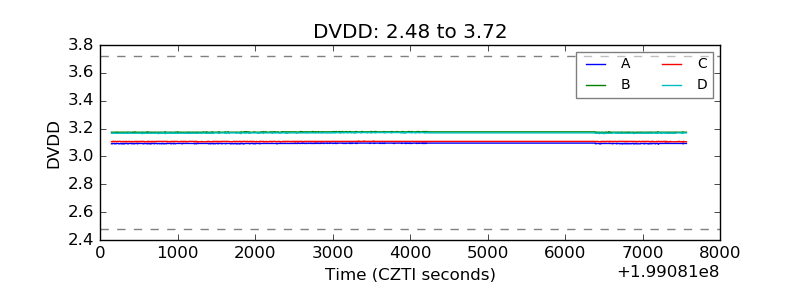 |
| Temperature 1 | 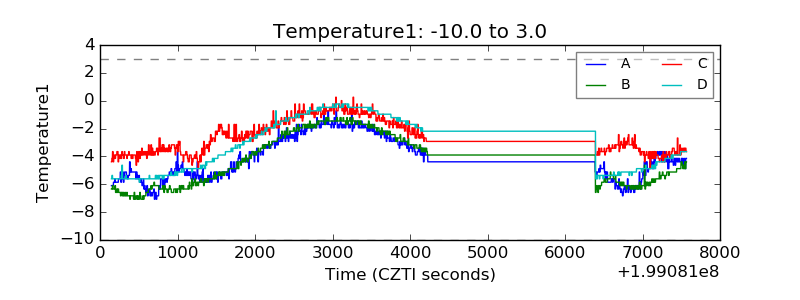 |
| Veto HV Monitor | 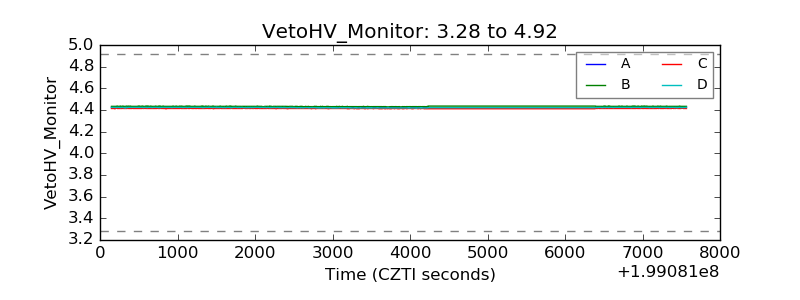 |
| Veto LLD | 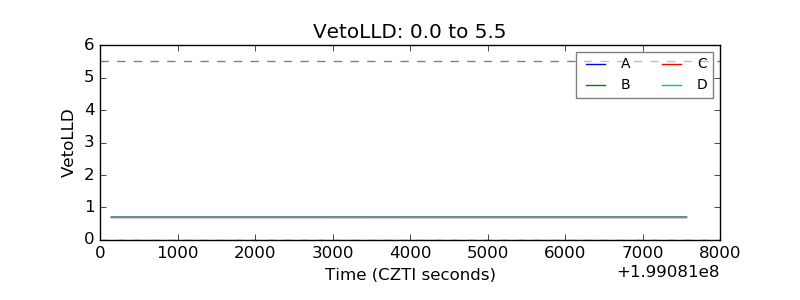 |
| Alpha Counter | 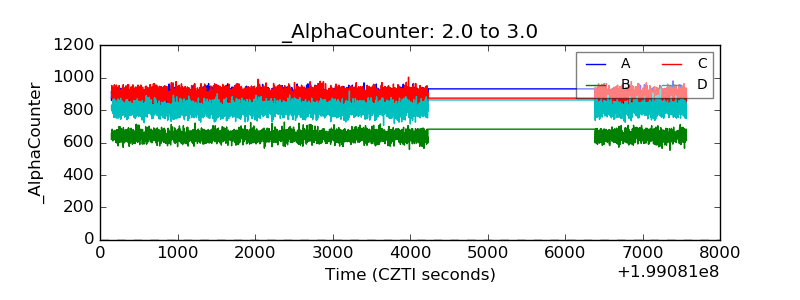 |
| _CPM_Rate | 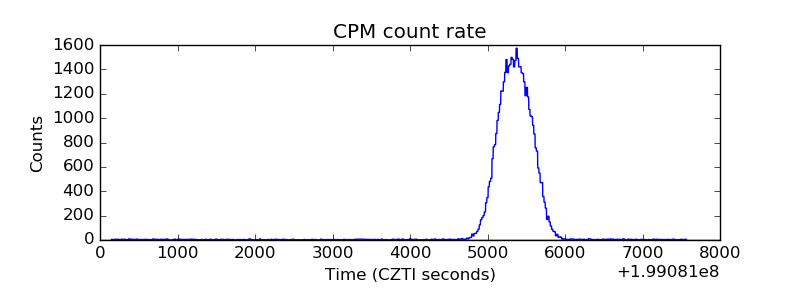 |
| CZT Counter | 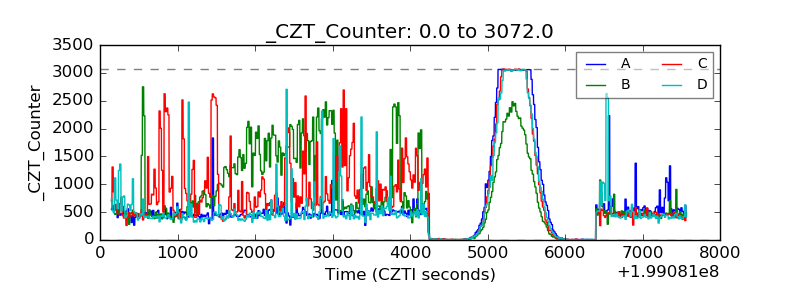 |
| +2.5 Volts monitor |  |
| +5 Volts monitor |  |
| _ROLL_ROT | 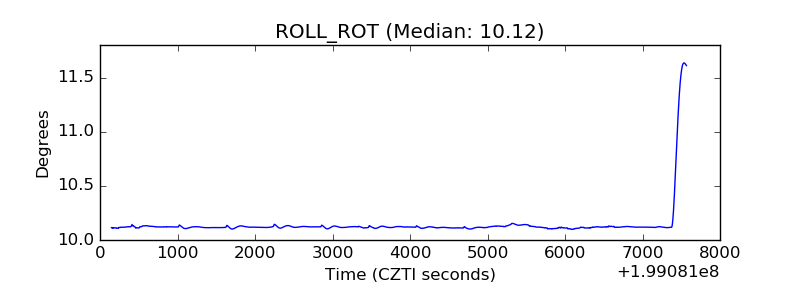 |
| _Roll_DEC | 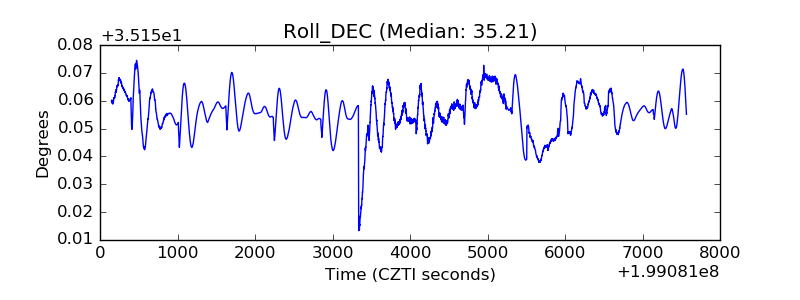 |
| _Roll_RA | 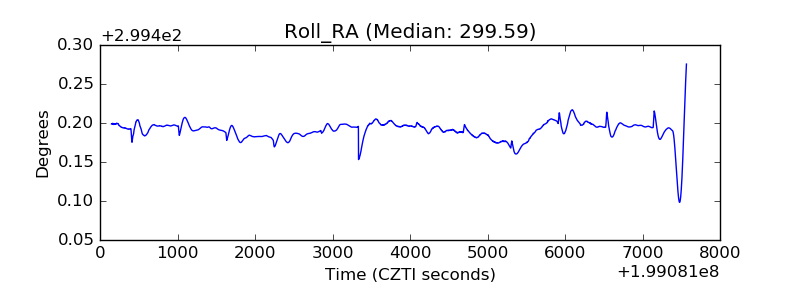 |
| Veto Counter | 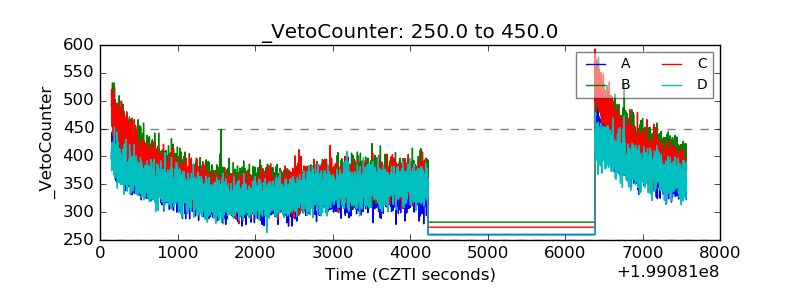 |