| Param | Original file | Final file |
|---|---|---|
| Filename | modeM0/AS1G05_237T03_9000000426_03082cztM0_level2.evt | modeM0/AS1G05_237T03_9000000426_03082cztM0_level2_quad_clean.evt |
| Size (bytes) | 467,213,760 | 79,692,480 |
| Size | 445.6 MB | 76.0 MB |
| Events in quadrant A | 3,970,181 | 502,592 |
| Events in quadrant B | 3,637,252 | 509,753 |
| Events in quadrant C | 2,937,948 | 504,288 |
| Events in quadrant D | 3,198,064 | 478,410 |
| Mode M9 | |||
|---|---|---|---|
| Quadrant | BADHDUFLAG | Total packets | Discarded packets |
| A | 0 | 13 | 0 |
| B | 0 | 13 | 0 |
| C | 0 | 13 | 0 |
| D | 0 | 13 | 0 |
| Mode M0 | |||
|---|---|---|---|
| Quadrant | BADHDUFLAG | Total packets | Discarded packets |
| A | 0 | 15783 | 3 |
| B | 0 | 14742 | 2 |
| C | 0 | 12666 | 2 |
| D | 0 | 13603 | 2 |
| Mode SS | |||
|---|---|---|---|
| Quadrant | BADHDUFLAG | Total packets | Discarded packets |
| A | 0 | 122 | 0 |
| B | 0 | 122 | 0 |
| C | 0 | 122 | 0 |
| D | 0 | 122 | 0 |
| Quadrant | Total seconds | Saturated seconds | Saturation percentage |
|---|---|---|---|
| A | 5987 | 66 | 1.102389% |
| B | 5987 | 109 | 1.820611% |
| C | 5987 | 22 | 0.367463% |
| D | 5988 | 104 | 1.736807% |
Noise dominated data is calculated using 1-second bins in cleaned event files. If a bin has >2000 counts, and if more than 50% of those come from <1% of pixels, then it is considered to be noise-dominated and hence unusable.
| Quadrant | # 1 sec bins | Bins with >0 counts | Bins with >2000 counts | High rate bins dominated by noise | Noise dominated (total time) | Noise dominated (detector-on time) | Marked lightcurve |
|---|---|---|---|---|---|---|---|
| A | 7287 | 5988 | 13 | 13 | 0.18% | 0.22% | 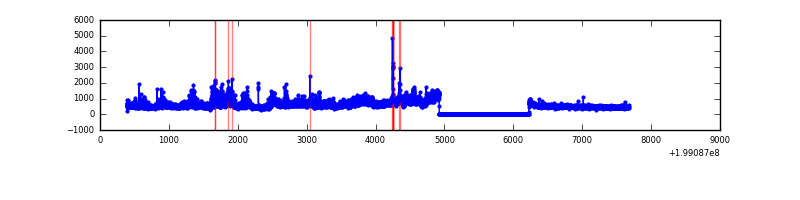 |
| B | 7287 | 5988 | 84 | 84 | 1.15% | 1.40% | 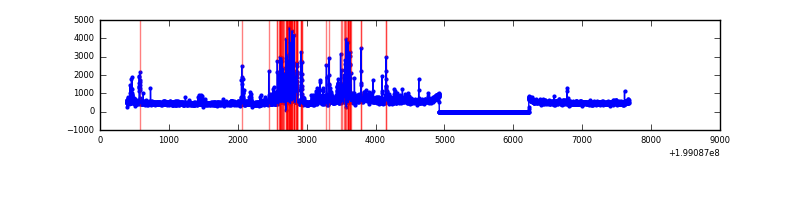 |
| C | 7287 | 5988 | 11 | 11 | 0.15% | 0.18% | 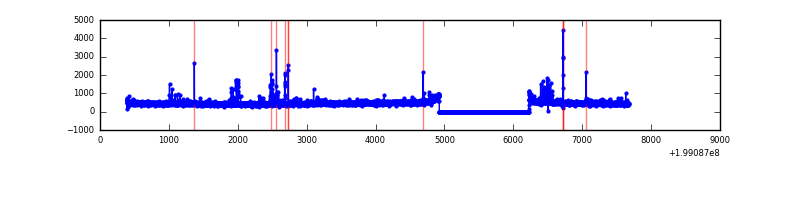 |
| D | 7288 | 5989 | 69 | 69 | 0.95% | 1.15% | 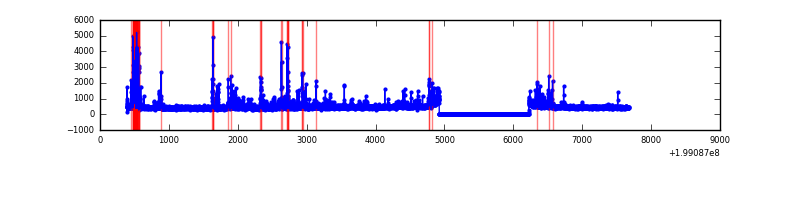 |
Top three noisy pixels from each quadrant. If the there are fewer than three noisy pixels in the level2.evt file, extra rows are filled as -1
| Pixel properties | Quadrant properties | ||||||
|---|---|---|---|---|---|---|---|
| Quadrant | DetID | PixID | Counts | Sigma | Mean | Median | Sigma |
| A | 8 | 15 | 710766 | 4890.71 | 718 | 707 | 145.2 |
| A | 0 | 50 | 337896 | 2322.47 | 718 | 707 | 145.2 |
| A | 12 | 247 | 44245 | 299.88 | 718 | 707 | 145.2 |
| B | 2 | 249 | 470426 | 3446.48 | 722 | 710 | 136.3 |
| B | 15 | 204 | 201844 | 1475.79 | 722 | 710 | 136.3 |
| B | 0 | 219 | 67969 | 493.5 | 722 | 710 | 136.3 |
| C | 0 | 219 | 91407 | 569.69 | 688 | 695 | 159.2 |
| C | 6 | 80 | 34936 | 215.04 | 688 | 695 | 159.2 |
| C | 5 | 250 | 27297 | 167.07 | 688 | 695 | 159.2 |
| D | 7 | 6 | 368344 | 2024.32 | 680 | 668 | 181.6 |
| D | 10 | 213 | 76089 | 415.25 | 680 | 668 | 181.6 |
| D | 10 | 172 | 27811 | 149.44 | 680 | 668 | 181.6 |
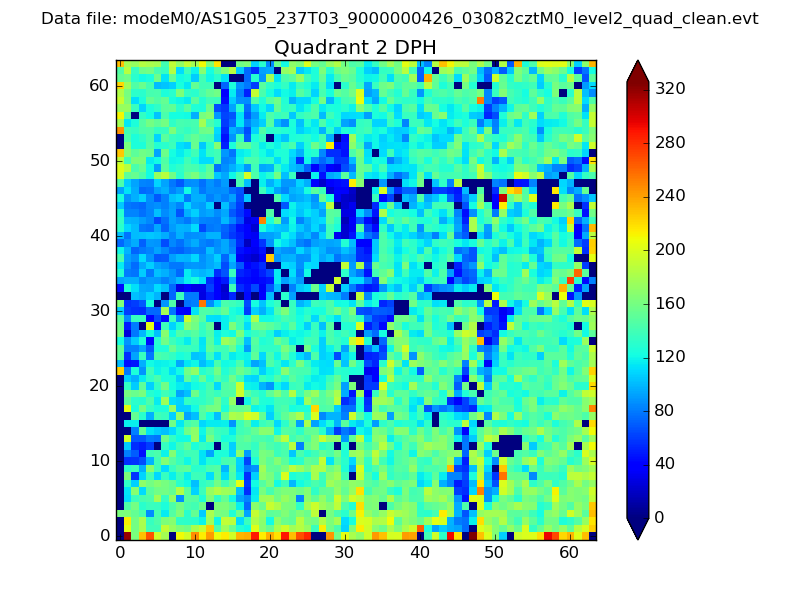
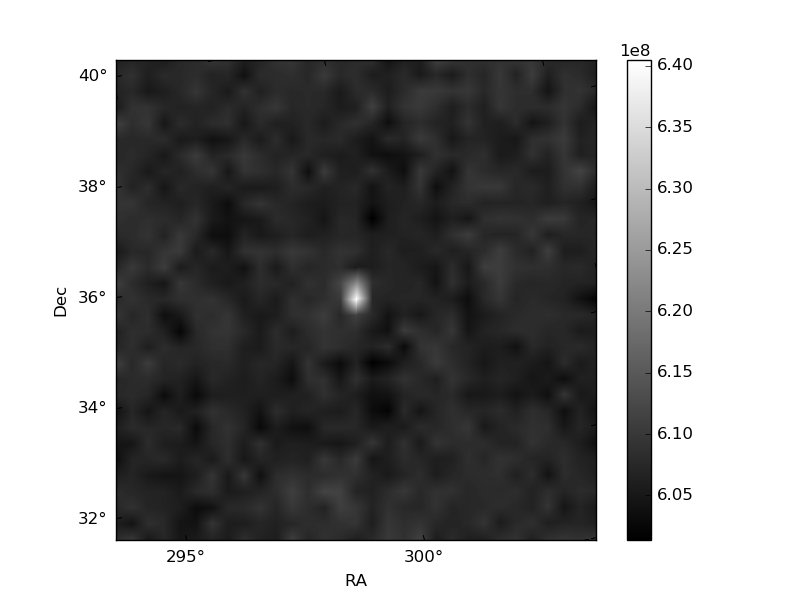
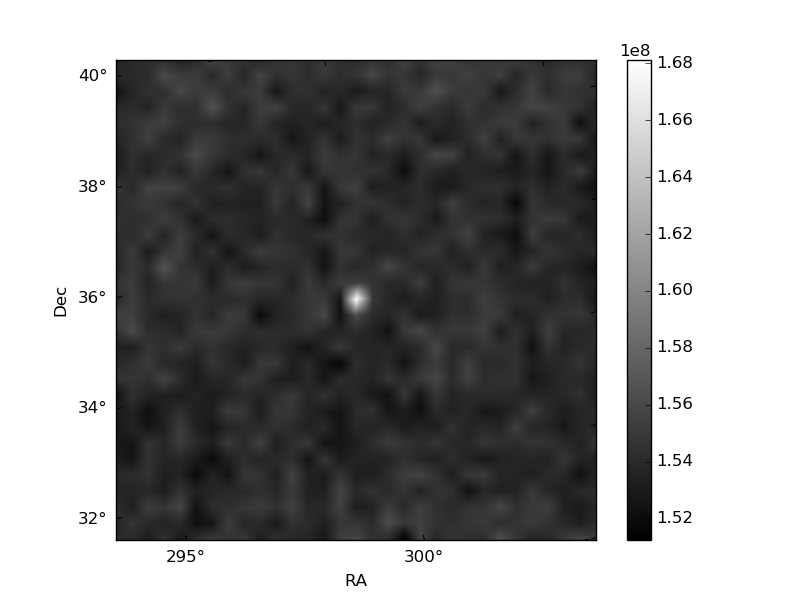
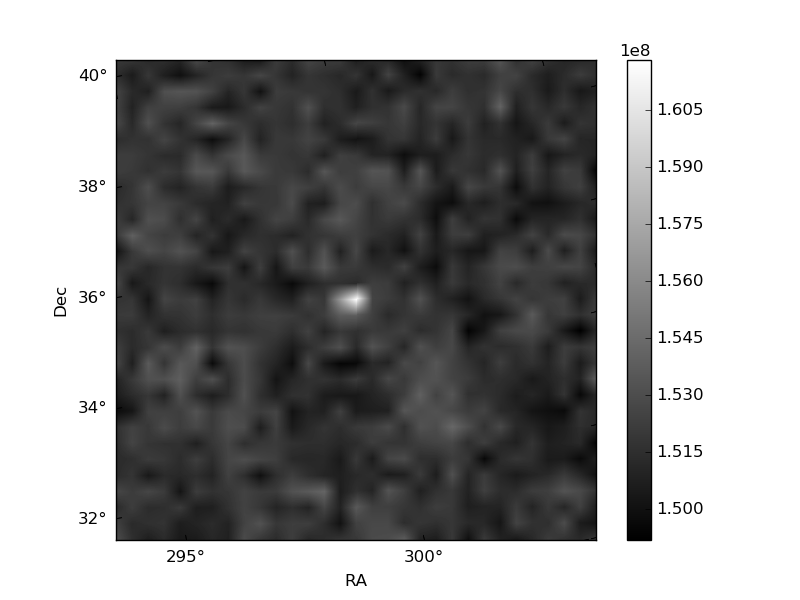
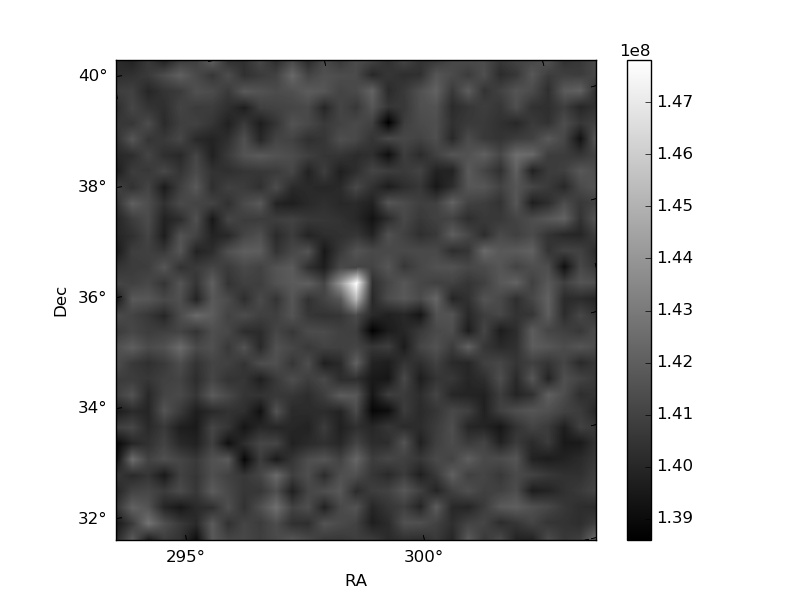
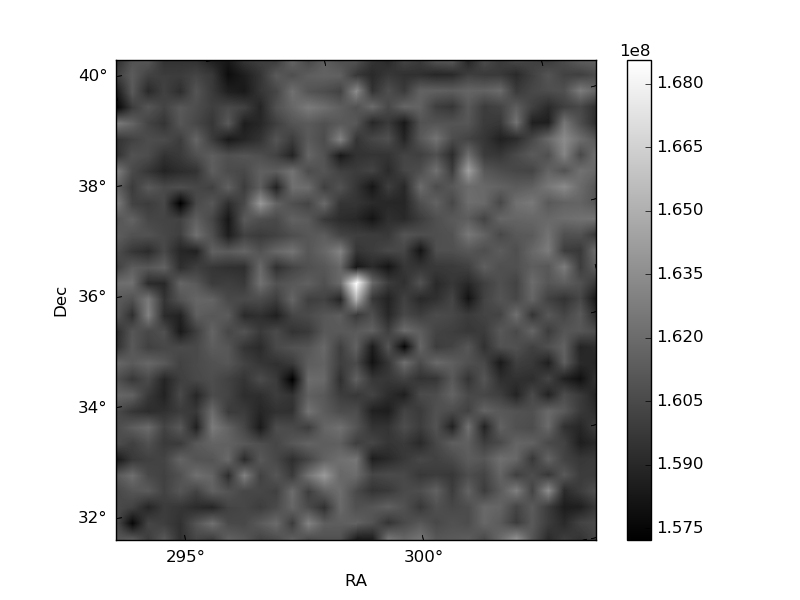
Histogram calculated using DETX and DETY for each event in the final _common_clean file
| Quadrant A | 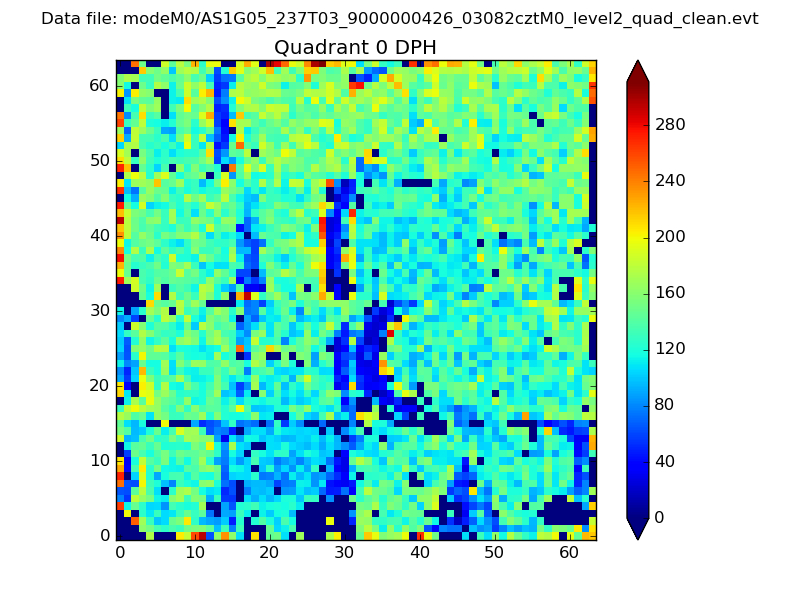 |
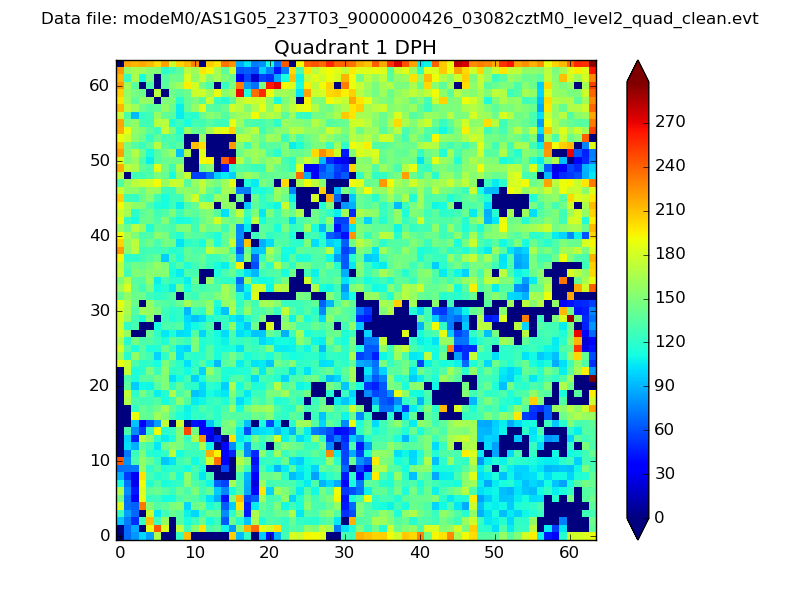 |
Quadrant B |
|---|---|---|---|
| Quadrant D | 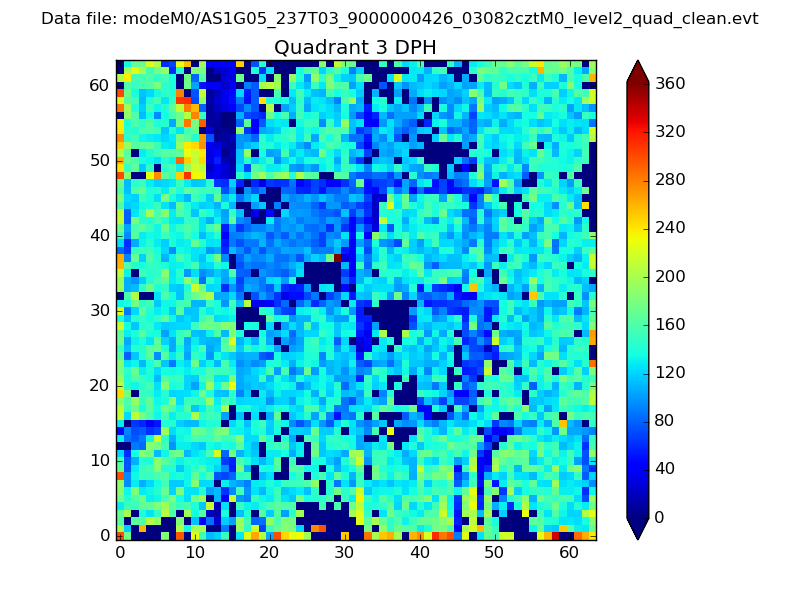 |
 |
Quadrant C |
| Plot type | Count rate plots | Images |
|---|---|---|
| Comparison with Poisson distribution Blue bars denote a histogram of data divided into 1 sec bins. Red curve is a Poisson curve with rate = median count rate of data. |
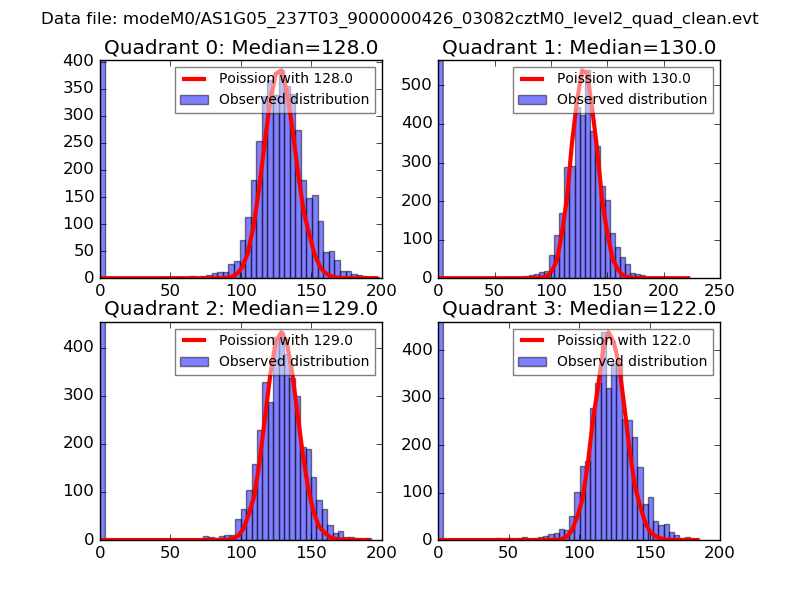 |
 |
| Quadrant-wise count rates Data is divided into 100 sec bins |
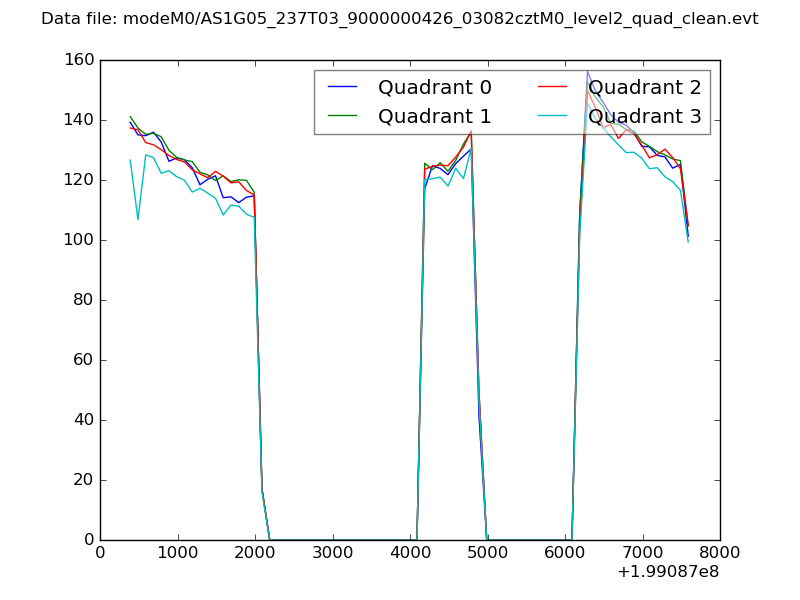 |
|
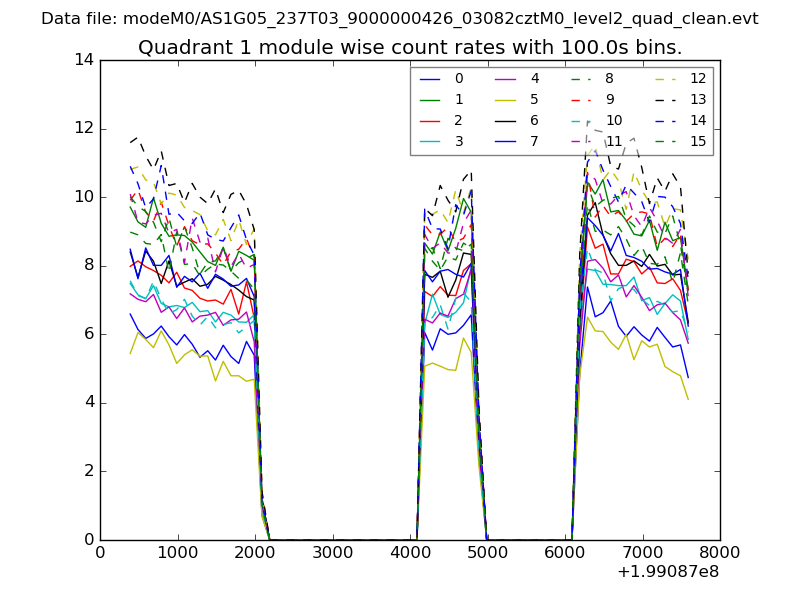
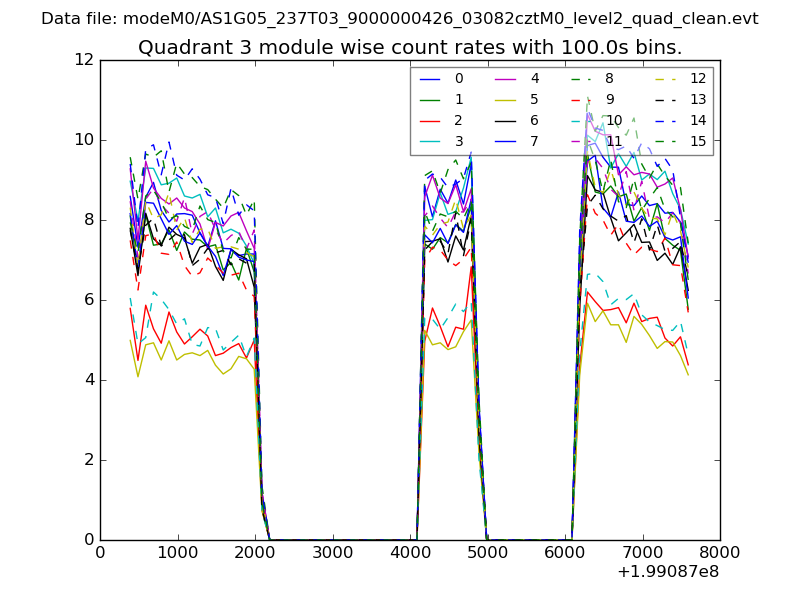
| Module-wise count rates for Quadrant A Data is divided into 100 sec bins |
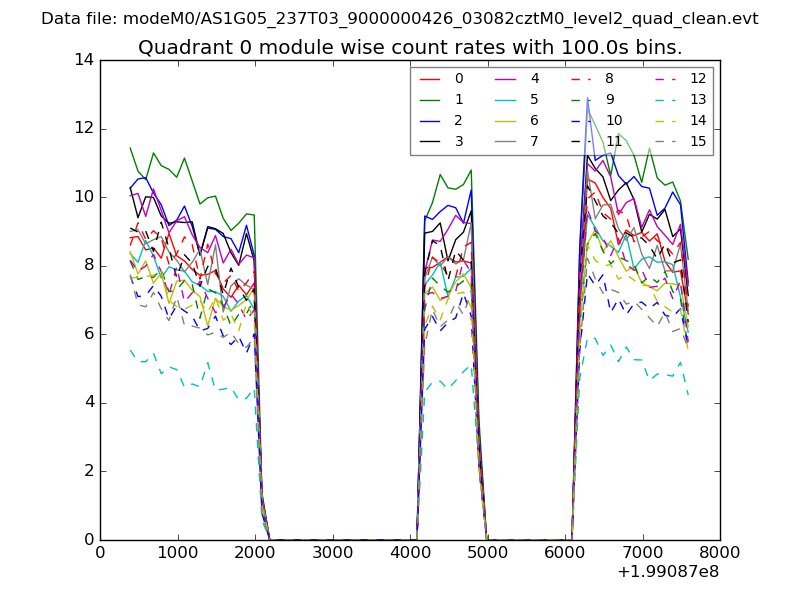 |
 |
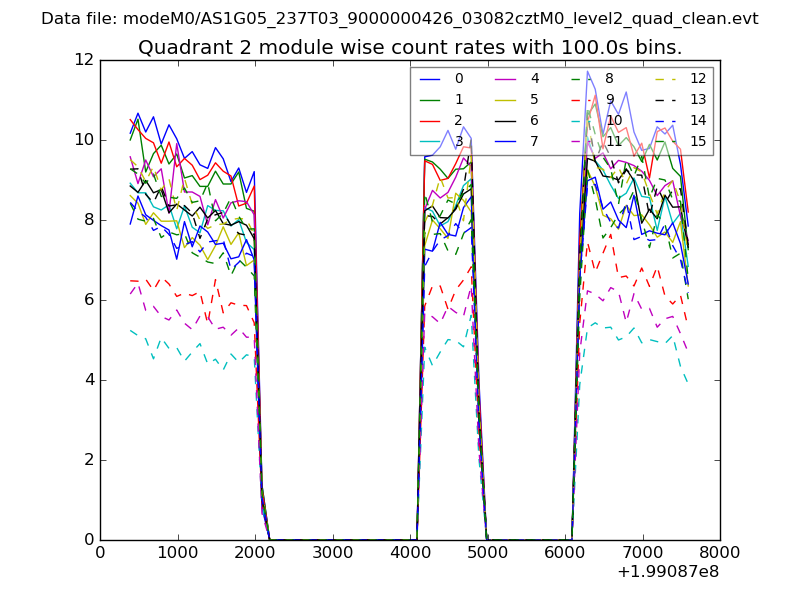
| Module-wise count rates for Quadrant B Data is divided into 100 sec bins |
 |
 |
| Module-wise count rates for Quadrant C Data is divided into 100 sec bins |
 |
 |
| Module-wise count rates for Quadrant D Data is divided into 100 sec bins |
 |
 |
| Parameter | Plot |
|---|---|
| CZT HV Monitor | 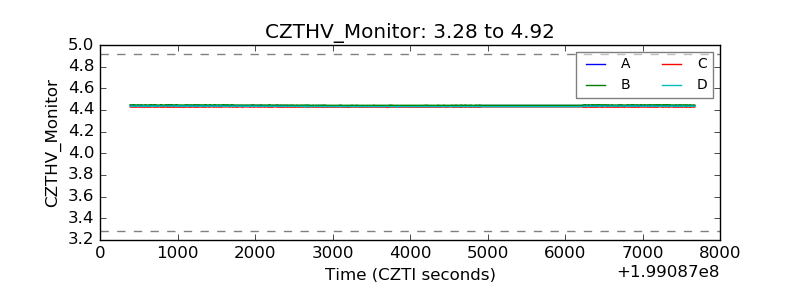 |
| D_VDD | 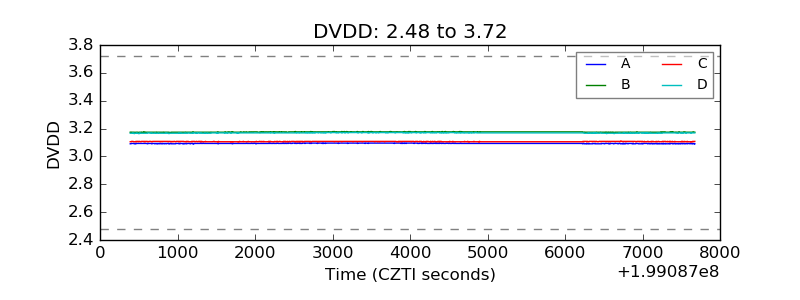 |
| Temperature 1 | 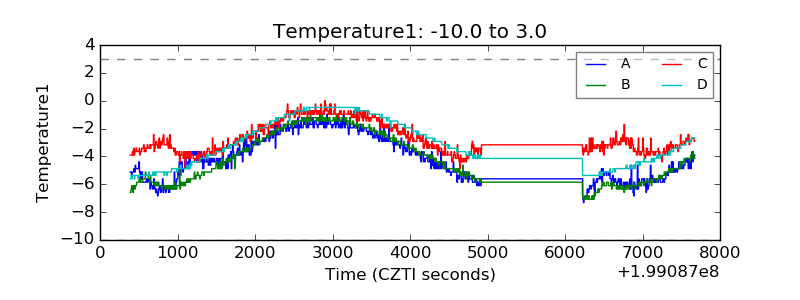 |
| Veto HV Monitor | 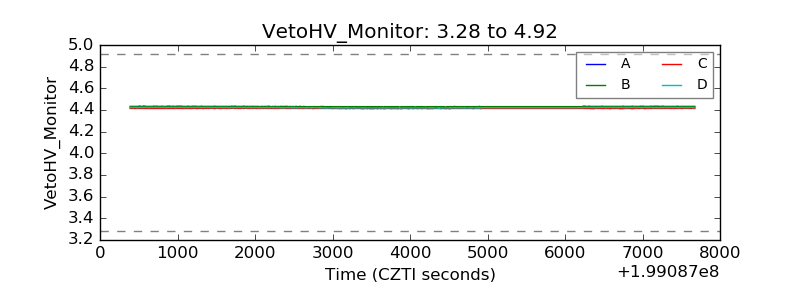 |
| Veto LLD | 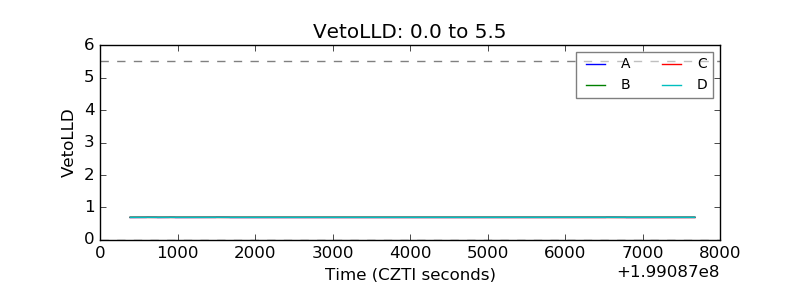 |
| Alpha Counter | 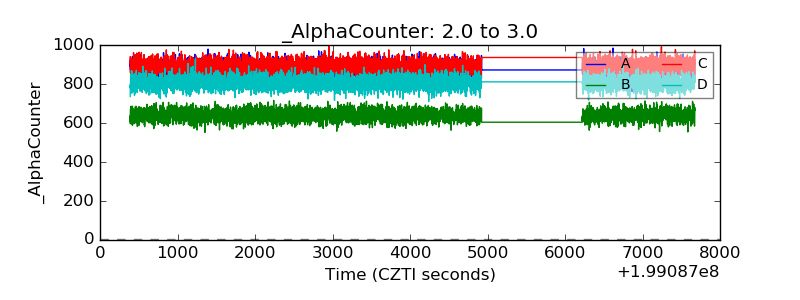 |
| _CPM_Rate | 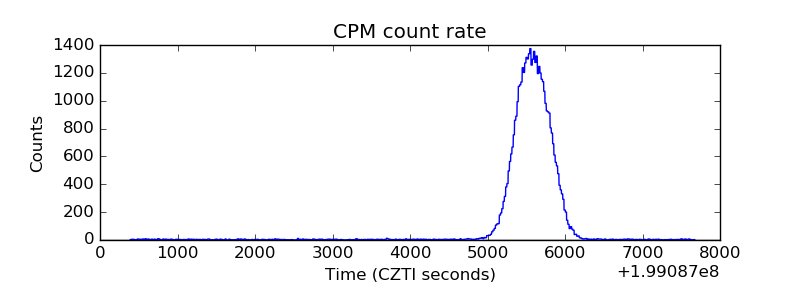 |
| CZT Counter | 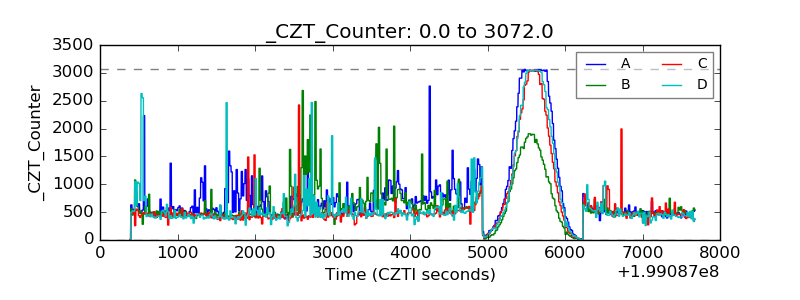 |
| +2.5 Volts monitor |  |
| +5 Volts monitor |  |
| _ROLL_ROT | 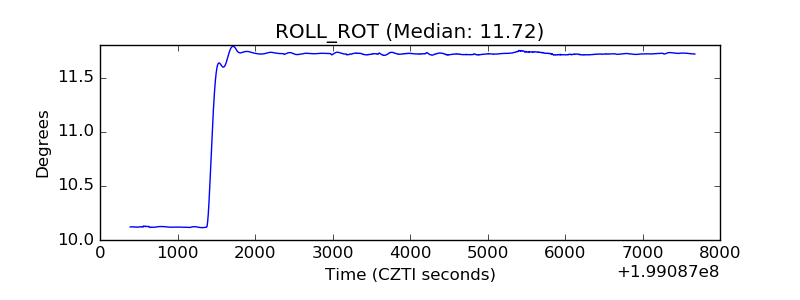 |
| _Roll_DEC | 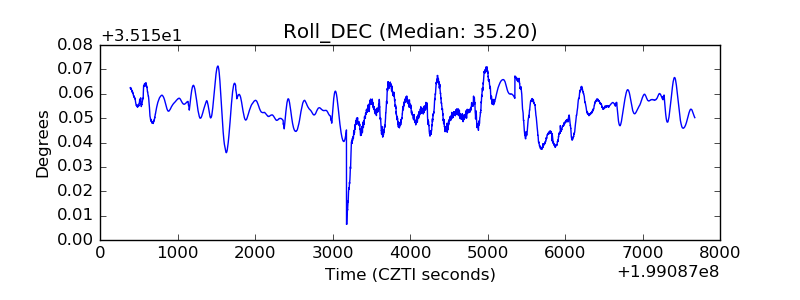 |
| _Roll_RA | 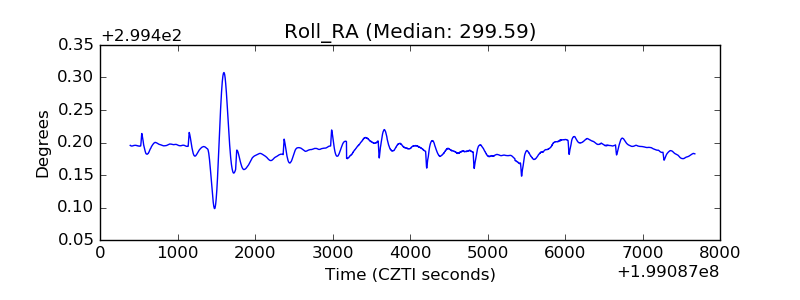 |
| Veto Counter | 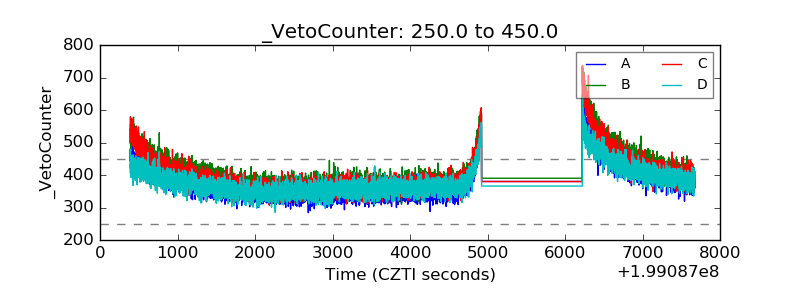 |