| Param | Original file | Final file |
|---|---|---|
| Filename | modeM0/AS1G05_237T03_9000000426_03083cztM0_level2.evt | modeM0/AS1G05_237T03_9000000426_03083cztM0_level2_quad_clean.evt |
| Size (bytes) | 436,944,960 | 76,109,760 |
| Size | 416.7 MB | 72.6 MB |
| Events in quadrant A | 3,052,494 | 482,030 |
| Events in quadrant B | 3,510,067 | 482,064 |
| Events in quadrant C | 3,247,665 | 469,711 |
| Events in quadrant D | 3,026,033 | 462,734 |
| Mode M9 | |||
|---|---|---|---|
| Quadrant | BADHDUFLAG | Total packets | Discarded packets |
| A | 0 | 13 | 0 |
| B | 0 | 13 | 0 |
| C | 0 | 13 | 0 |
| D | 0 | 13 | 0 |
| Mode M0 | |||
|---|---|---|---|
| Quadrant | BADHDUFLAG | Total packets | Discarded packets |
| A | 0 | 12490 | 2 |
| B | 0 | 14059 | 1 |
| C | 0 | 13521 | 1 |
| D | 0 | 12857 | 1 |
| Mode SS | |||
|---|---|---|---|
| Quadrant | BADHDUFLAG | Total packets | Discarded packets |
| A | 0 | 118 | 0 |
| B | 0 | 118 | 0 |
| C | 0 | 118 | 0 |
| D | 0 | 118 | 0 |
| Quadrant | Total seconds | Saturated seconds | Saturation percentage |
|---|---|---|---|
| A | 5839 | 70 | 1.198835% |
| B | 5839 | 85 | 1.455729% |
| C | 5839 | 177 | 3.031341% |
| D | 5839 | 51 | 0.873437% |
Noise dominated data is calculated using 1-second bins in cleaned event files. If a bin has >2000 counts, and if more than 50% of those come from <1% of pixels, then it is considered to be noise-dominated and hence unusable.
| Quadrant | # 1 sec bins | Bins with >0 counts | Bins with >2000 counts | High rate bins dominated by noise | Noise dominated (total time) | Noise dominated (detector-on time) | Marked lightcurve |
|---|---|---|---|---|---|---|---|
| A | 7119 | 5840 | 16 | 16 | 0.22% | 0.27% | 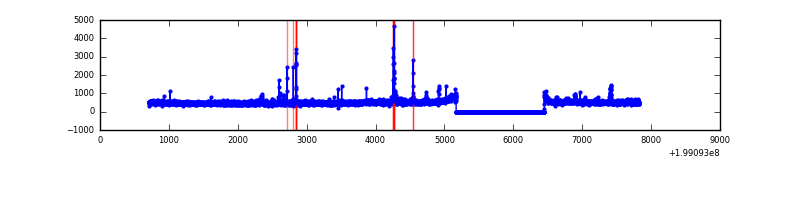 |
| B | 7119 | 5840 | 24 | 24 | 0.34% | 0.41% | 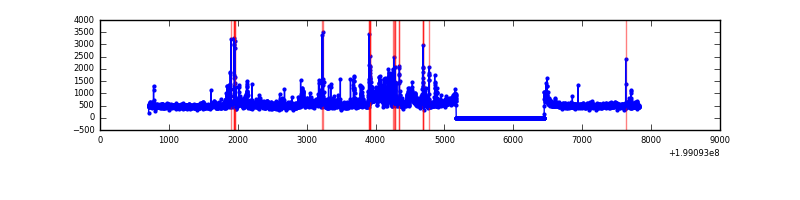 |
| C | 7119 | 5840 | 61 | 61 | 0.86% | 1.04% | 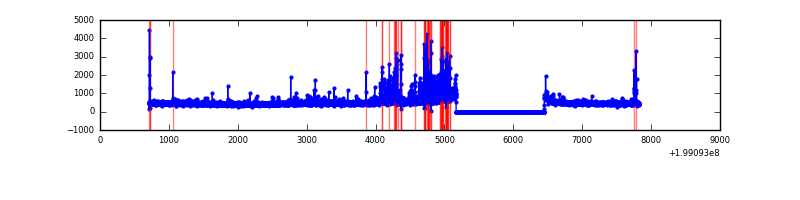 |
| D | 7119 | 5840 | 22 | 22 | 0.31% | 0.38% | 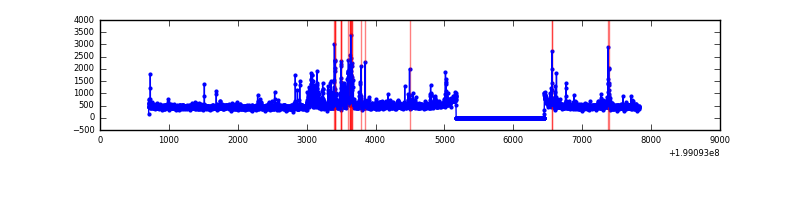 |
Top three noisy pixels from each quadrant. If the there are fewer than three noisy pixels in the level2.evt file, extra rows are filled as -1
| Pixel properties | Quadrant properties | ||||||
|---|---|---|---|---|---|---|---|
| Quadrant | DetID | PixID | Counts | Sigma | Mean | Median | Sigma |
| A | 8 | 15 | 122827 | 850.98 | 714 | 702 | 143.5 |
| A | 12 | 113 | 69006 | 475.95 | 714 | 702 | 143.5 |
| A | 0 | 50 | 59587 | 410.32 | 714 | 702 | 143.5 |
| B | 0 | 230 | 238283 | 1752.9 | 714 | 701 | 135.5 |
| B | 7 | 252 | 203441 | 1495.83 | 714 | 701 | 135.5 |
| B | 0 | 219 | 112647 | 825.95 | 714 | 701 | 135.5 |
| C | 14 | 223 | 403197 | 2580.8 | 672 | 679 | 156.0 |
| C | 6 | 80 | 50061 | 316.62 | 672 | 679 | 156.0 |
| C | 1 | 16 | 41799 | 263.65 | 672 | 679 | 156.0 |
| D | 10 | 213 | 135536 | 748.63 | 679 | 666 | 180.2 |
| D | 10 | 199 | 56747 | 311.29 | 679 | 666 | 180.2 |
| D | 12 | 217 | 55509 | 304.42 | 679 | 666 | 180.2 |
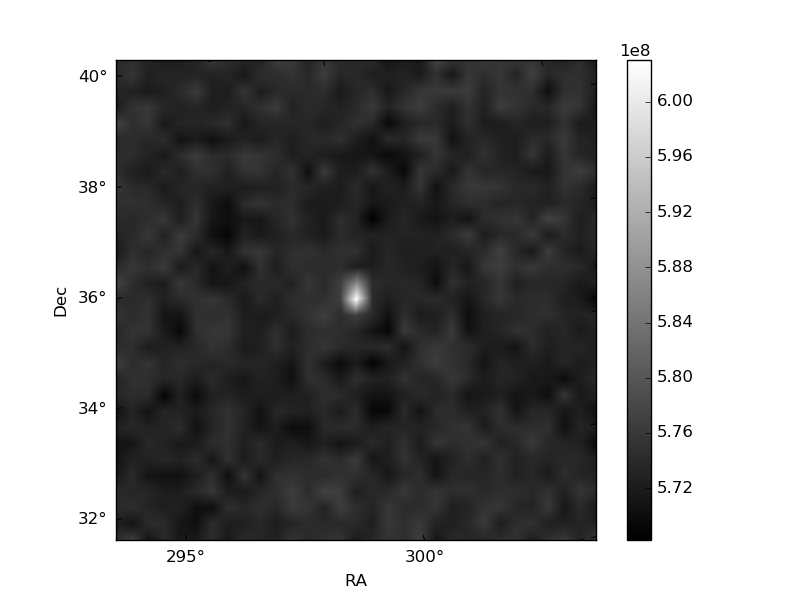
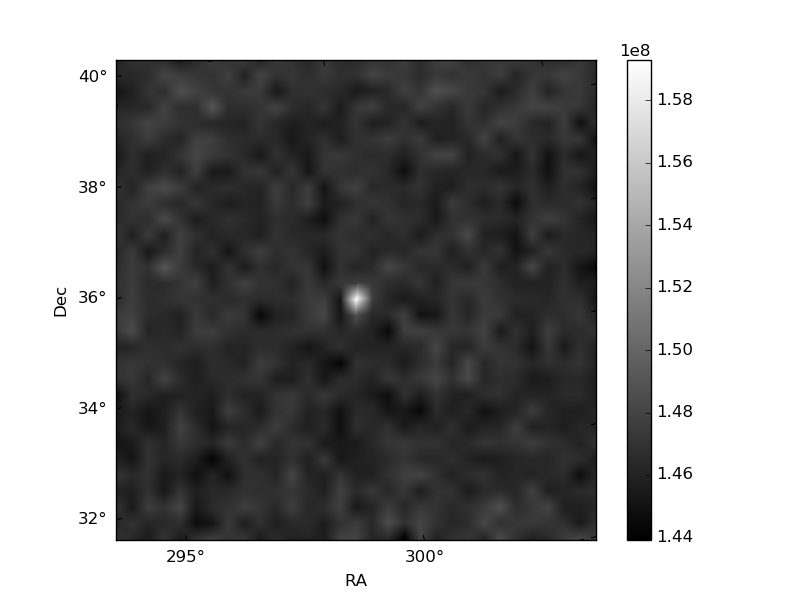
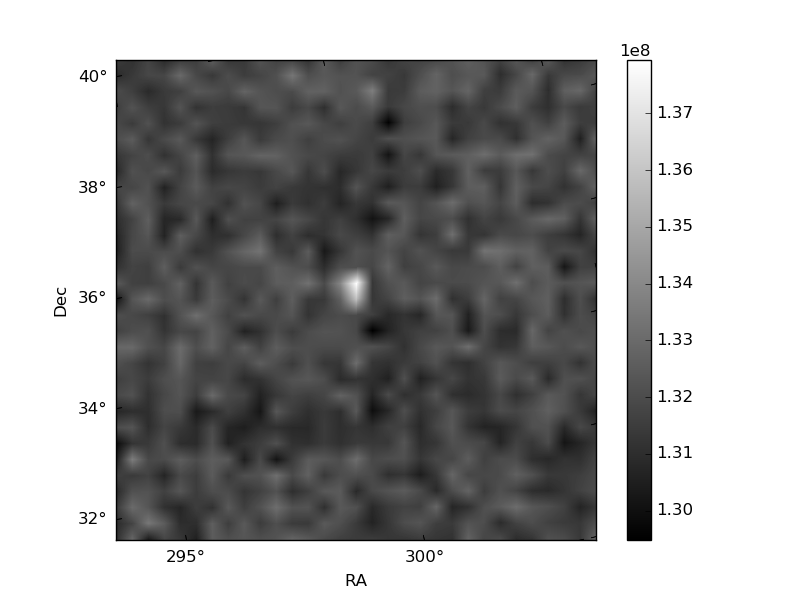
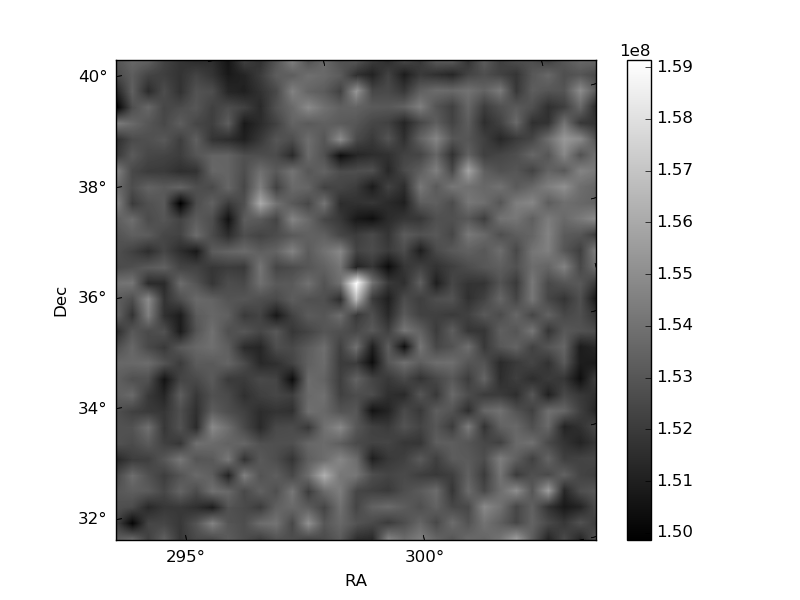
Histogram calculated using DETX and DETY for each event in the final _common_clean file
| Quadrant A | 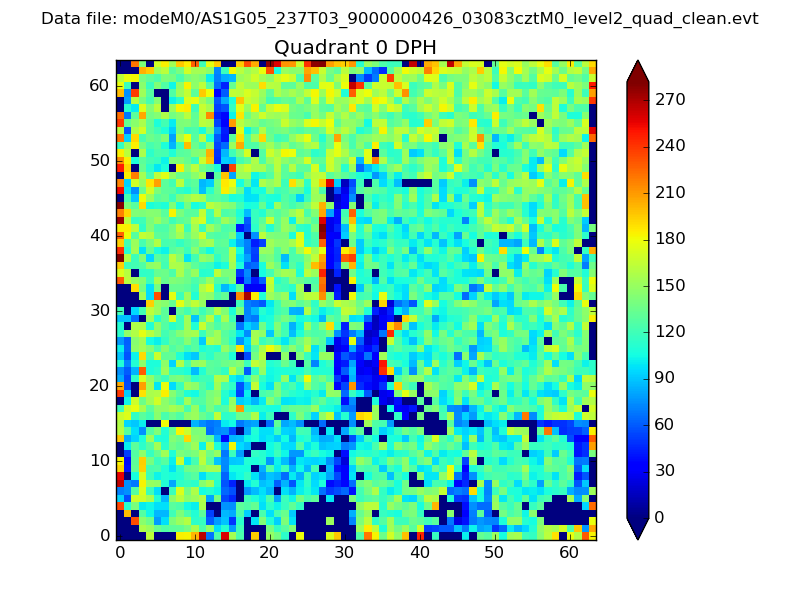 |
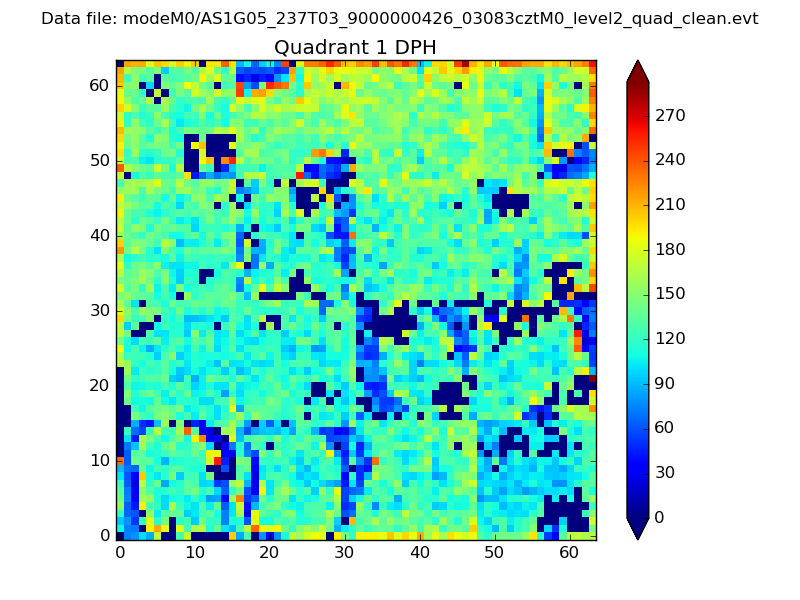 |
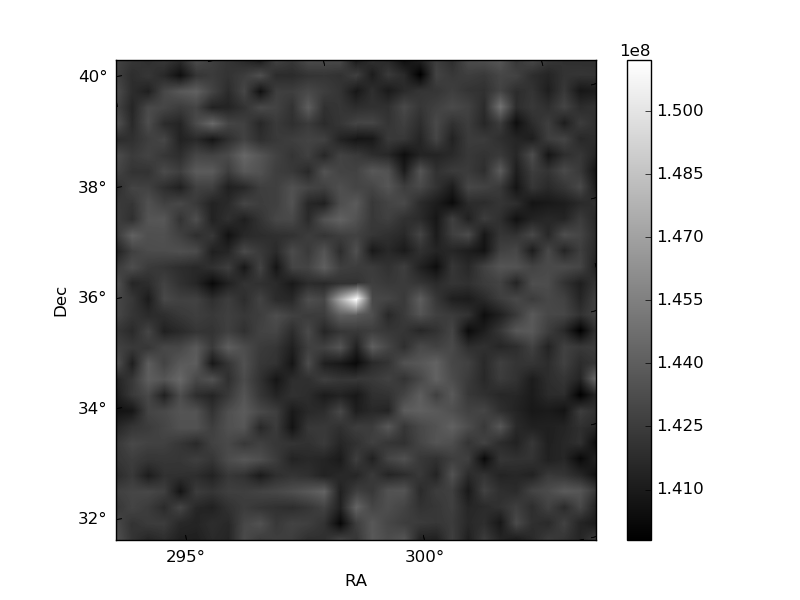
Quadrant B |
|---|---|---|---|
| Quadrant D | 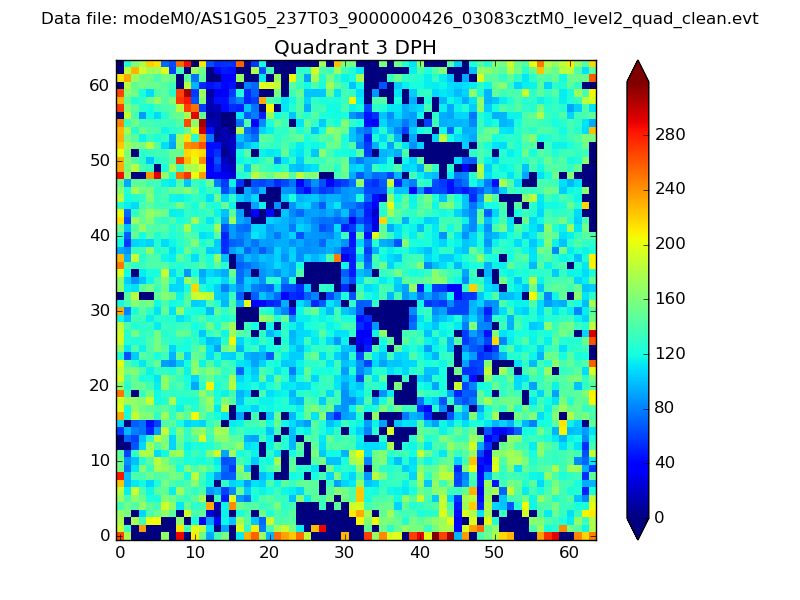 |
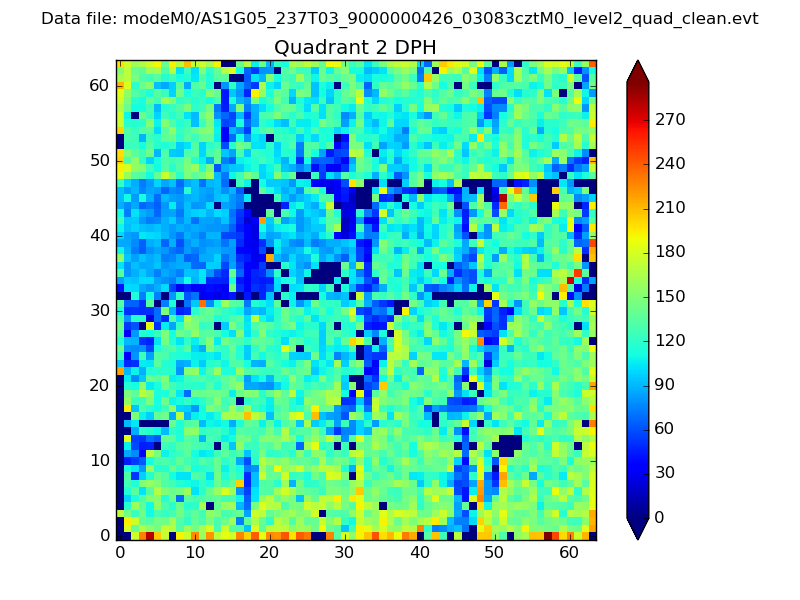 |
Quadrant C |
| Plot type | Count rate plots | Images |
|---|---|---|
| Comparison with Poisson distribution Blue bars denote a histogram of data divided into 1 sec bins. Red curve is a Poisson curve with rate = median count rate of data. |
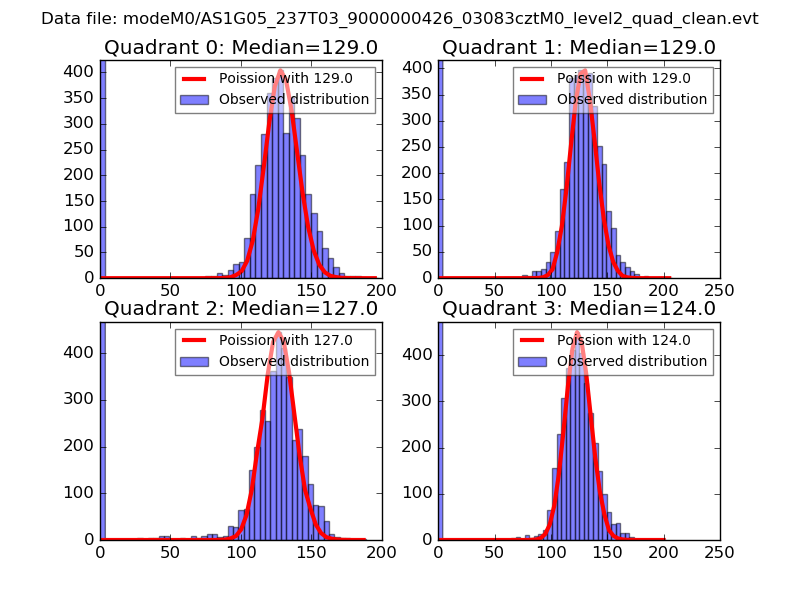 |
 |
| Quadrant-wise count rates Data is divided into 100 sec bins |
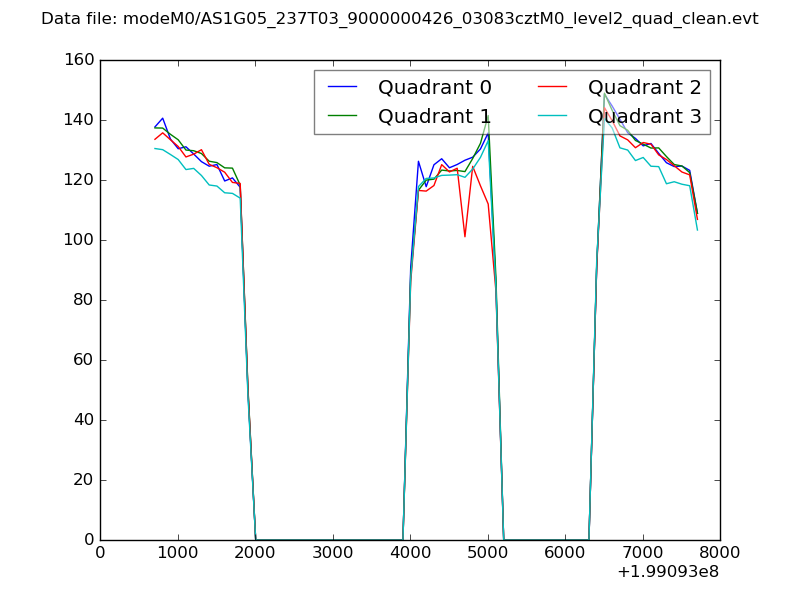 |
|
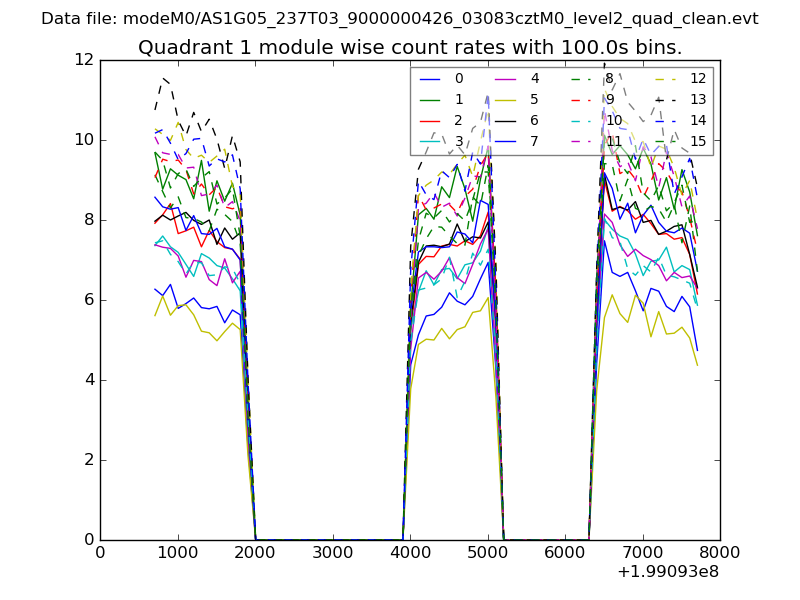
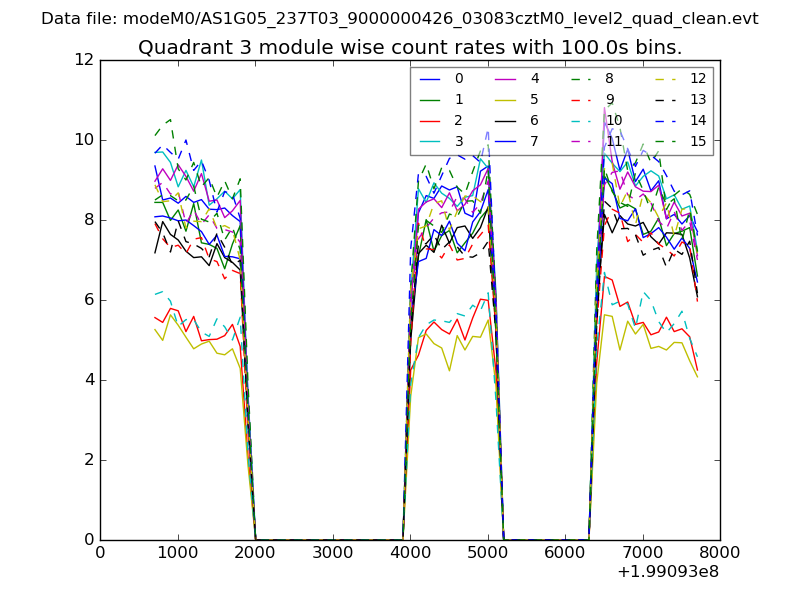
| Module-wise count rates for Quadrant A Data is divided into 100 sec bins |
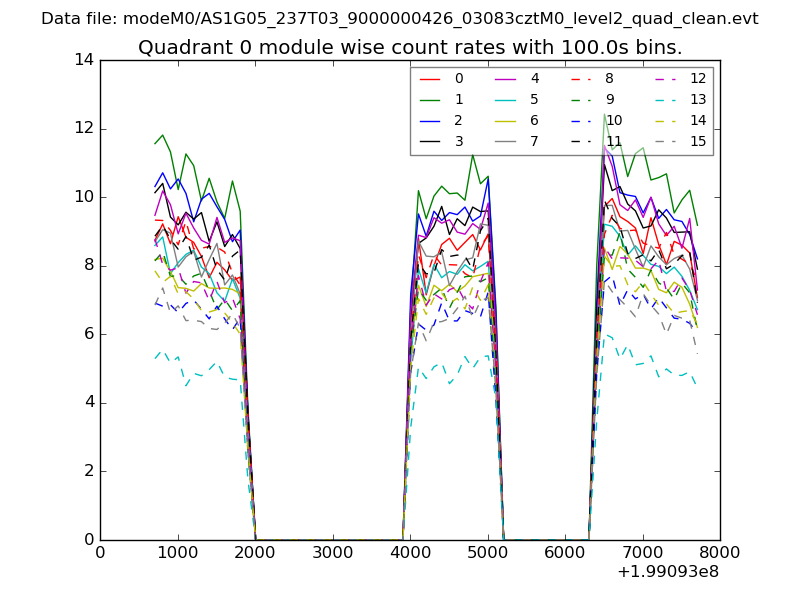 |
 |
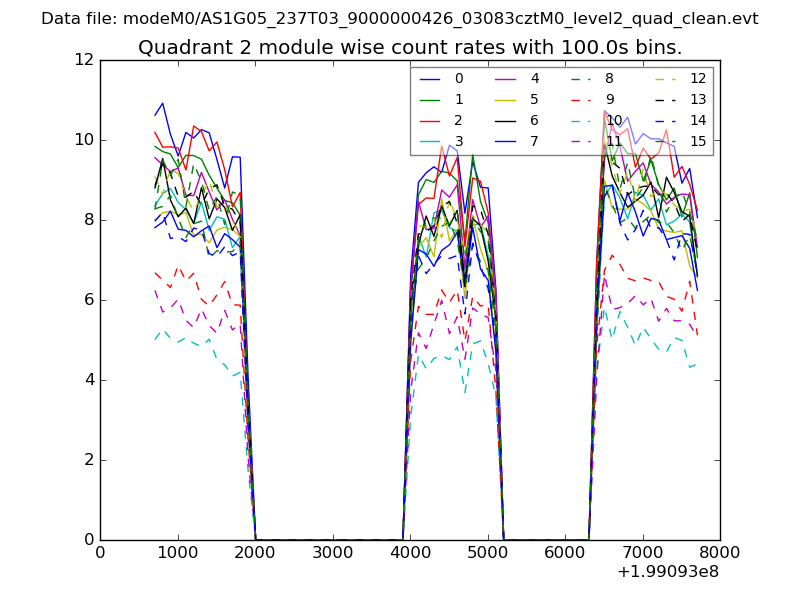
| Module-wise count rates for Quadrant B Data is divided into 100 sec bins |
 |
 |
| Module-wise count rates for Quadrant C Data is divided into 100 sec bins |
 |
 |
| Module-wise count rates for Quadrant D Data is divided into 100 sec bins |
 |
 |
| Parameter | Plot |
|---|---|
| CZT HV Monitor | 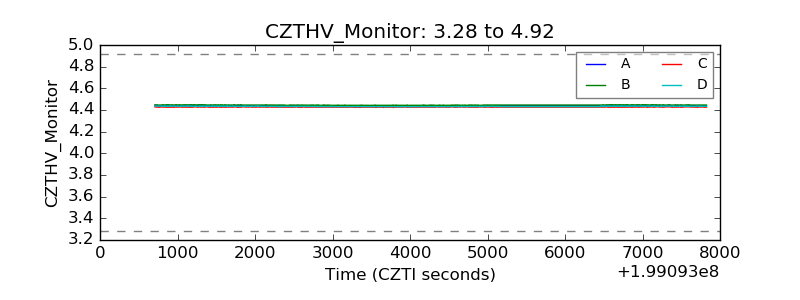 |
| D_VDD | 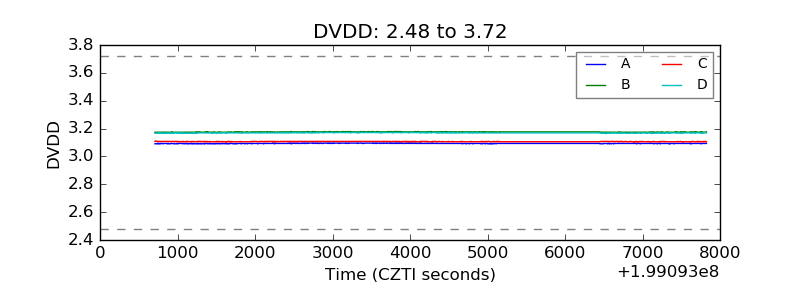 |
| Temperature 1 | 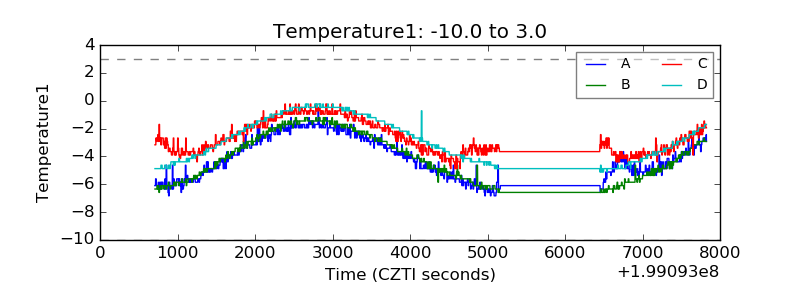 |
| Veto HV Monitor | 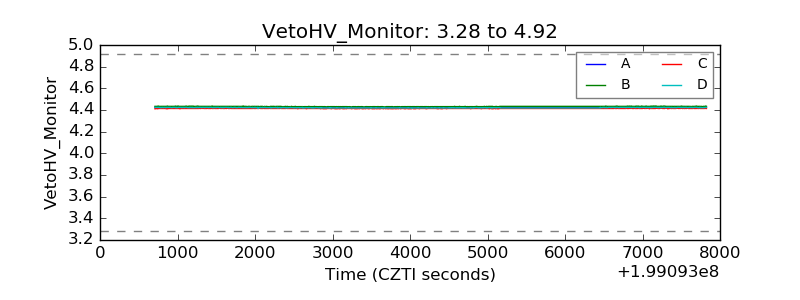 |
| Veto LLD | 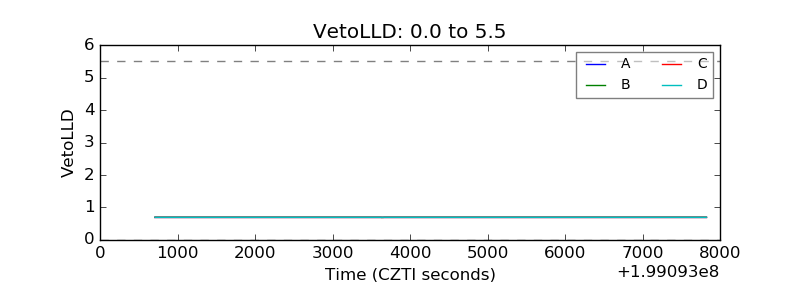 |
| Alpha Counter | 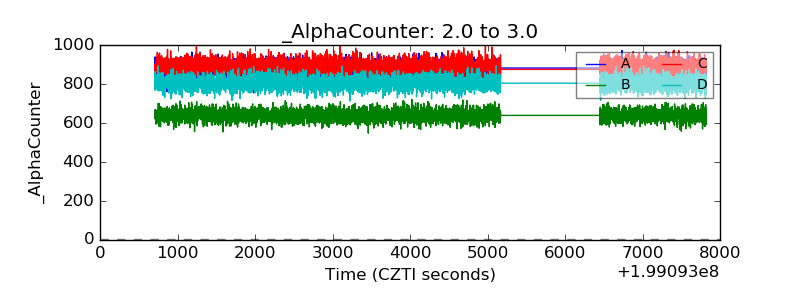 |
| _CPM_Rate | 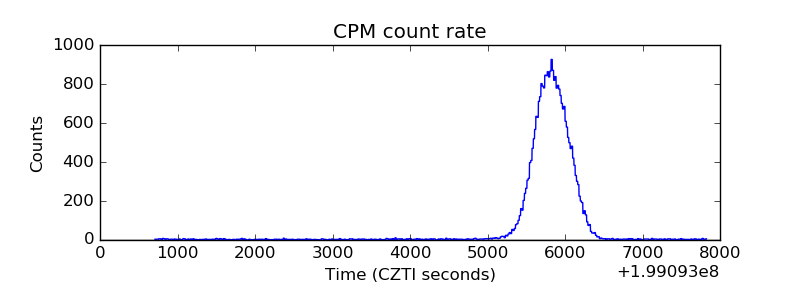 |
| CZT Counter | 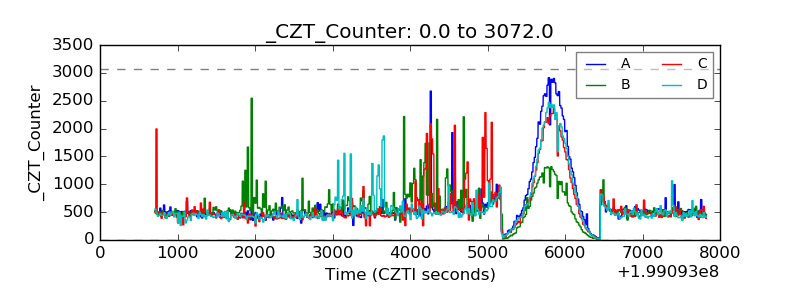 |
| +2.5 Volts monitor |  |
| +5 Volts monitor |  |
| _ROLL_ROT | 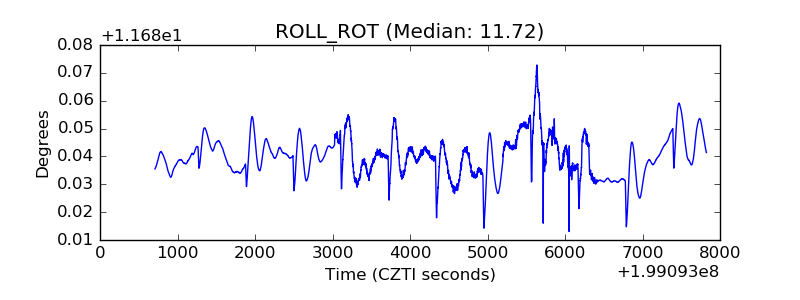 |
| _Roll_DEC | 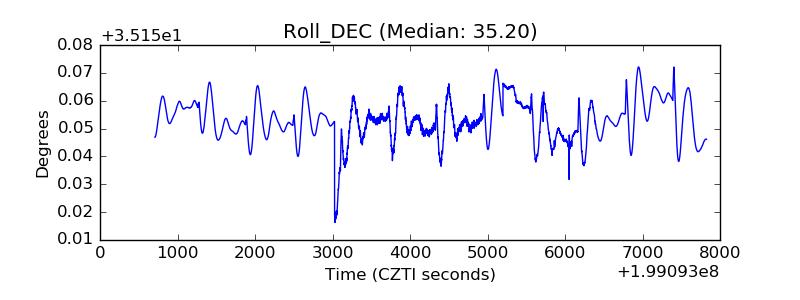 |
| _Roll_RA | 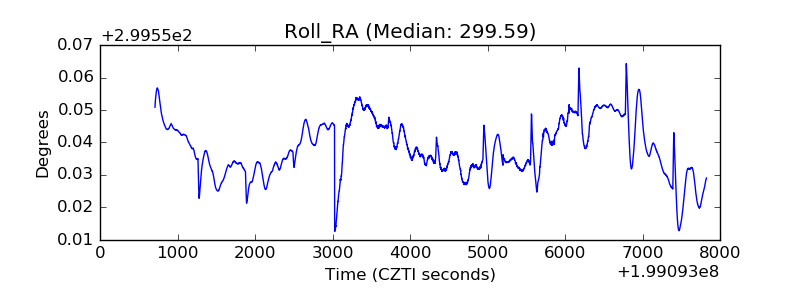 |
| Veto Counter | 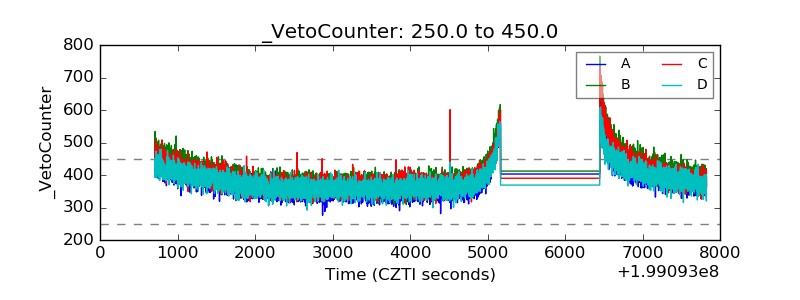 |