| Param | Original file | Final file |
|---|---|---|
| Filename | modeM0/AS1G05_237T03_9000000426_03084cztM0_level2.evt | modeM0/AS1G05_237T03_9000000426_03084cztM0_level2_quad_clean.evt |
| Size (bytes) | 470,327,040 | 72,993,600 |
| Size | 448.5 MB | 69.6 MB |
| Events in quadrant A | 3,318,695 | 448,230 |
| Events in quadrant B | 3,303,249 | 453,294 |
| Events in quadrant C | 3,957,870 | 445,691 |
| Events in quadrant D | 3,251,992 | 439,213 |
| Mode M9 | |||
|---|---|---|---|
| Quadrant | BADHDUFLAG | Total packets | Discarded packets |
| A | 0 | 11 | 0 |
| B | 0 | 11 | 0 |
| C | 0 | 11 | 0 |
| D | 0 | 11 | 0 |
| Mode M0 | |||
|---|---|---|---|
| Quadrant | BADHDUFLAG | Total packets | Discarded packets |
| A | 0 | 13560 | 2 |
| B | 0 | 13496 | 1 |
| C | 0 | 15780 | 1 |
| D | 0 | 13623 | 1 |
| Mode SS | |||
|---|---|---|---|
| Quadrant | BADHDUFLAG | Total packets | Discarded packets |
| A | 0 | 126 | 0 |
| B | 0 | 126 | 0 |
| C | 0 | 126 | 0 |
| D | 0 | 126 | 0 |
| Quadrant | Total seconds | Saturated seconds | Saturation percentage |
|---|---|---|---|
| A | 6059 | 173 | 2.855257% |
| B | 6059 | 115 | 1.898003% |
| C | 6059 | 308 | 5.083347% |
| D | 6059 | 77 | 1.270837% |
Noise dominated data is calculated using 1-second bins in cleaned event files. If a bin has >2000 counts, and if more than 50% of those come from <1% of pixels, then it is considered to be noise-dominated and hence unusable.
| Quadrant | # 1 sec bins | Bins with >0 counts | Bins with >2000 counts | High rate bins dominated by noise | Noise dominated (total time) | Noise dominated (detector-on time) | Marked lightcurve |
|---|---|---|---|---|---|---|---|
| A | 7239 | 6060 | 74 | 74 | 1.02% | 1.22% | 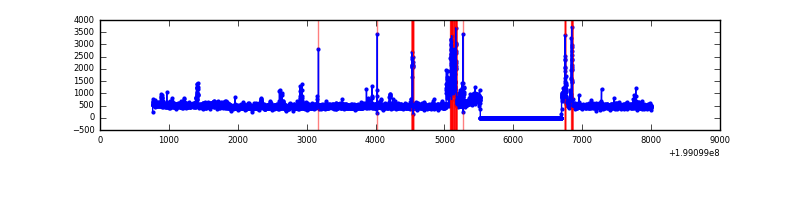 |
| B | 7239 | 6060 | 26 | 26 | 0.36% | 0.43% | 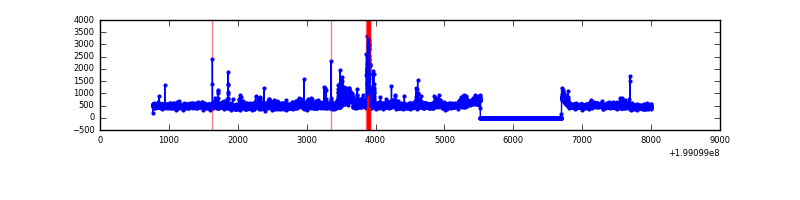 |
| C | 7239 | 6060 | 200 | 200 | 2.76% | 3.30% | 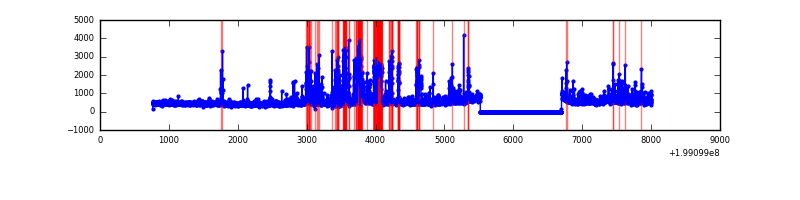 |
| D | 7239 | 6060 | 22 | 22 | 0.30% | 0.36% | 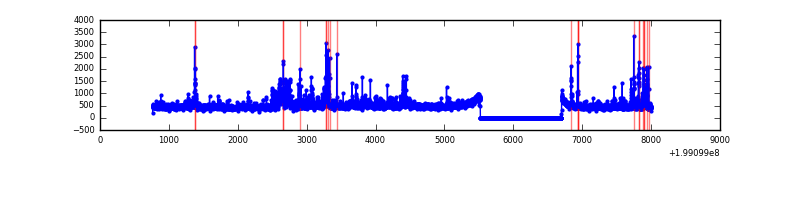 |
Top three noisy pixels from each quadrant. If the there are fewer than three noisy pixels in the level2.evt file, extra rows are filled as -1
| Pixel properties | Quadrant properties | ||||||
|---|---|---|---|---|---|---|---|
| Quadrant | DetID | PixID | Counts | Sigma | Mean | Median | Sigma |
| A | 0 | 50 | 247549 | 1689.0 | 727 | 714 | 146.1 |
| A | 12 | 247 | 110523 | 751.38 | 727 | 714 | 146.1 |
| A | 8 | 15 | 94356 | 640.76 | 727 | 714 | 146.1 |
| B | 0 | 230 | 209345 | 1483.73 | 731 | 715 | 140.6 |
| B | 15 | 204 | 79553 | 560.68 | 731 | 715 | 140.6 |
| B | 0 | 219 | 53560 | 375.82 | 731 | 715 | 140.6 |
| C | 0 | 219 | 428397 | 2688.25 | 689 | 696 | 159.1 |
| C | 14 | 223 | 328107 | 2057.89 | 689 | 696 | 159.1 |
| C | 15 | 208 | 292068 | 1831.38 | 689 | 696 | 159.1 |
| D | 10 | 213 | 215740 | 1183.48 | 699 | 684 | 181.7 |
| D | 10 | 199 | 70556 | 384.51 | 699 | 684 | 181.7 |
| D | 10 | 172 | 52089 | 282.89 | 699 | 684 | 181.7 |
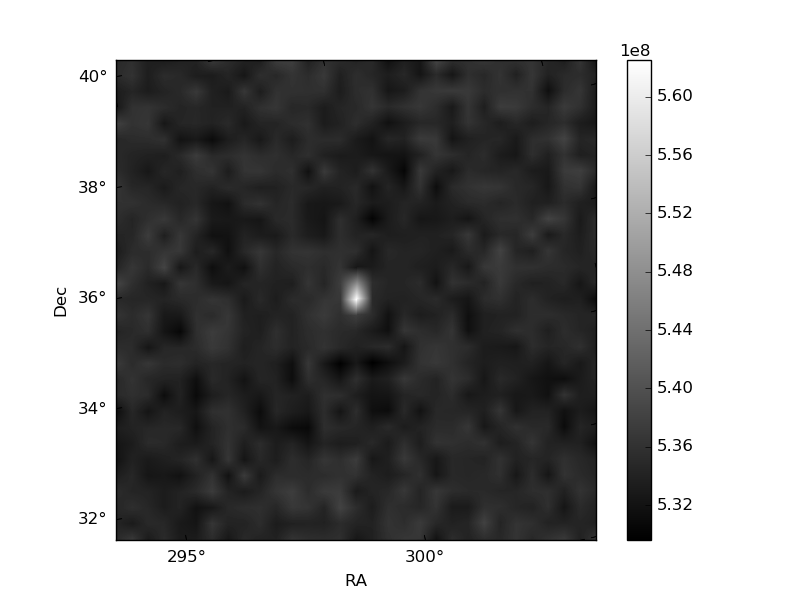
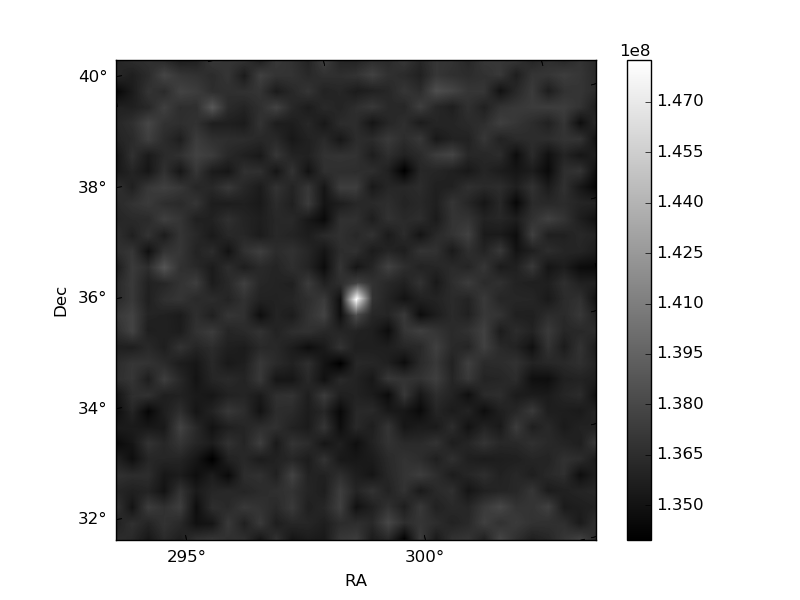
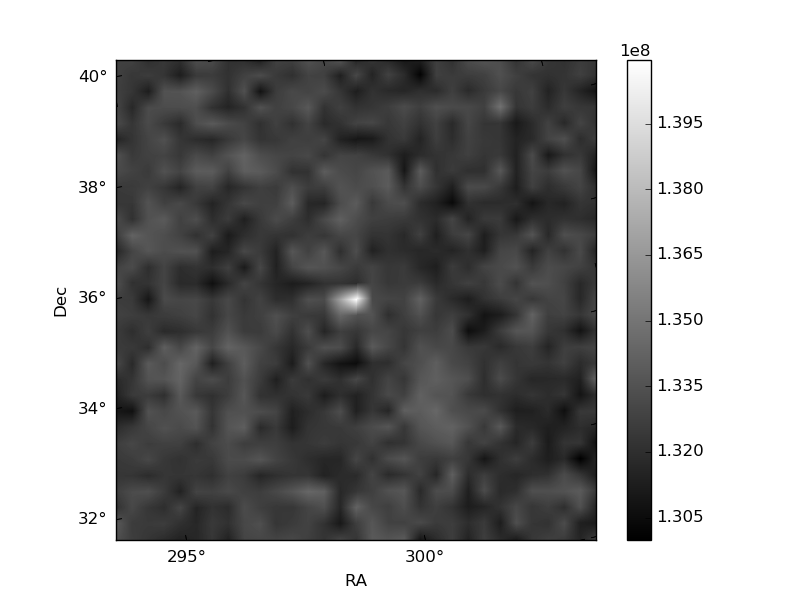
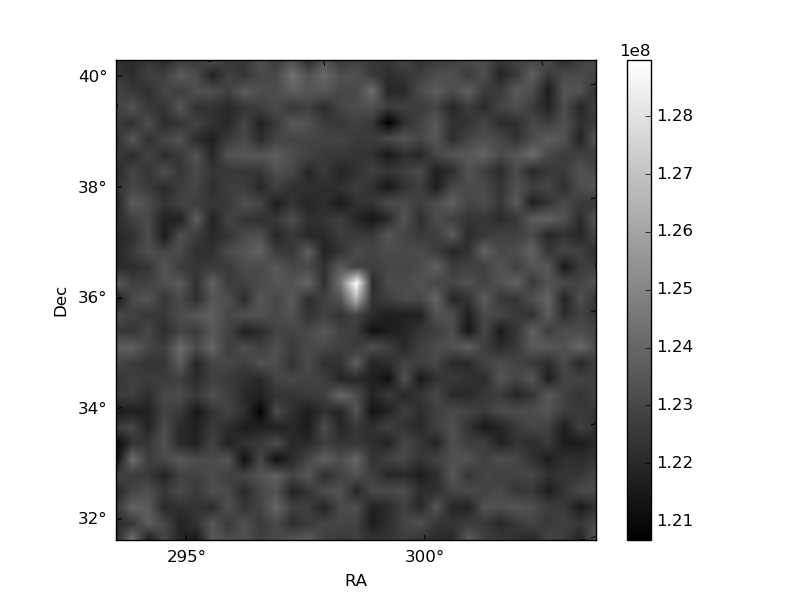
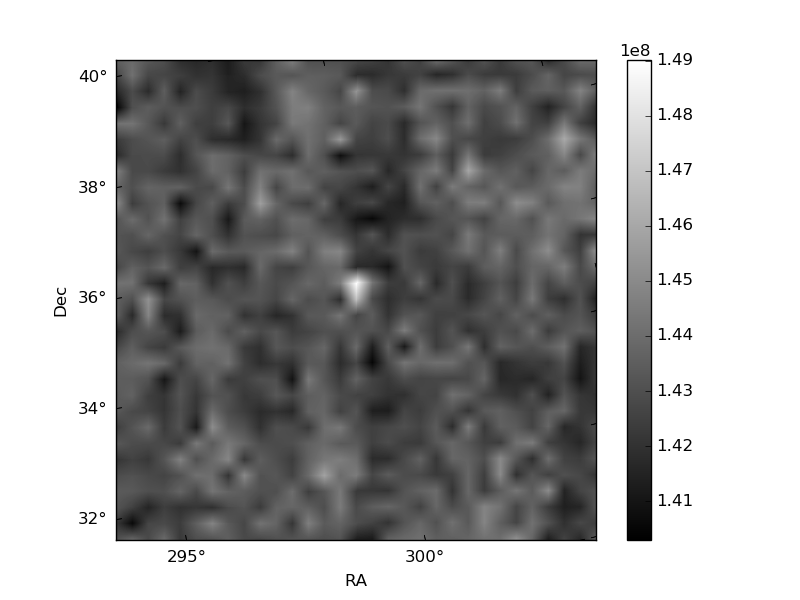
Histogram calculated using DETX and DETY for each event in the final _common_clean file
| Quadrant A | 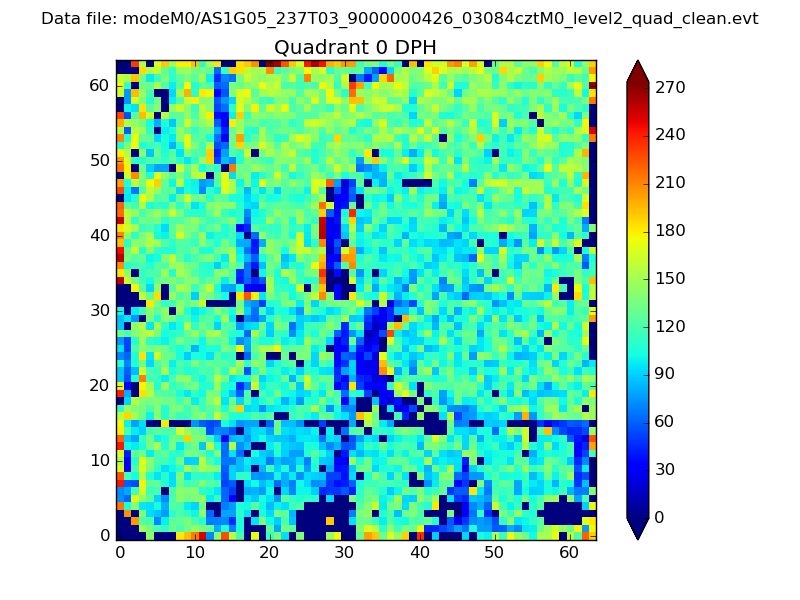 |
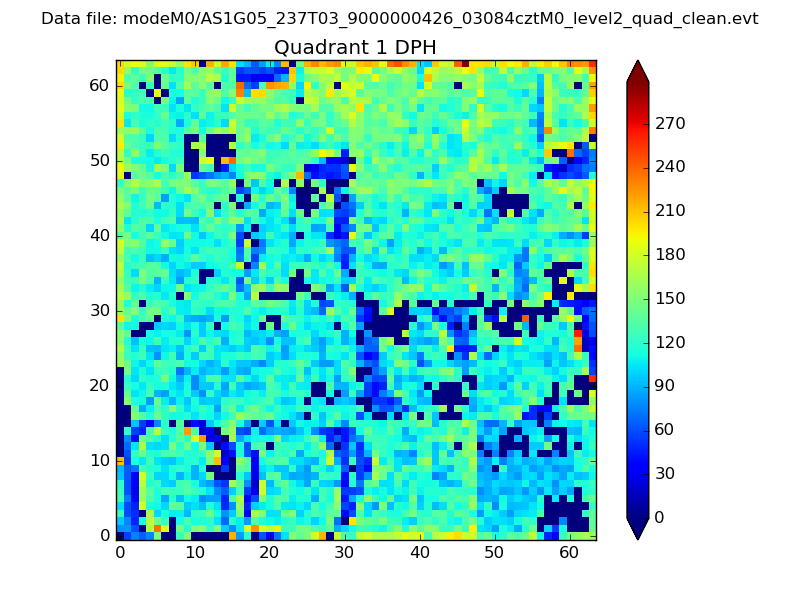 |
Quadrant B |
|---|---|---|---|
| Quadrant D | 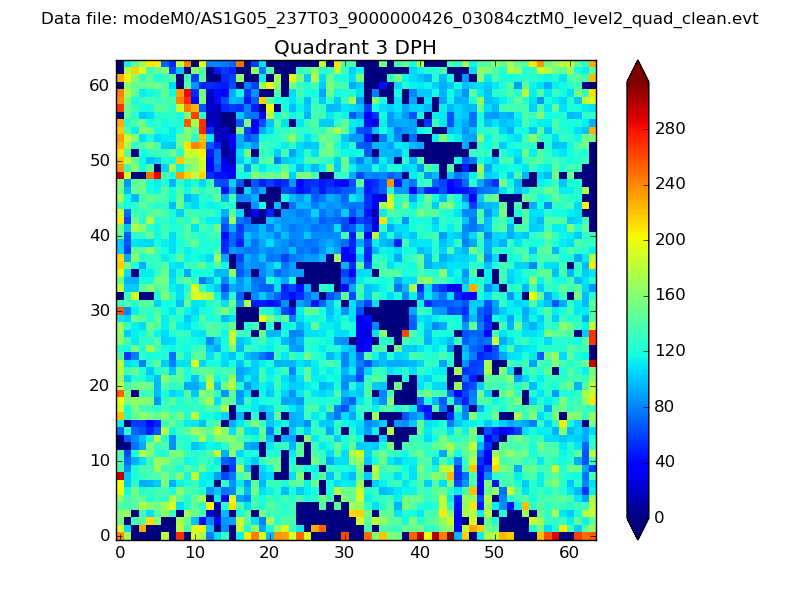 |
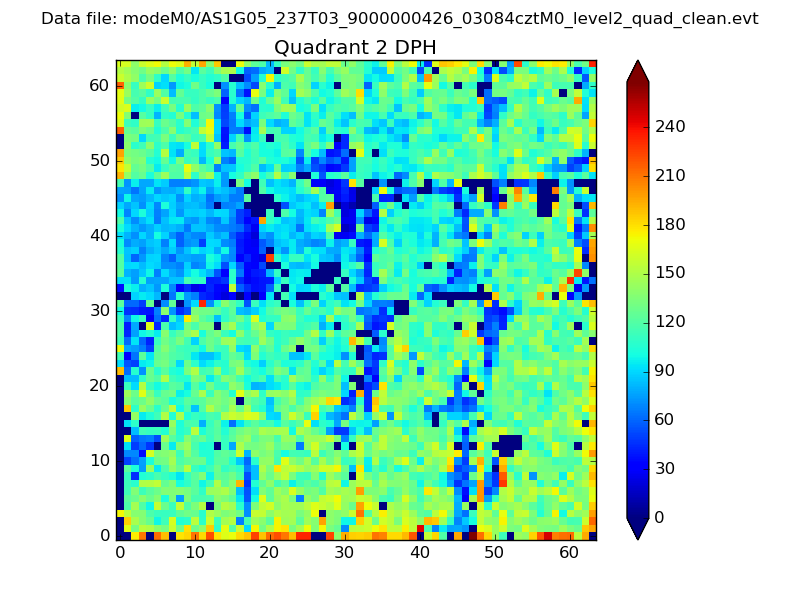 |
Quadrant C |
| Plot type | Count rate plots | Images |
|---|---|---|
| Comparison with Poisson distribution Blue bars denote a histogram of data divided into 1 sec bins. Red curve is a Poisson curve with rate = median count rate of data. |
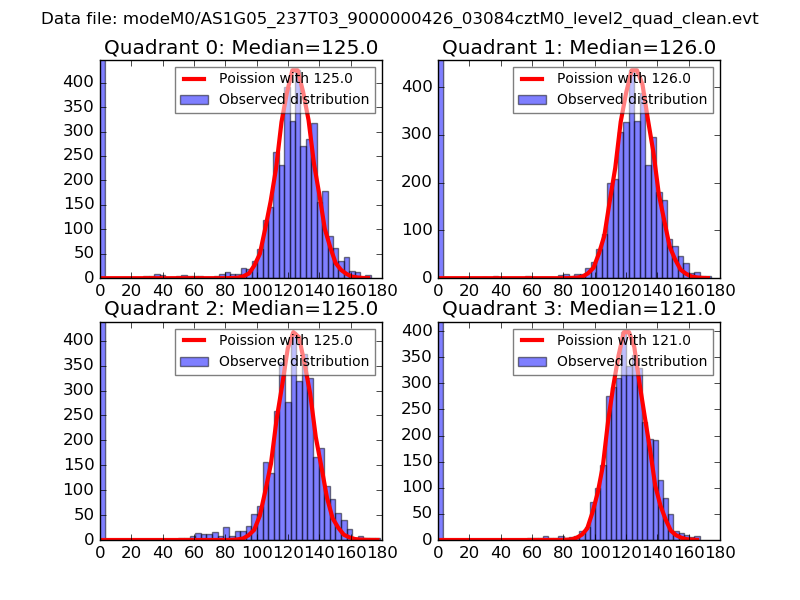 |
 |
| Quadrant-wise count rates Data is divided into 100 sec bins |
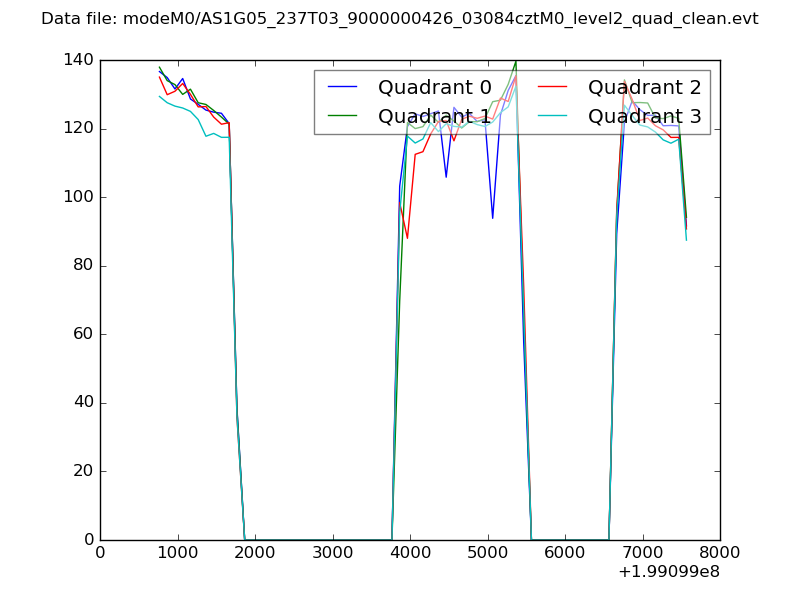 |
|
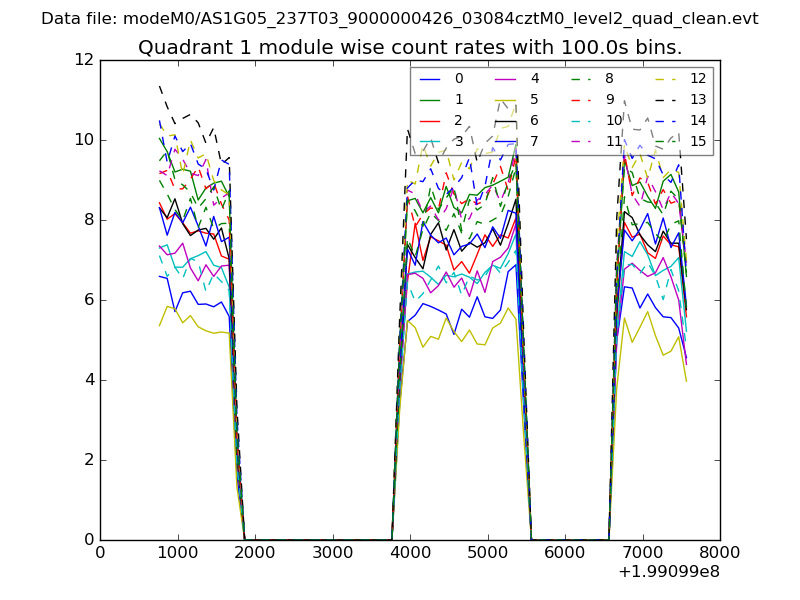
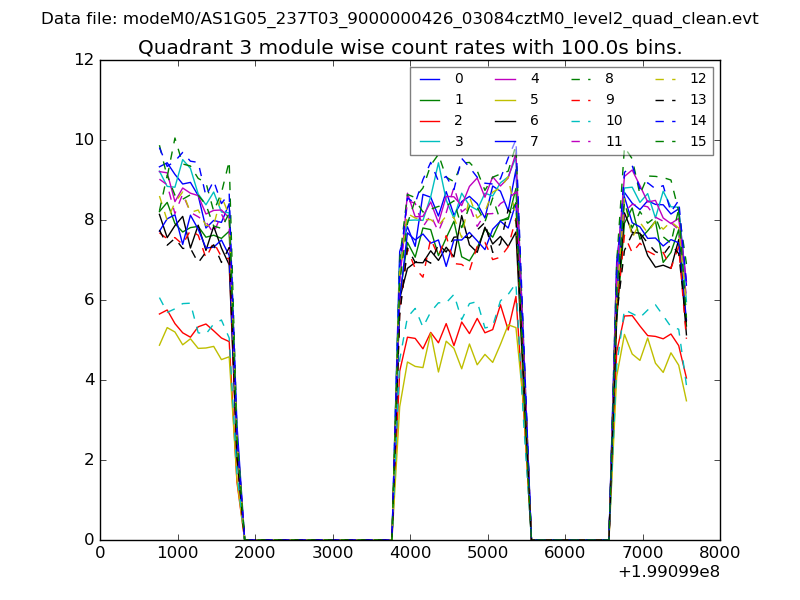
| Module-wise count rates for Quadrant A Data is divided into 100 sec bins |
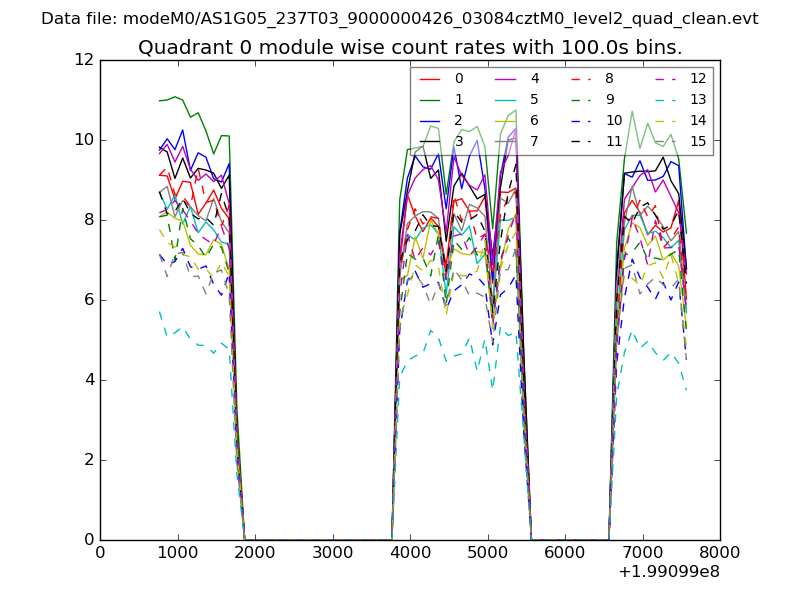 |
 |
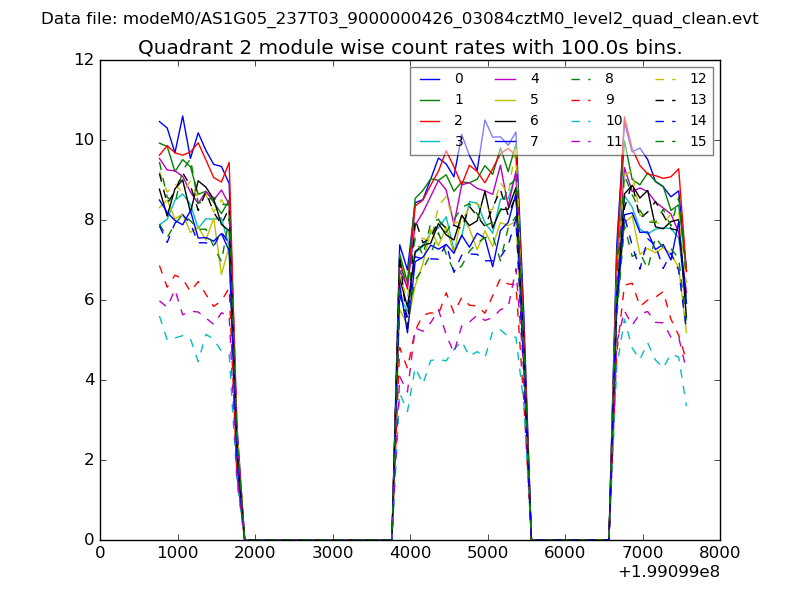
| Module-wise count rates for Quadrant B Data is divided into 100 sec bins |
 |
 |
| Module-wise count rates for Quadrant C Data is divided into 100 sec bins |
 |
 |
| Module-wise count rates for Quadrant D Data is divided into 100 sec bins |
 |
 |
| Parameter | Plot |
|---|---|
| CZT HV Monitor | 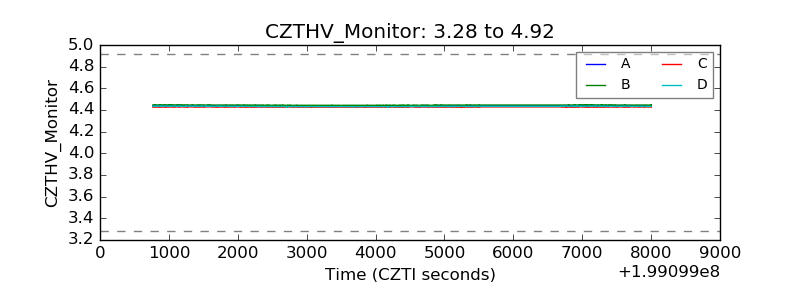 |
| D_VDD | 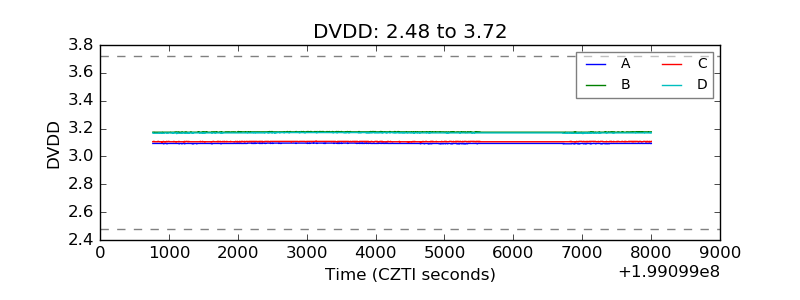 |
| Temperature 1 | 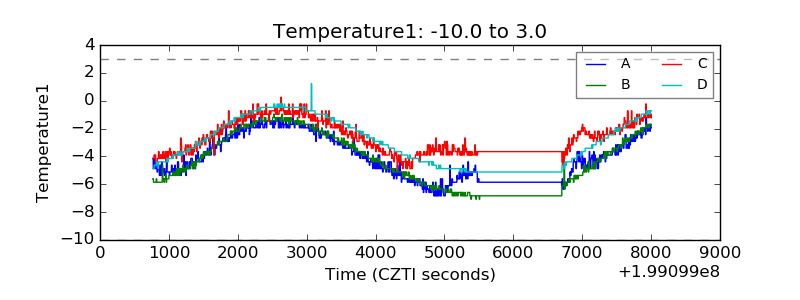 |
| Veto HV Monitor | 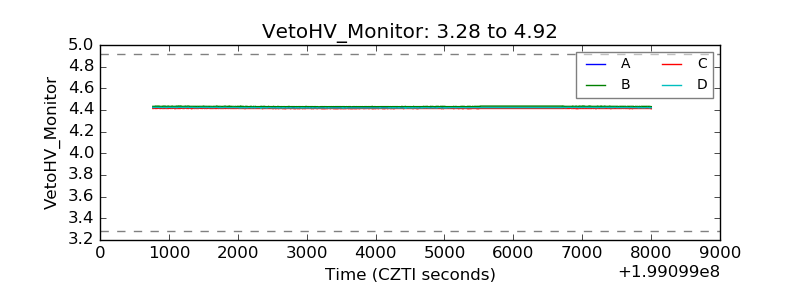 |
| Veto LLD | 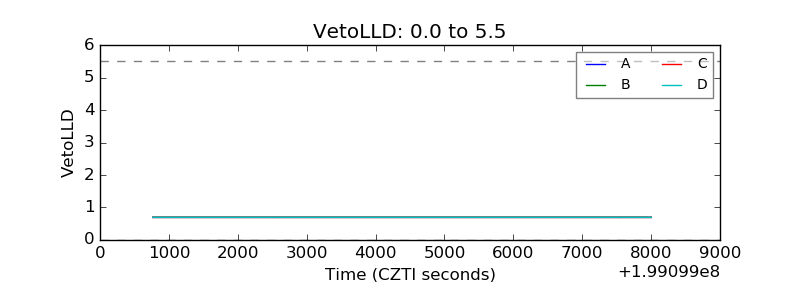 |
| Alpha Counter | 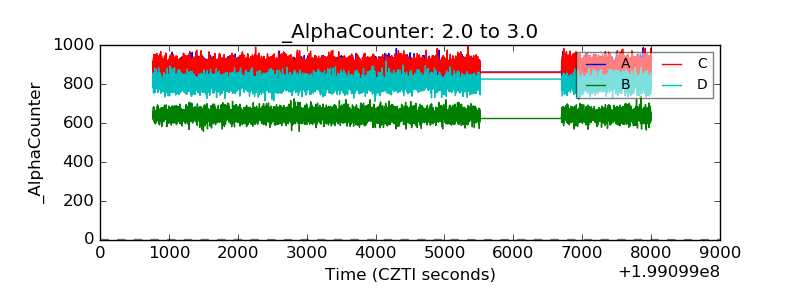 |
| _CPM_Rate | 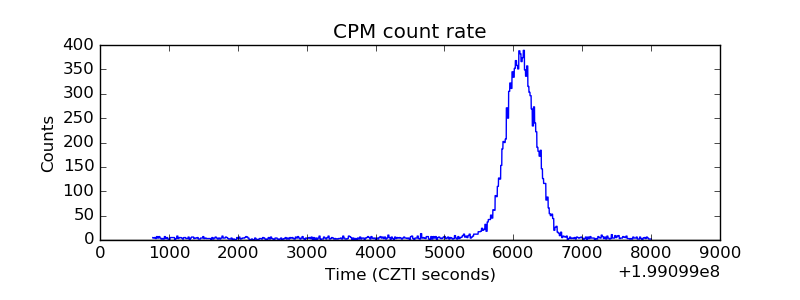 |
| CZT Counter | 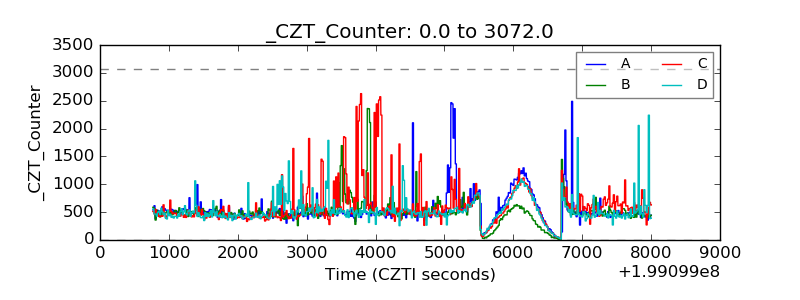 |
| +2.5 Volts monitor | 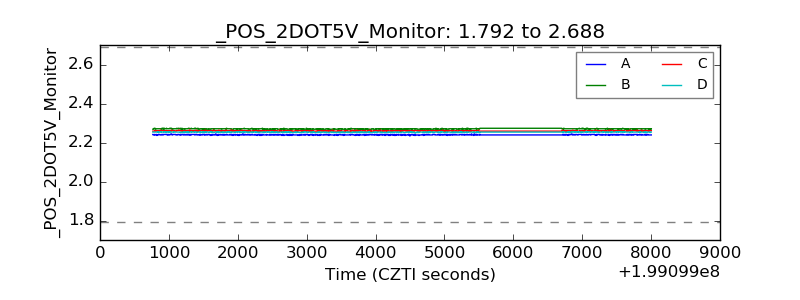 |
| +5 Volts monitor | 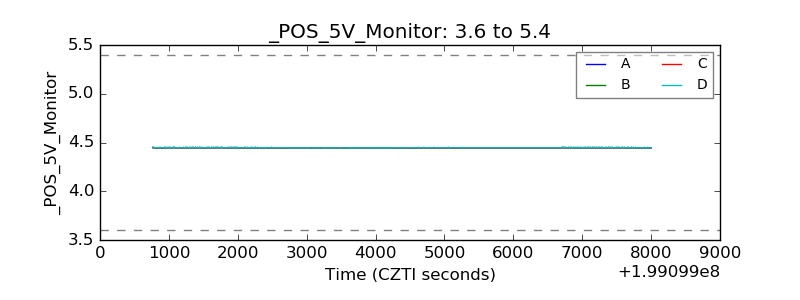 |
| _ROLL_ROT | 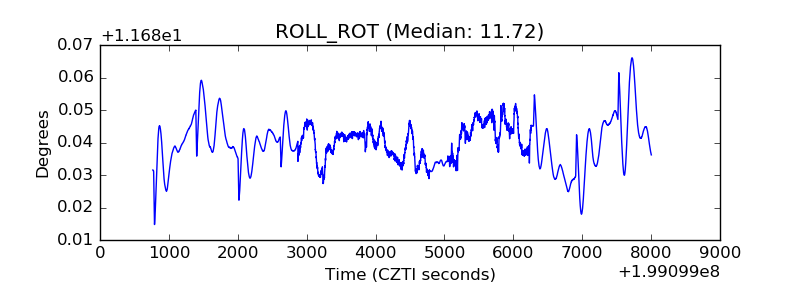 |
| _Roll_DEC | 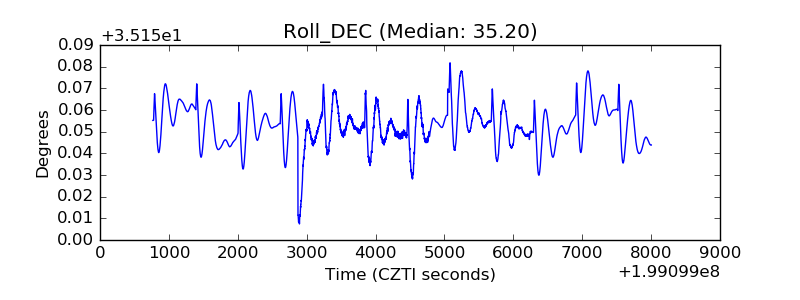 |
| _Roll_RA | 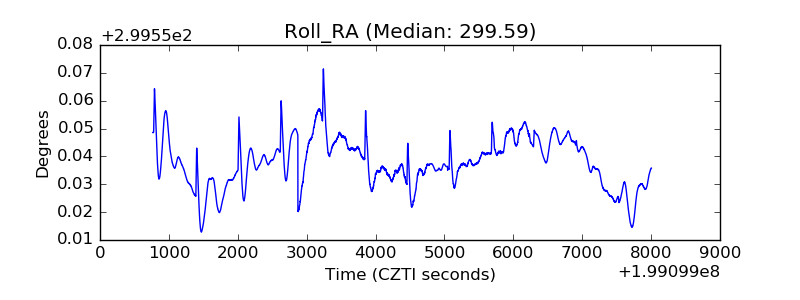 |
| Veto Counter | 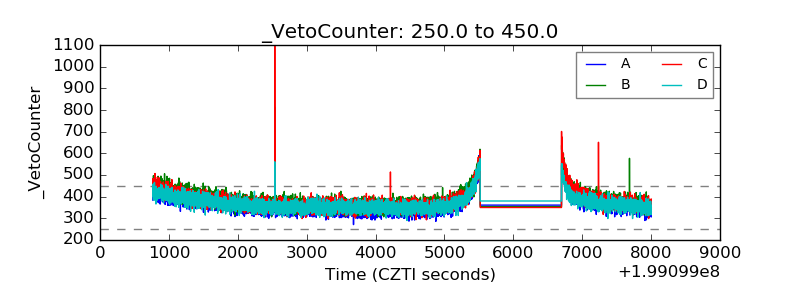 |