| Param | Original file | Final file |
|---|---|---|
| Filename | modeM0/AS1G05_237T03_9000000426_03087cztM0_level2.evt | modeM0/AS1G05_237T03_9000000426_03087cztM0_level2_quad_clean.evt |
| Size (bytes) | 601,922,880 | 76,985,280 |
| Size | 574.0 MB | 73.4 MB |
| Events in quadrant A | 3,818,246 | 458,034 |
| Events in quadrant B | 4,279,365 | 455,676 |
| Events in quadrant C | 4,969,938 | 440,774 |
| Events in quadrant D | 4,640,435 | 441,636 |
| Mode M9 | |||
|---|---|---|---|
| Quadrant | BADHDUFLAG | Total packets | Discarded packets |
| A | 0 | 2 | 0 |
| B | 0 | 2 | 0 |
| C | 0 | 2 | 0 |
| D | 0 | 3 | 0 |
| Mode M0 | |||
|---|---|---|---|
| Quadrant | BADHDUFLAG | Total packets | Discarded packets |
| A | 0 | 16512 | 3 |
| B | 0 | 17756 | 2 |
| C | 0 | 19939 | 2 |
| D | 0 | 19294 | 2 |
| Mode SS | |||
|---|---|---|---|
| Quadrant | BADHDUFLAG | Total packets | Discarded packets |
| A | 0 | 156 | 0 |
| B | 0 | 156 | 0 |
| C | 0 | 156 | 0 |
| D | 0 | 156 | 0 |
| Quadrant | Total seconds | Saturated seconds | Saturation percentage |
|---|---|---|---|
| A | 7688 | 147 | 1.912071% |
| B | 7688 | 178 | 2.315297% |
| C | 7688 | 403 | 5.241935% |
| D | 7688 | 298 | 3.876171% |
Noise dominated data is calculated using 1-second bins in cleaned event files. If a bin has >2000 counts, and if more than 50% of those come from <1% of pixels, then it is considered to be noise-dominated and hence unusable.
| Quadrant | # 1 sec bins | Bins with >0 counts | Bins with >2000 counts | High rate bins dominated by noise | Noise dominated (total time) | Noise dominated (detector-on time) | Marked lightcurve |
|---|---|---|---|---|---|---|---|
| A | 7793 | 7689 | 15 | 15 | 0.19% | 0.20% | 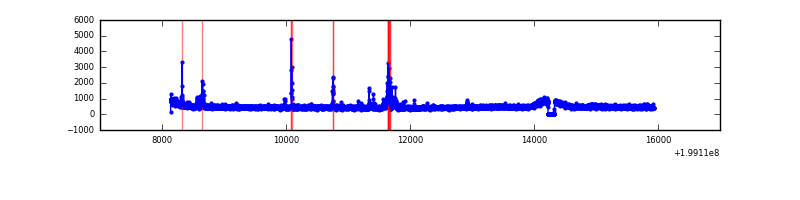 |
| B | 7793 | 7689 | 26 | 26 | 0.33% | 0.34% | 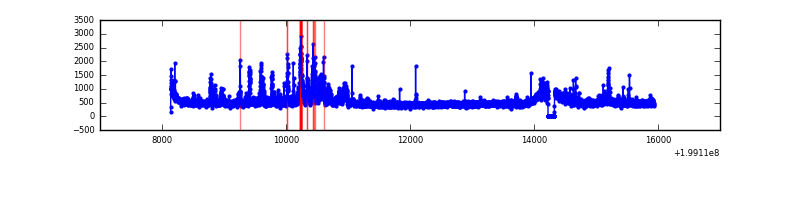 |
| C | 7793 | 7689 | 235 | 235 | 3.02% | 3.06% | 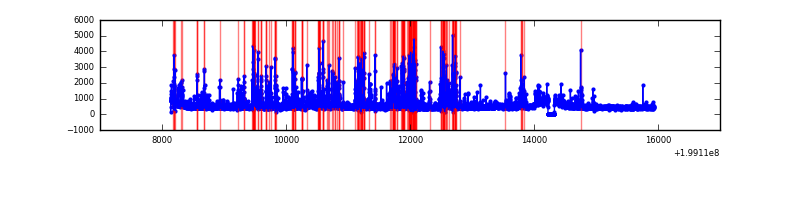 |
| D | 7793 | 7689 | 152 | 152 | 1.95% | 1.98% | 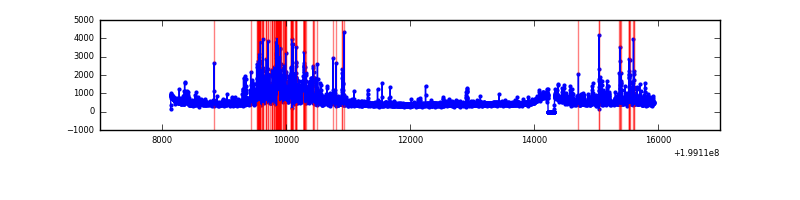 |
Top three noisy pixels from each quadrant. If the there are fewer than three noisy pixels in the level2.evt file, extra rows are filled as -1
| Pixel properties | Quadrant properties | ||||||
|---|---|---|---|---|---|---|---|
| Quadrant | DetID | PixID | Counts | Sigma | Mean | Median | Sigma |
| A | 12 | 247 | 203003 | 1078.13 | 911 | 891 | 187.5 |
| A | 8 | 15 | 35315 | 183.63 | 911 | 891 | 187.5 |
| A | 13 | 251 | 21885 | 111.99 | 911 | 891 | 187.5 |
| B | 7 | 252 | 246475 | 1377.08 | 920 | 898 | 178.3 |
| B | 3 | 0 | 126833 | 706.18 | 920 | 898 | 178.3 |
| B | 0 | 230 | 98893 | 549.51 | 920 | 898 | 178.3 |
| C | 14 | 223 | 591893 | 2892.47 | 866 | 872 | 204.3 |
| C | 5 | 250 | 472937 | 2310.3 | 866 | 872 | 204.3 |
| C | 1 | 16 | 138190 | 672.04 | 866 | 872 | 204.3 |
| D | 10 | 85 | 422655 | 1998.65 | 871 | 844 | 211.0 |
| D | 2 | 136 | 262339 | 1239.03 | 871 | 844 | 211.0 |
| D | 10 | 172 | 190300 | 897.69 | 871 | 844 | 211.0 |
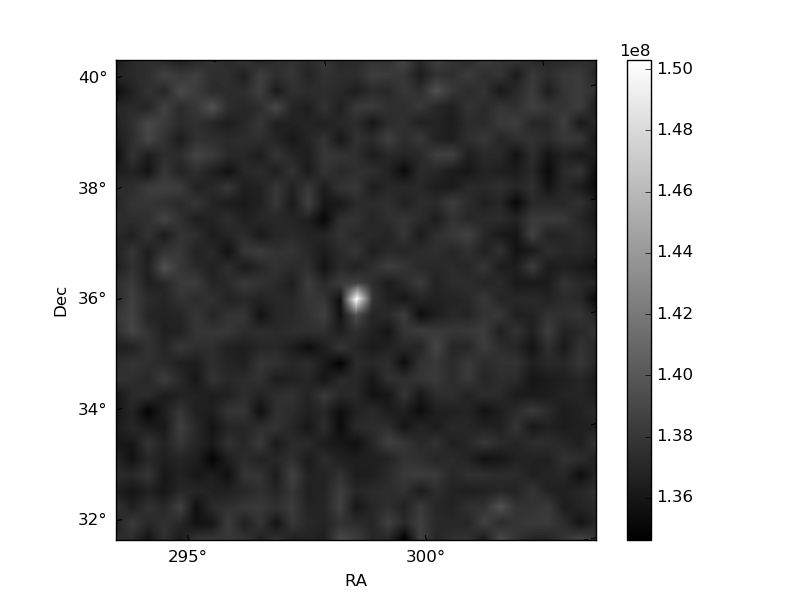
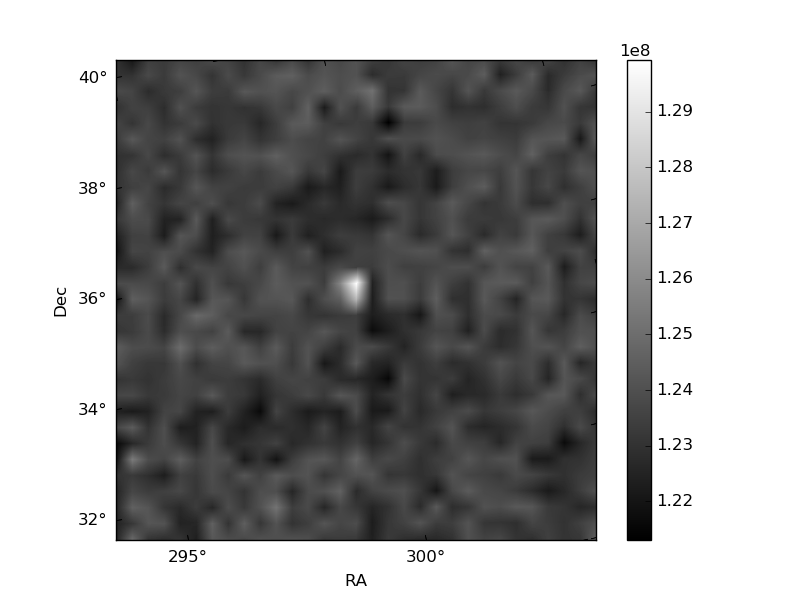
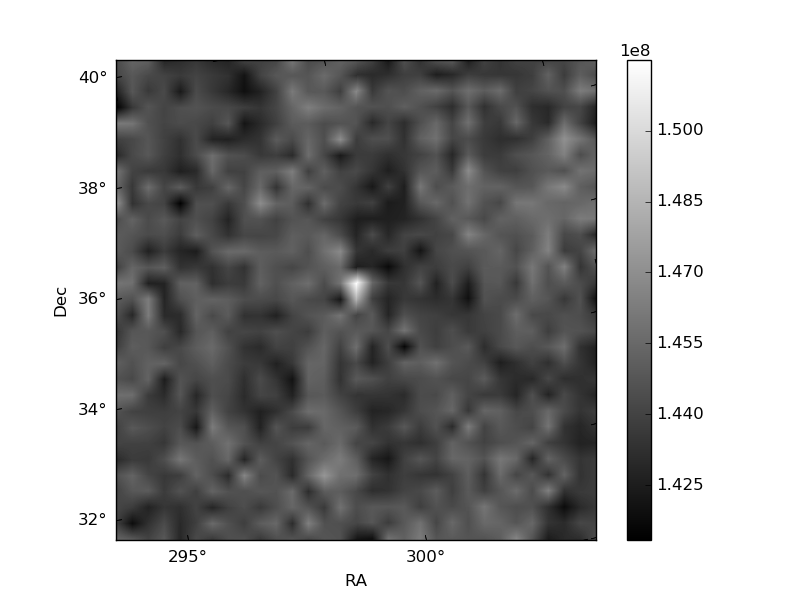
Histogram calculated using DETX and DETY for each event in the final _common_clean file
| Quadrant A | 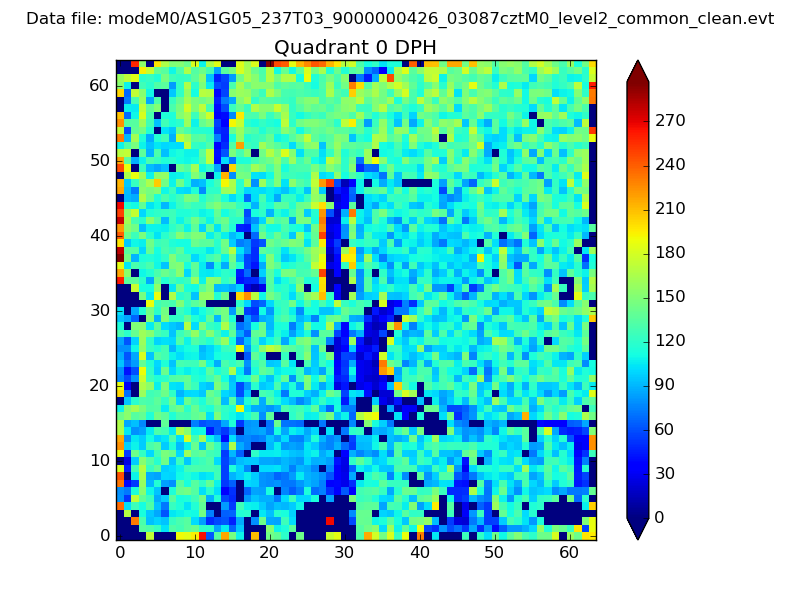 |
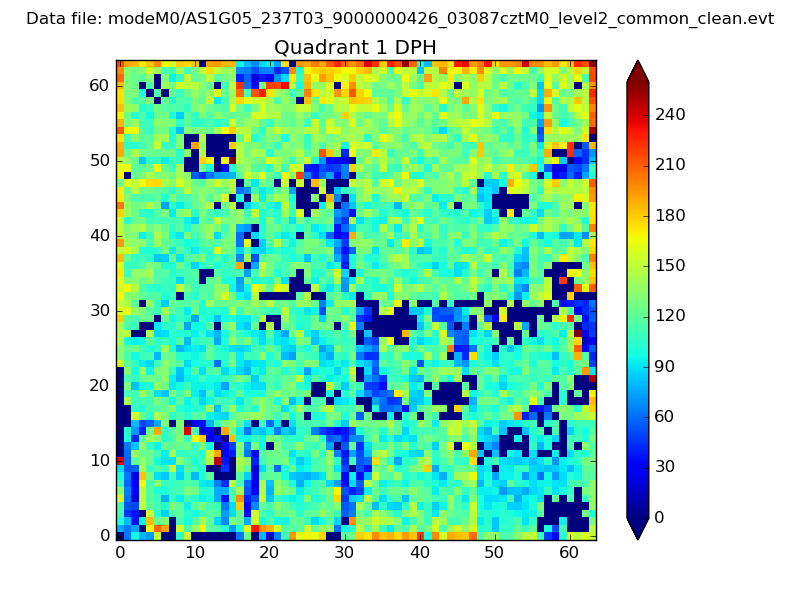 |
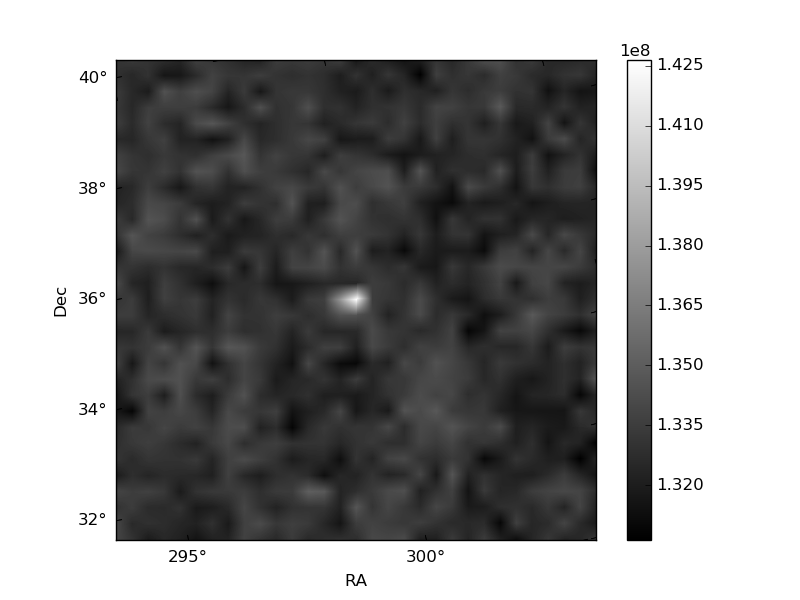
Quadrant B |
|---|---|---|---|
| Quadrant D | 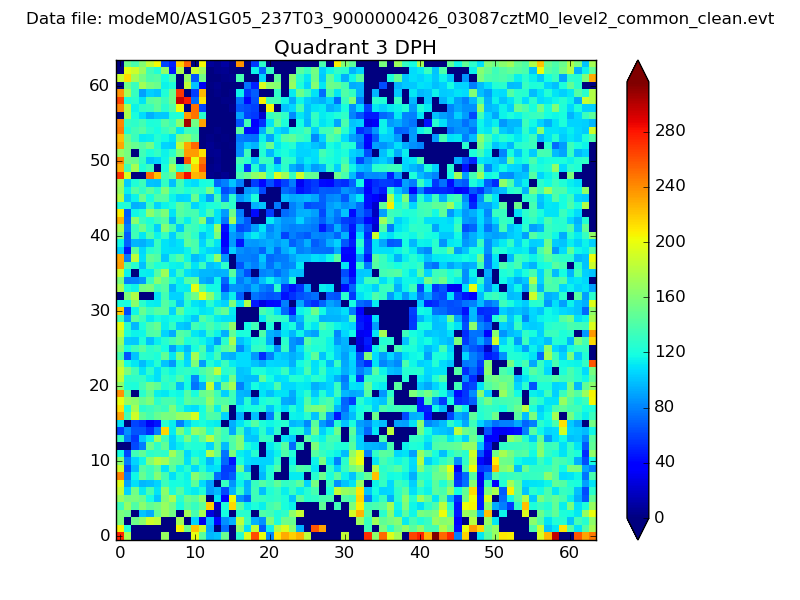 |
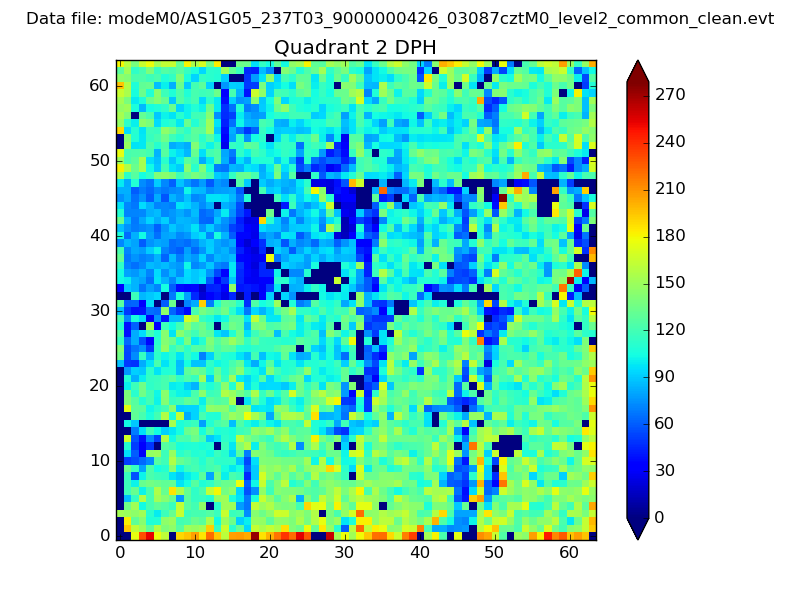 |
Quadrant C |
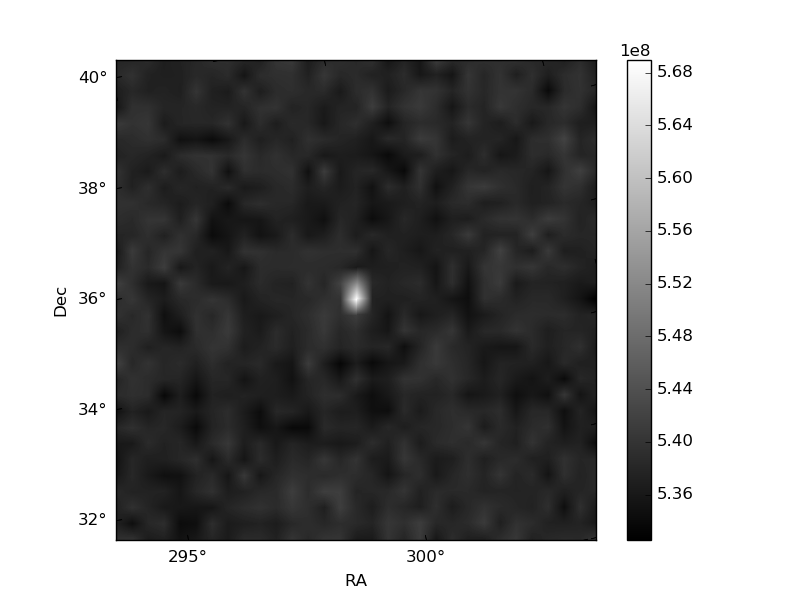
| Plot type | Count rate plots | Images |
|---|---|---|
| Comparison with Poisson distribution Blue bars denote a histogram of data divided into 1 sec bins. Red curve is a Poisson curve with rate = median count rate of data. |
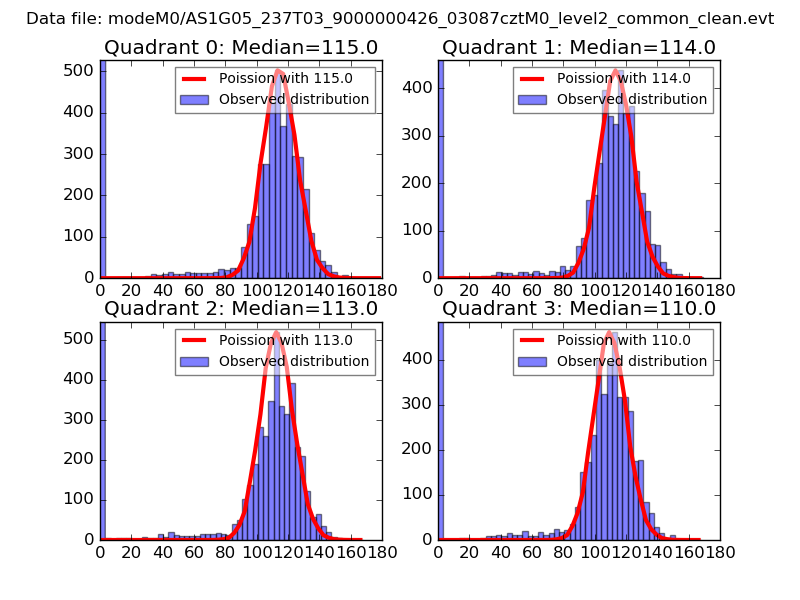 |
 |
| Quadrant-wise count rates Data is divided into 100 sec bins |
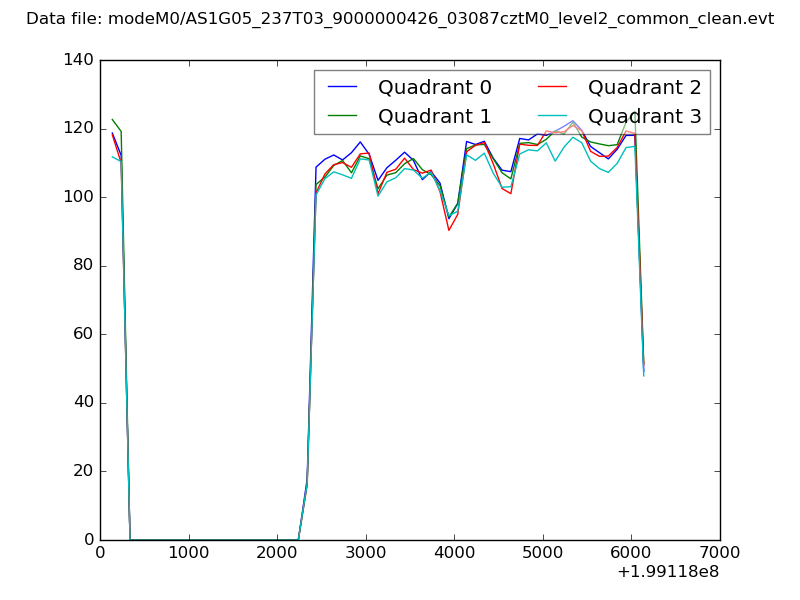 |
|
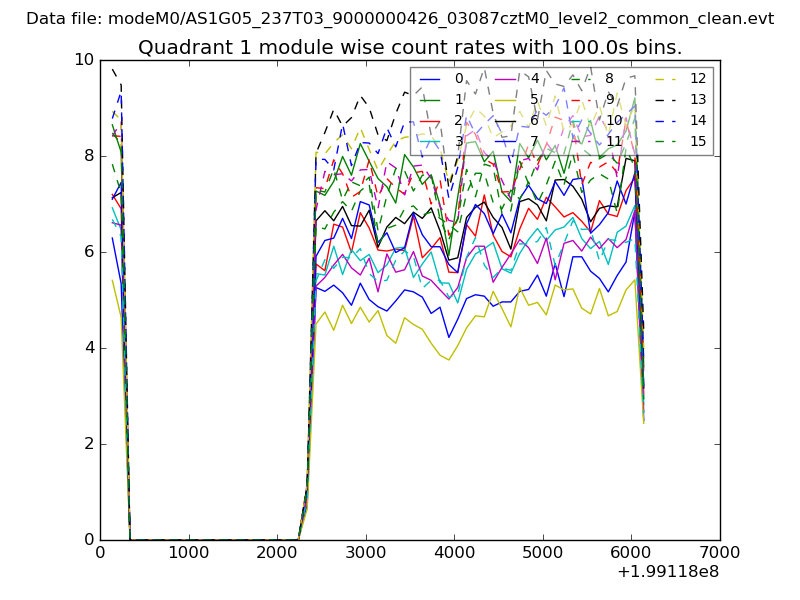
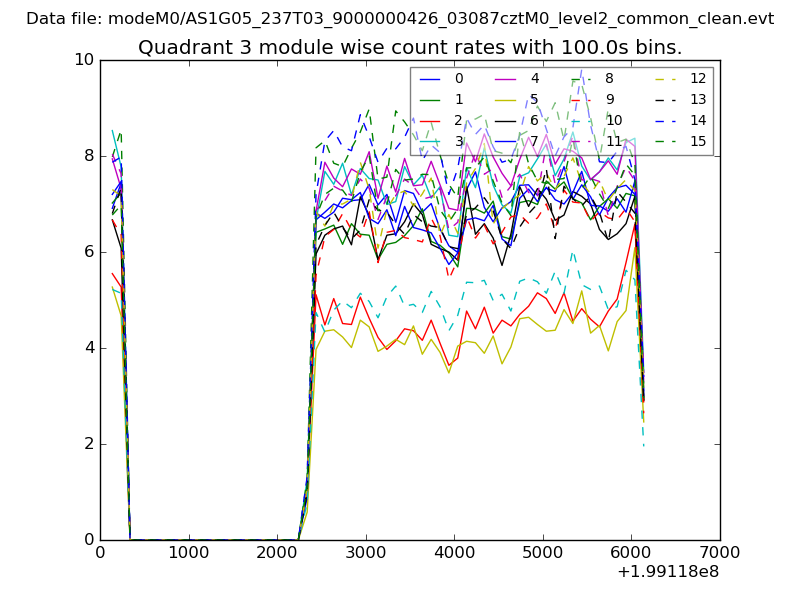
| Module-wise count rates for Quadrant A Data is divided into 100 sec bins |
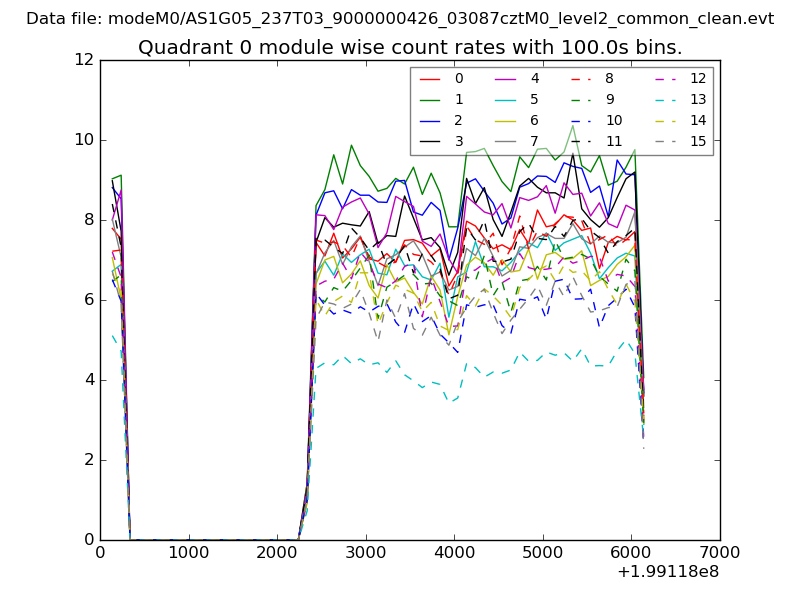 |
 |
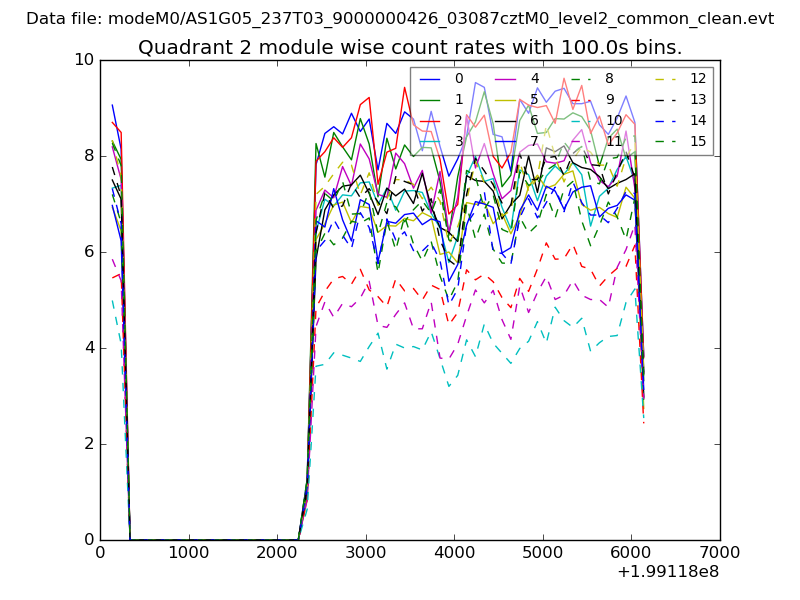
| Module-wise count rates for Quadrant B Data is divided into 100 sec bins |
 |
 |
| Module-wise count rates for Quadrant C Data is divided into 100 sec bins |
 |
 |
| Module-wise count rates for Quadrant D Data is divided into 100 sec bins |
 |
 |
| Parameter | Plot |
|---|---|
| CZT HV Monitor | 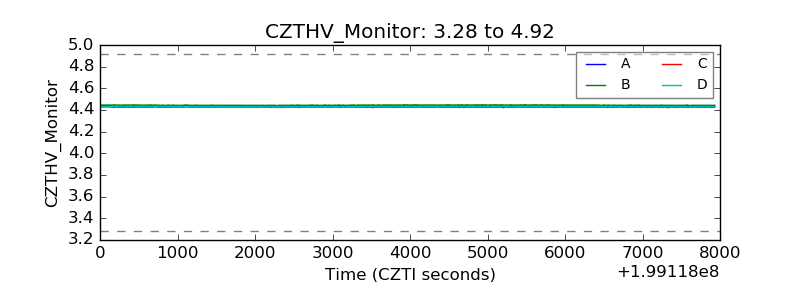 |
| D_VDD | 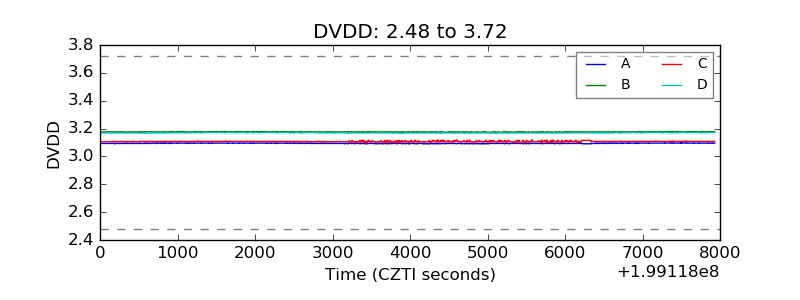 |
| Temperature 1 | 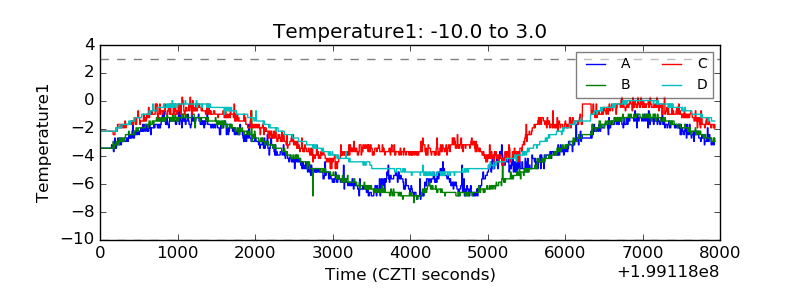 |
| Veto HV Monitor | 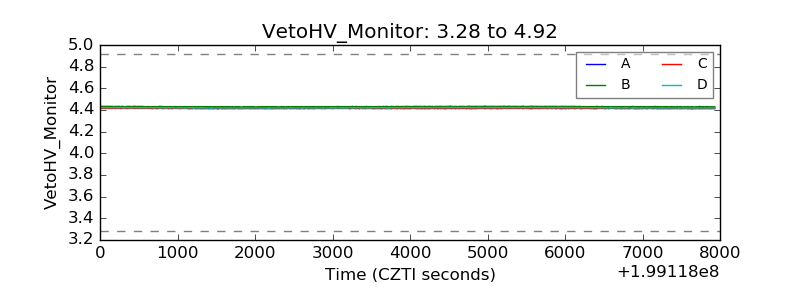 |
| Veto LLD | 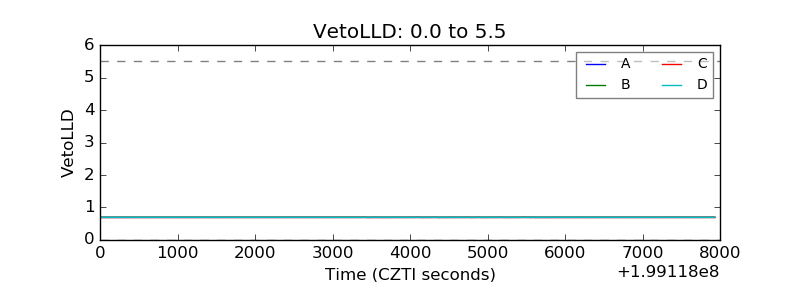 |
| Alpha Counter | 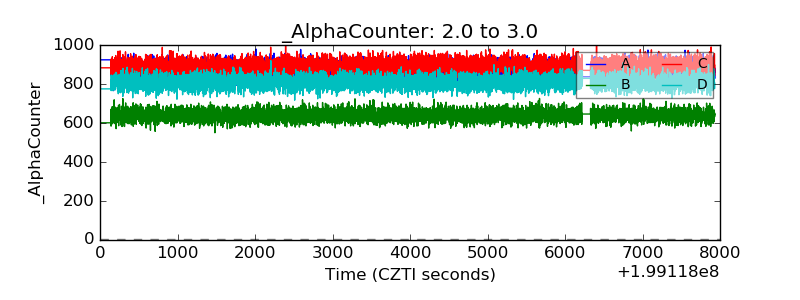 |
| _CPM_Rate | 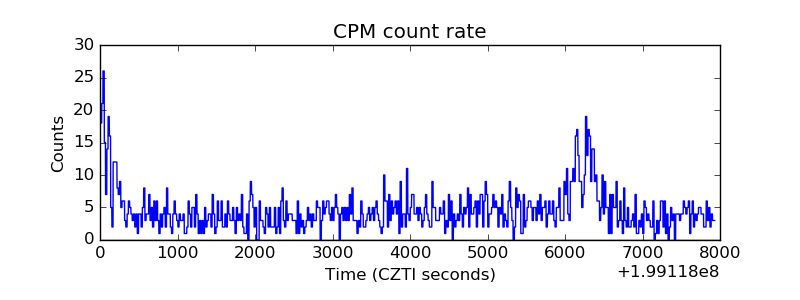 |
| CZT Counter | 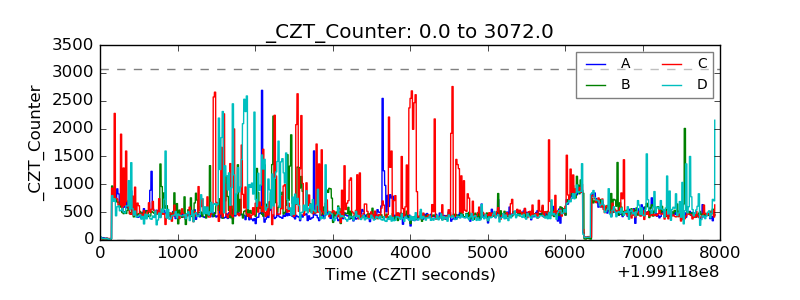 |
| +2.5 Volts monitor |  |
| +5 Volts monitor |  |
| Veto Counter | 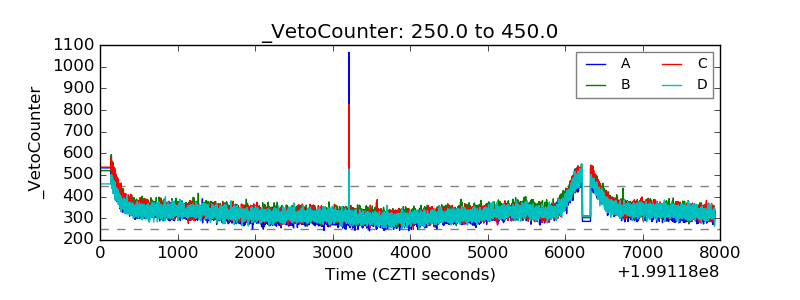 |