| Param | Original file | Final file |
|---|---|---|
| Filename | modeM0/AS1G05_237T03_9000000426_03088cztM0_level2.evt | modeM0/AS1G05_237T03_9000000426_03088cztM0_level2_quad_clean.evt |
| Size (bytes) | 611,648,640 | 84,072,960 |
| Size | 583.3 MB | 80.2 MB |
| Events in quadrant A | 4,198,274 | 497,005 |
| Events in quadrant B | 4,451,540 | 495,171 |
| Events in quadrant C | 4,365,827 | 494,583 |
| Events in quadrant D | 4,941,288 | 478,483 |
| Mode M9 | |||
|---|---|---|---|
| Quadrant | BADHDUFLAG | Total packets | Discarded packets |
| A | 0 | 1 | 0 |
| B | 0 | 1 | 0 |
| C | 0 | 1 | 0 |
| D | 0 | 1 | 0 |
| Mode M0 | |||
|---|---|---|---|
| Quadrant | BADHDUFLAG | Total packets | Discarded packets |
| A | 0 | 18048 | 4 |
| B | 0 | 18720 | 3 |
| C | 0 | 18772 | 3 |
| D | 0 | 20509 | 3 |
| Mode SS | |||
|---|---|---|---|
| Quadrant | BADHDUFLAG | Total packets | Discarded packets |
| A | 0 | 170 | 0 |
| B | 0 | 170 | 0 |
| C | 0 | 170 | 0 |
| D | 0 | 170 | 0 |
| Quadrant | Total seconds | Saturated seconds | Saturation percentage |
|---|---|---|---|
| A | 8354 | 255 | 3.052430% |
| B | 8354 | 253 | 3.028489% |
| C | 8354 | 270 | 3.231985% |
| D | 8354 | 431 | 5.159205% |
Noise dominated data is calculated using 1-second bins in cleaned event files. If a bin has >2000 counts, and if more than 50% of those come from <1% of pixels, then it is considered to be noise-dominated and hence unusable.
| Quadrant | # 1 sec bins | Bins with >0 counts | Bins with >2000 counts | High rate bins dominated by noise | Noise dominated (total time) | Noise dominated (detector-on time) | Marked lightcurve |
|---|---|---|---|---|---|---|---|
| A | 8554 | 8357 | 20 | 20 | 0.23% | 0.24% | 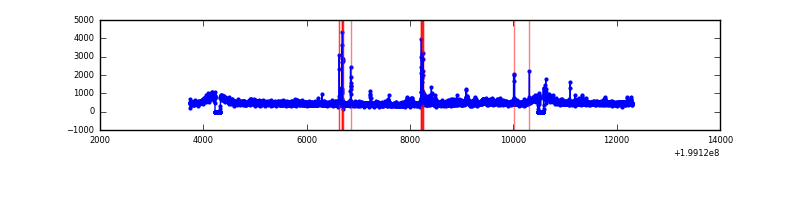 |
| B | 8554 | 8357 | 5 | 5 | 0.06% | 0.06% | 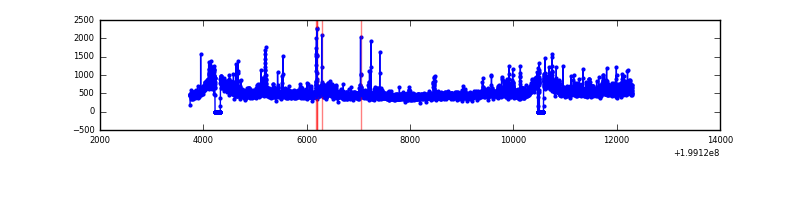 |
| C | 8554 | 8357 | 44 | 44 | 0.51% | 0.53% | 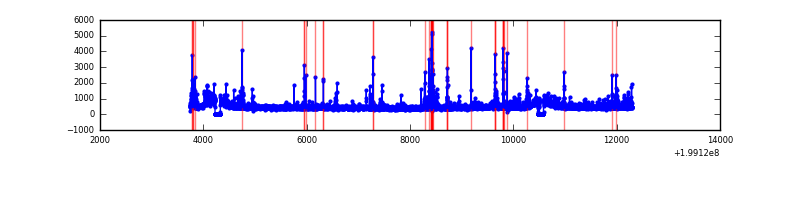 |
| D | 8554 | 8357 | 147 | 147 | 1.72% | 1.76% | 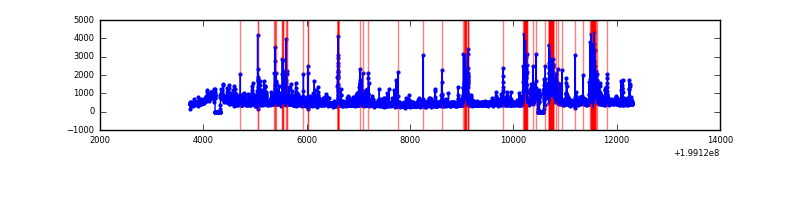 |
Top three noisy pixels from each quadrant. If the there are fewer than three noisy pixels in the level2.evt file, extra rows are filled as -1
| Pixel properties | Quadrant properties | ||||||
|---|---|---|---|---|---|---|---|
| Quadrant | DetID | PixID | Counts | Sigma | Mean | Median | Sigma |
| A | 0 | 50 | 139092 | 664.58 | 1008 | 986 | 207.8 |
| A | 12 | 247 | 49511 | 233.51 | 1008 | 986 | 207.8 |
| A | 13 | 251 | 36708 | 171.9 | 1008 | 986 | 207.8 |
| B | 15 | 204 | 236291 | 1179.42 | 1018 | 992 | 199.5 |
| B | 0 | 219 | 141979 | 706.69 | 1018 | 992 | 199.5 |
| B | 2 | 249 | 30550 | 148.16 | 1018 | 992 | 199.5 |
| C | 0 | 219 | 171534 | 745.48 | 974 | 978 | 228.8 |
| C | 14 | 223 | 130768 | 567.3 | 974 | 978 | 228.8 |
| C | 1 | 16 | 113079 | 489.98 | 974 | 978 | 228.8 |
| D | 1 | 7 | 703406 | 2958.84 | 969 | 937 | 237.4 |
| D | 10 | 85 | 183690 | 769.77 | 969 | 937 | 237.4 |
| D | 13 | 46 | 84645 | 352.58 | 969 | 937 | 237.4 |
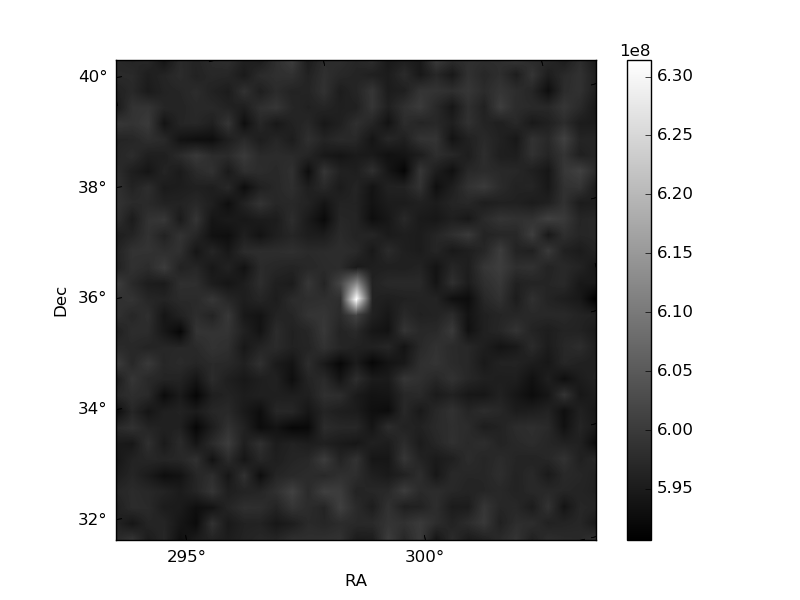
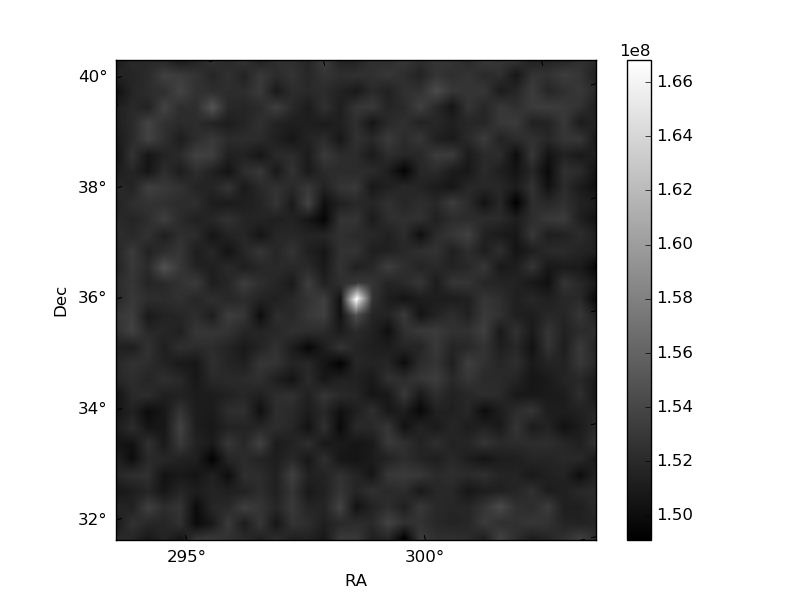
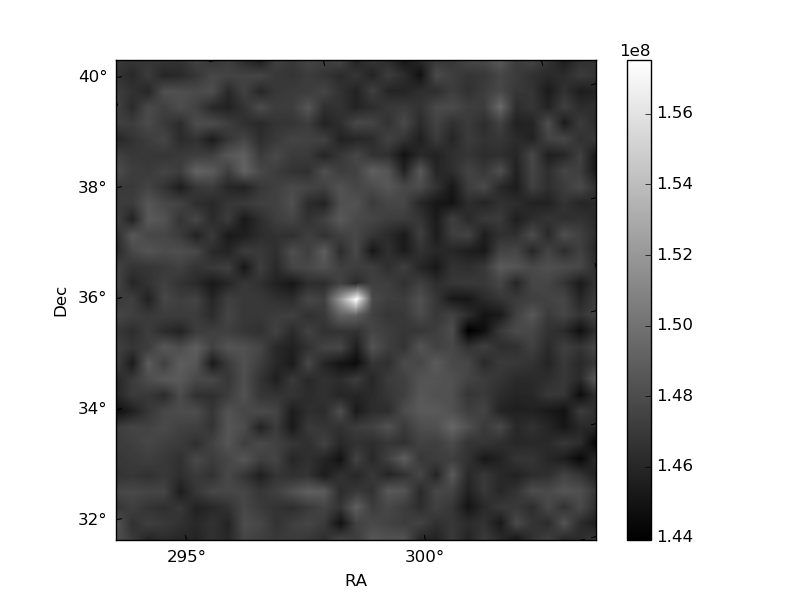
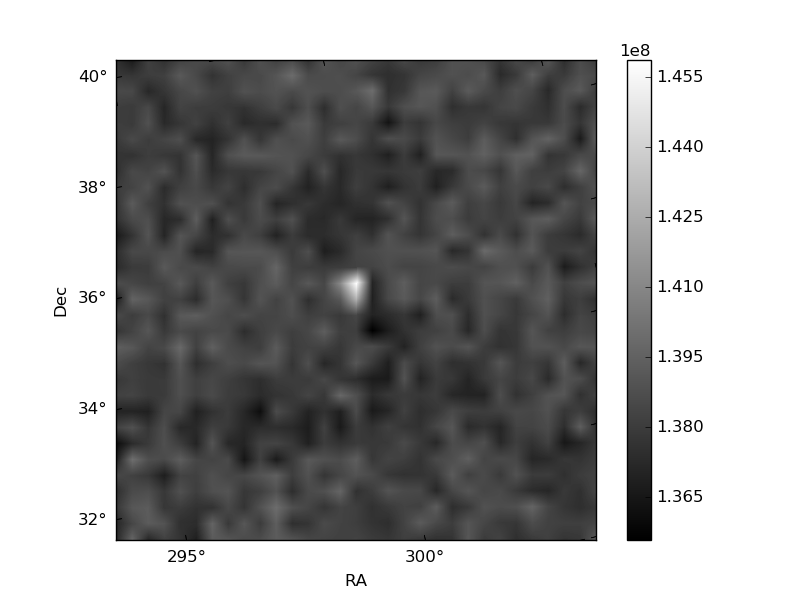
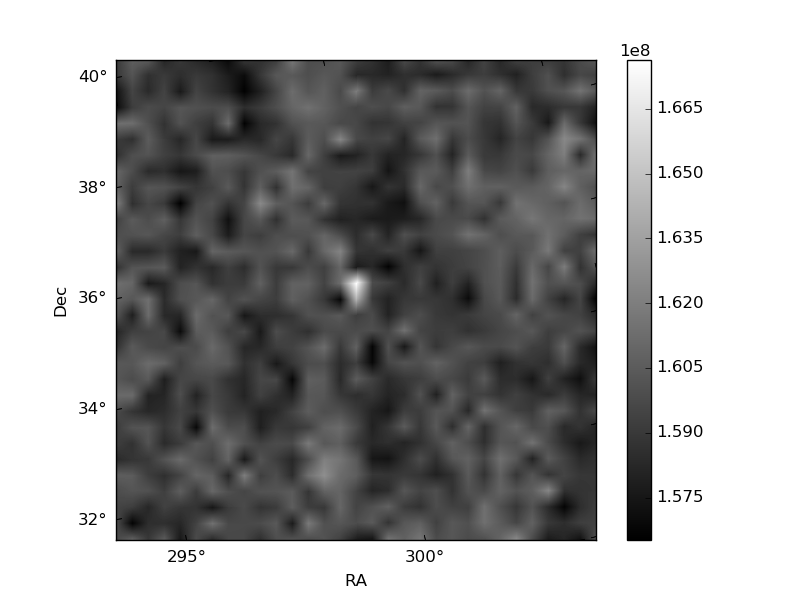
Histogram calculated using DETX and DETY for each event in the final _common_clean file
| Quadrant A | 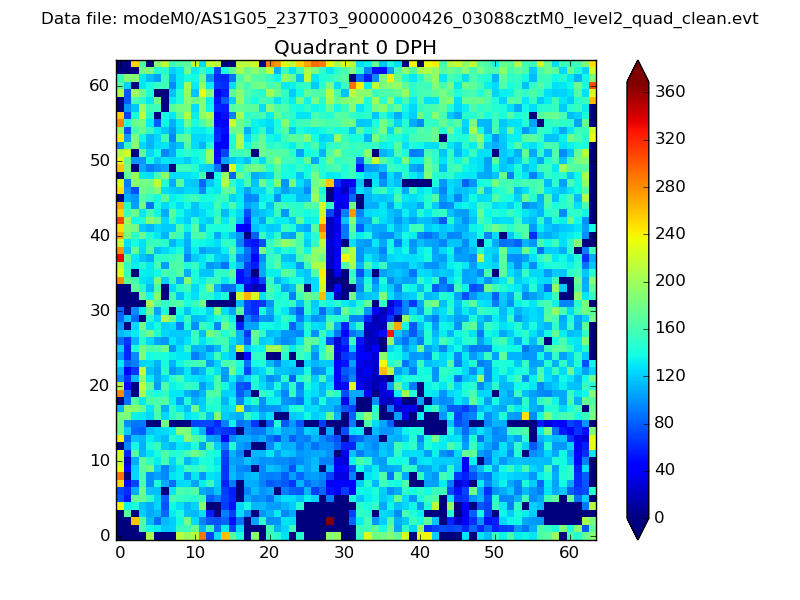 |
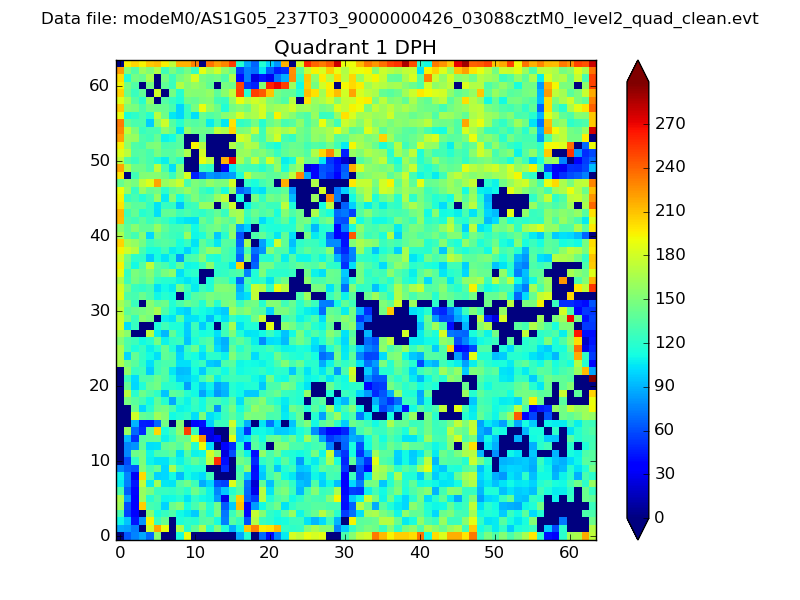 |
Quadrant B |
|---|---|---|---|
| Quadrant D | 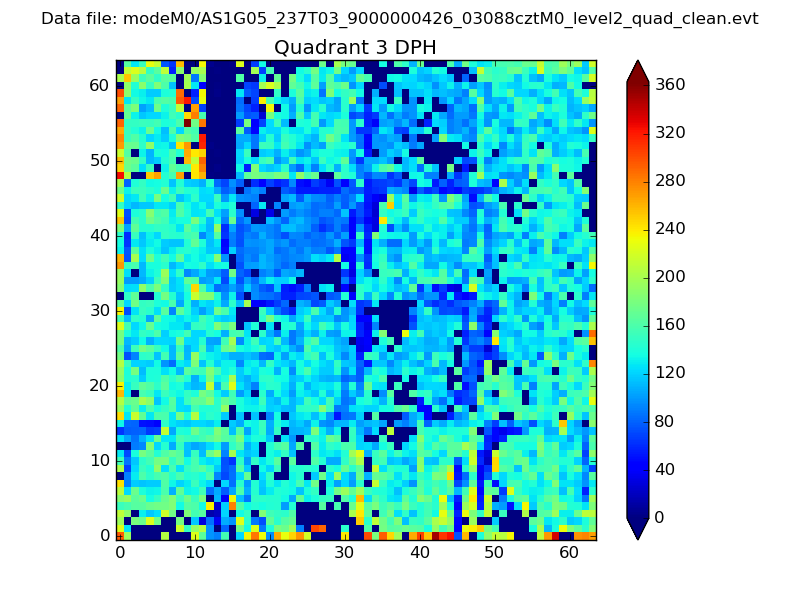 |
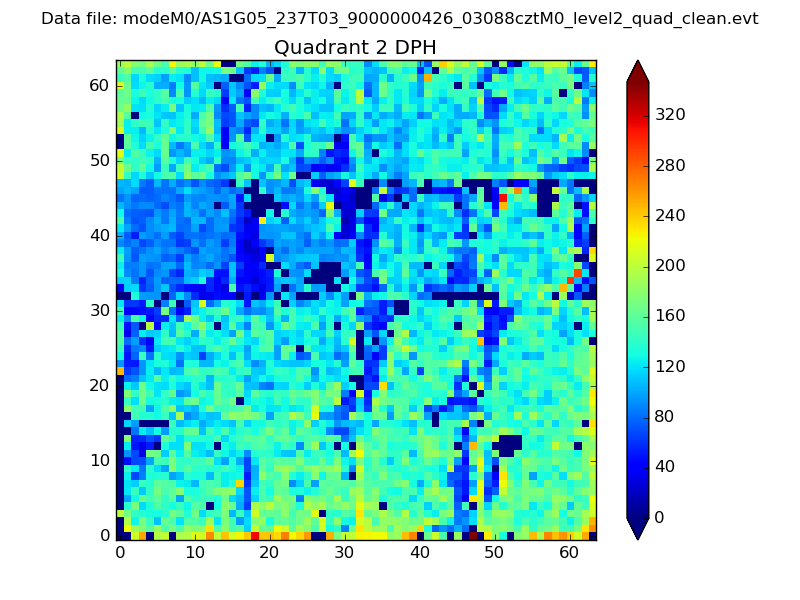 |
Quadrant C |
| Plot type | Count rate plots | Images |
|---|---|---|
| Comparison with Poisson distribution Blue bars denote a histogram of data divided into 1 sec bins. Red curve is a Poisson curve with rate = median count rate of data. |
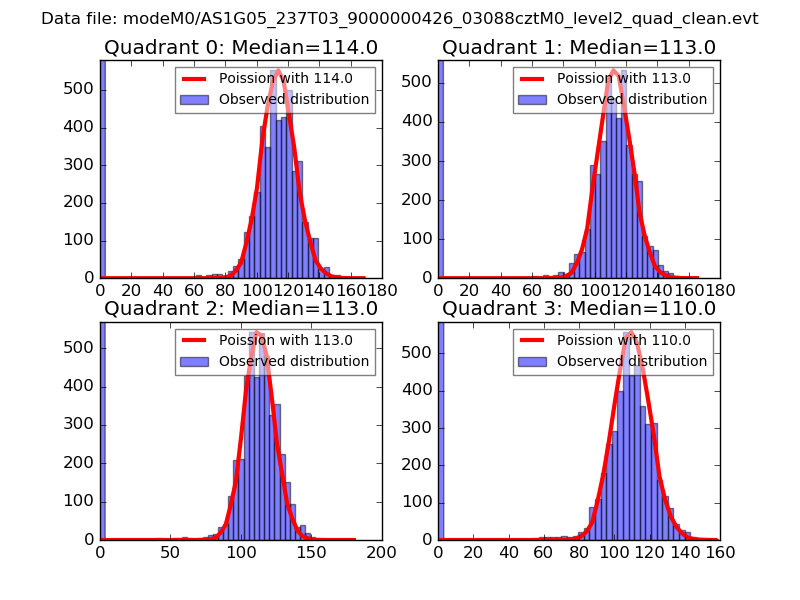 |
 |
| Quadrant-wise count rates Data is divided into 100 sec bins |
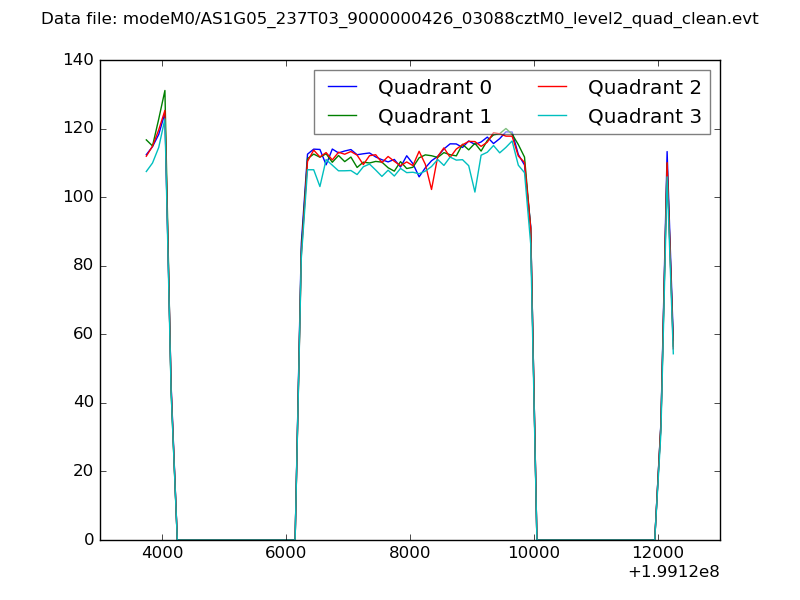 |
|
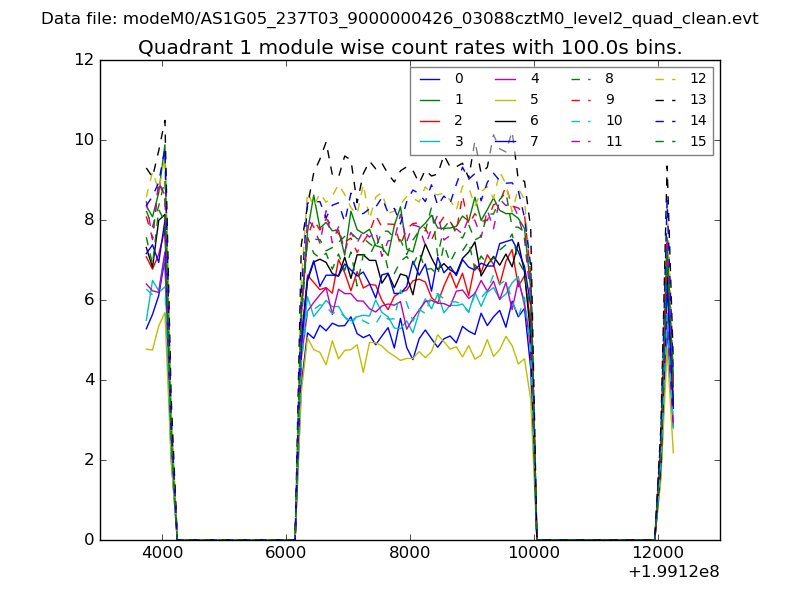
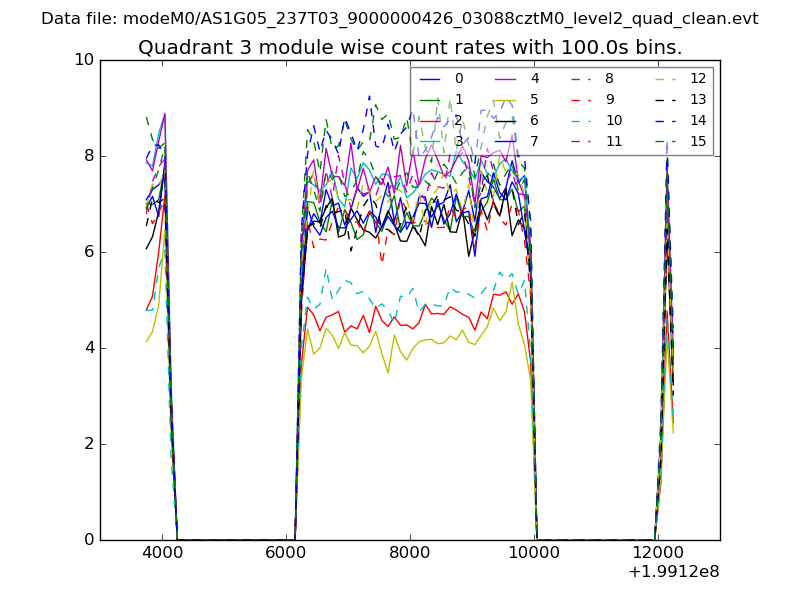
| Module-wise count rates for Quadrant A Data is divided into 100 sec bins |
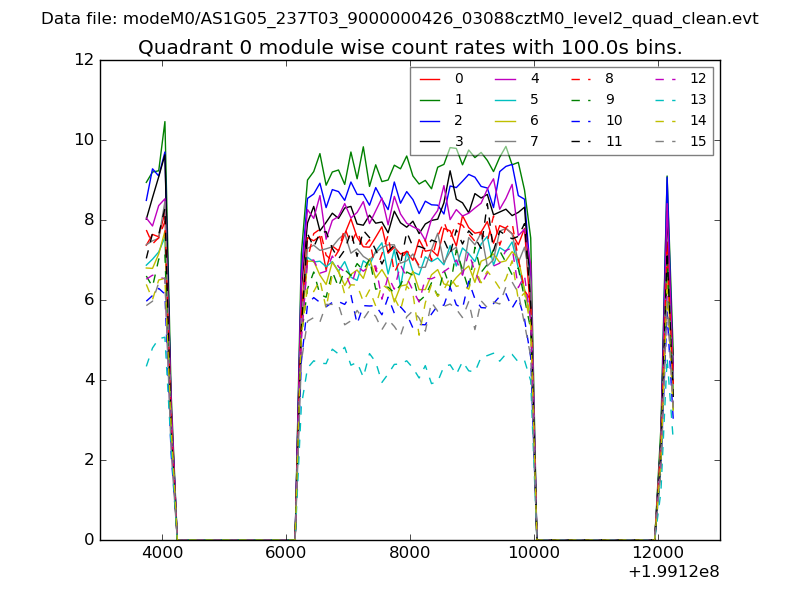 |
 |
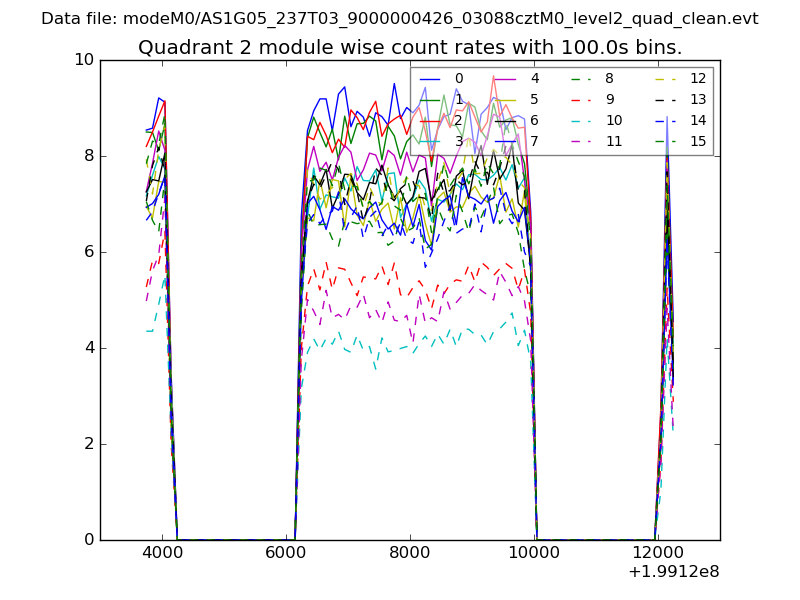
| Module-wise count rates for Quadrant B Data is divided into 100 sec bins |
 |
 |
| Module-wise count rates for Quadrant C Data is divided into 100 sec bins |
 |
 |
| Module-wise count rates for Quadrant D Data is divided into 100 sec bins |
 |
 |
| Parameter | Plot |
|---|---|
| CZT HV Monitor | 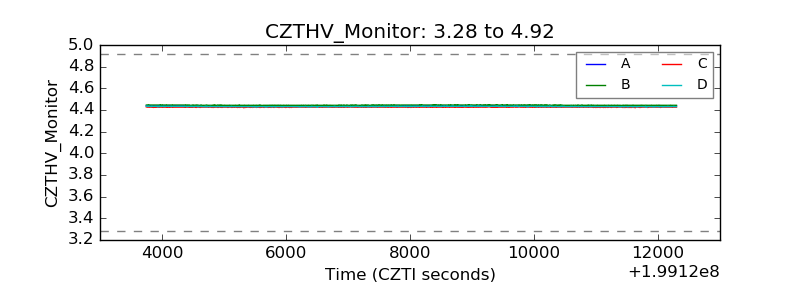 |
| D_VDD | 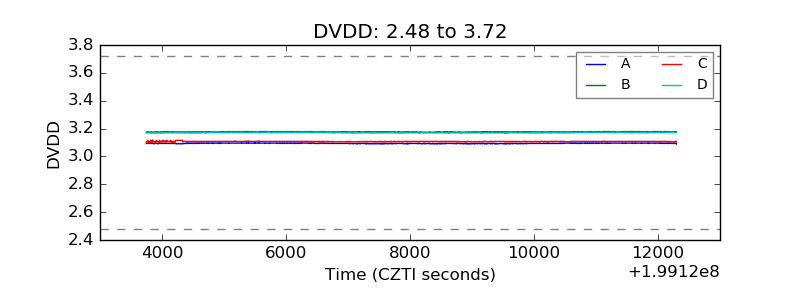 |
| Temperature 1 | 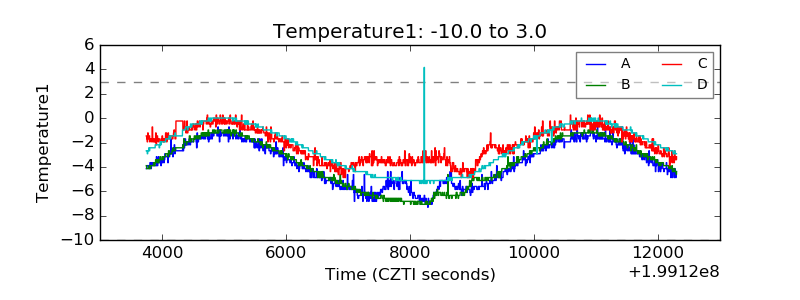 |
| Veto HV Monitor | 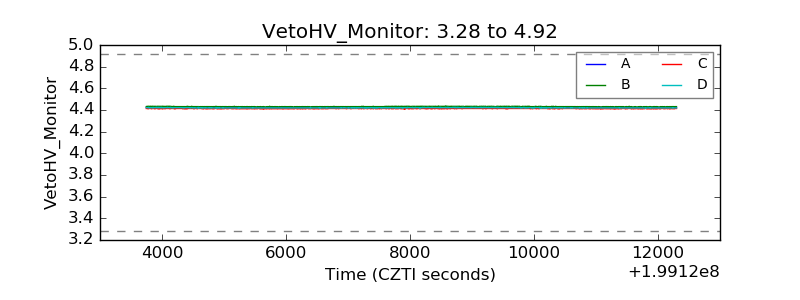 |
| Veto LLD | 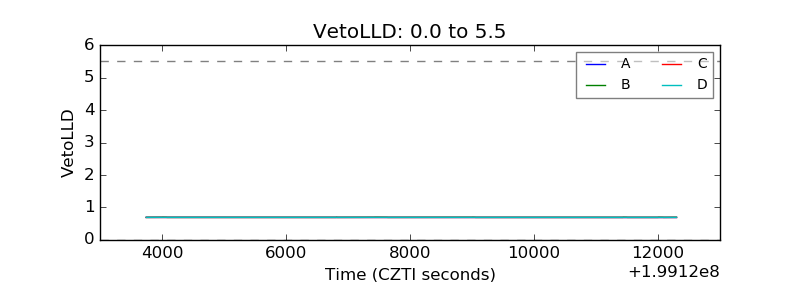 |
| Alpha Counter | 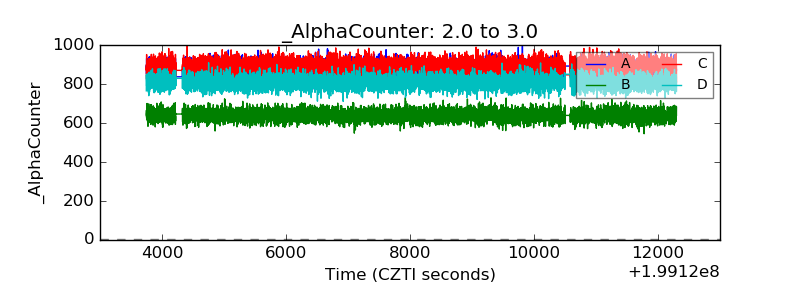 |
| _CPM_Rate | 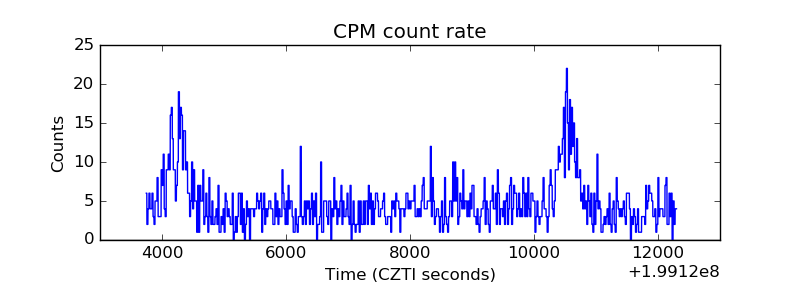 |
| CZT Counter | 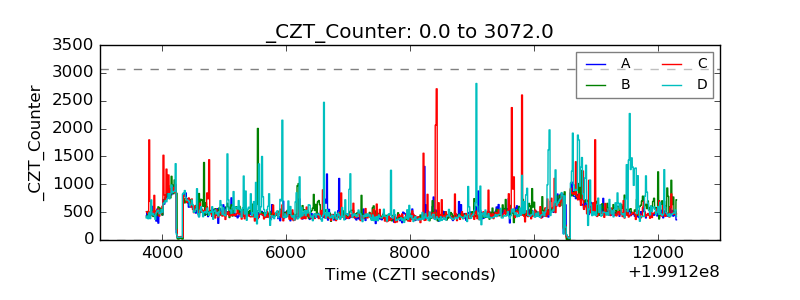 |
| +2.5 Volts monitor |  |
| +5 Volts monitor |  |
| _ROLL_ROT | 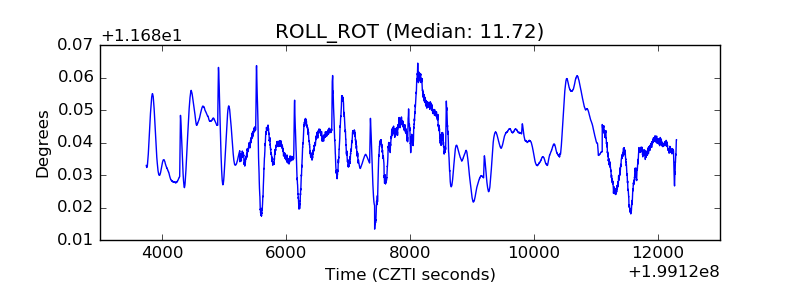 |
| _Roll_DEC | 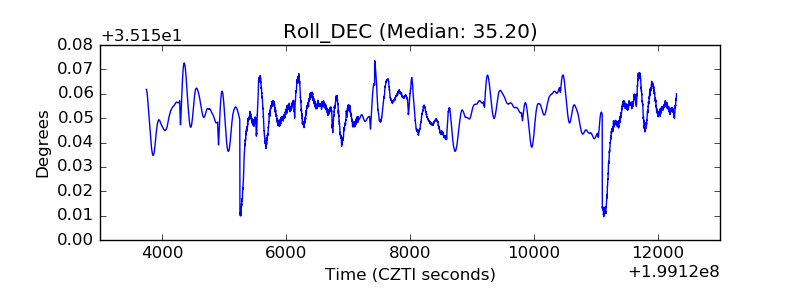 |
| _Roll_RA | 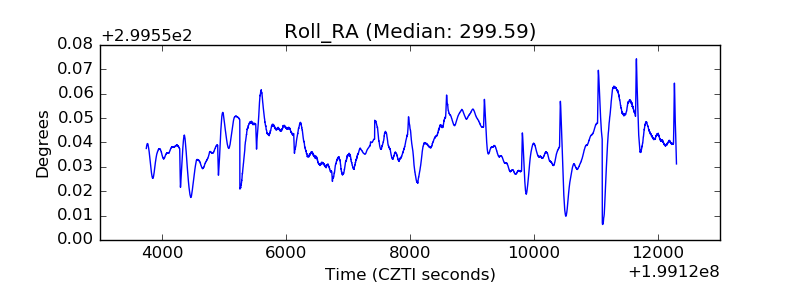 |
| Veto Counter | 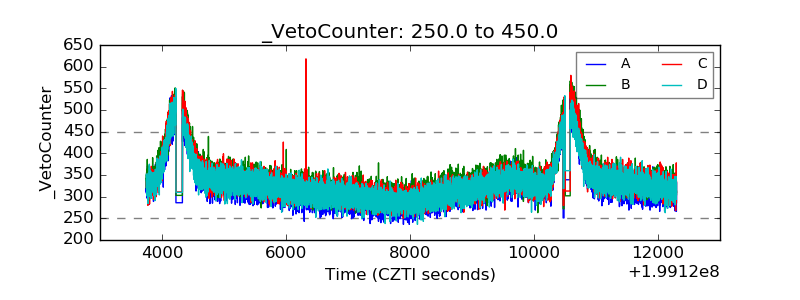 |