| Param | Original file | Final file |
|---|---|---|
| Filename | modeM0/AS1G05_237T03_9000000426_03089cztM0_level2.evt | modeM0/AS1G05_237T03_9000000426_03089cztM0_level2_quad_clean.evt |
| Size (bytes) | 344,283,840 | 58,728,960 |
| Size | 328.3 MB | 56.0 MB |
| Events in quadrant A | 2,148,591 | 368,325 |
| Events in quadrant B | 2,558,760 | 360,657 |
| Events in quadrant C | 2,237,874 | 366,997 |
| Events in quadrant D | 3,157,158 | 348,033 |
| Mode M0 | |||
|---|---|---|---|
| Quadrant | BADHDUFLAG | Total packets | Discarded packets |
| A | 0 | 9786 | 1 |
| B | 0 | 10938 | 0 |
| C | 0 | 10081 | 0 |
| D | 0 | 12547 | 0 |
| Mode SS | |||
|---|---|---|---|
| Quadrant | BADHDUFLAG | Total packets | Discarded packets |
| A | 0 | 96 | 0 |
| B | 0 | 96 | 0 |
| C | 0 | 96 | 0 |
| D | 0 | 96 | 0 |
| Quadrant | Total seconds | Saturated seconds | Saturation percentage |
|---|---|---|---|
| A | 4755 | 13 | 0.273396% |
| B | 4755 | 22 | 0.462671% |
| C | 4755 | 18 | 0.378549% |
| D | 4755 | 194 | 4.079916% |
Noise dominated data is calculated using 1-second bins in cleaned event files. If a bin has >2000 counts, and if more than 50% of those come from <1% of pixels, then it is considered to be noise-dominated and hence unusable.
| Quadrant | # 1 sec bins | Bins with >0 counts | Bins with >2000 counts | High rate bins dominated by noise | Noise dominated (total time) | Noise dominated (detector-on time) | Marked lightcurve |
|---|---|---|---|---|---|---|---|
| A | 4755 | 4755 | 0 | 0 | 0.00% | 0.00% | 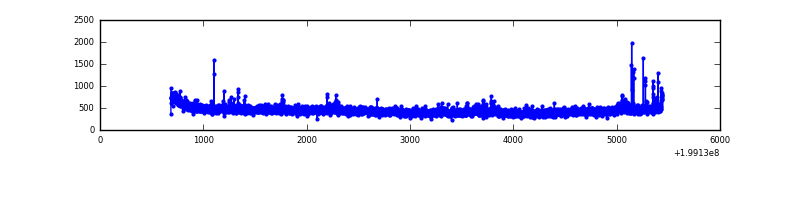 |
| B | 4755 | 4755 | 4 | 4 | 0.08% | 0.08% | 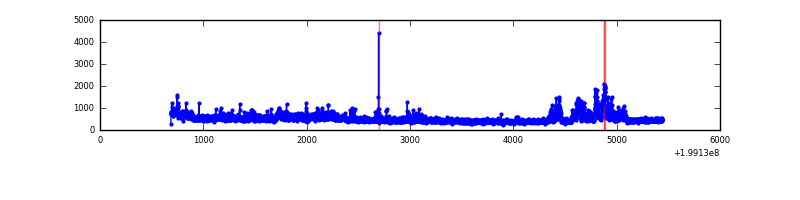 |
| C | 4755 | 4755 | 8 | 8 | 0.17% | 0.17% | 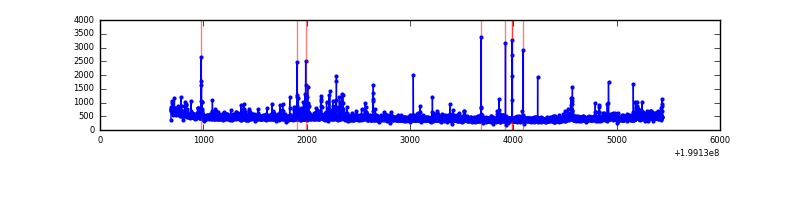 |
| D | 4755 | 4755 | 141 | 141 | 2.97% | 2.97% | 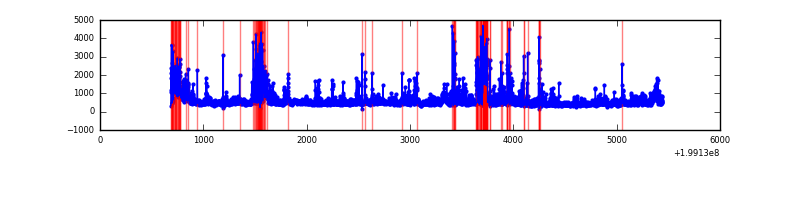 |
Top three noisy pixels from each quadrant. If the there are fewer than three noisy pixels in the level2.evt file, extra rows are filled as -1
| Pixel properties | Quadrant properties | ||||||
|---|---|---|---|---|---|---|---|
| Quadrant | DetID | PixID | Counts | Sigma | Mean | Median | Sigma |
| A | 0 | 50 | 62803 | 570.16 | 528 | 517 | 109.2 |
| A | 8 | 15 | 18461 | 164.26 | 528 | 517 | 109.2 |
| A | 13 | 251 | 12959 | 113.89 | 528 | 517 | 109.2 |
| B | 3 | 0 | 219811 | 2088.09 | 534 | 521 | 105.0 |
| B | 15 | 204 | 158977 | 1508.82 | 534 | 521 | 105.0 |
| B | 0 | 219 | 42939 | 403.91 | 534 | 521 | 105.0 |
| C | 14 | 223 | 85532 | 708.8 | 513 | 517 | 119.9 |
| C | 1 | 16 | 71497 | 591.78 | 513 | 517 | 119.9 |
| C | 6 | 80 | 25401 | 207.47 | 513 | 517 | 119.9 |
| D | 1 | 7 | 671207 | 5055.15 | 500 | 488 | 132.7 |
| D | 13 | 114 | 215367 | 1619.52 | 500 | 488 | 132.7 |
| D | 13 | 46 | 115756 | 868.77 | 500 | 488 | 132.7 |
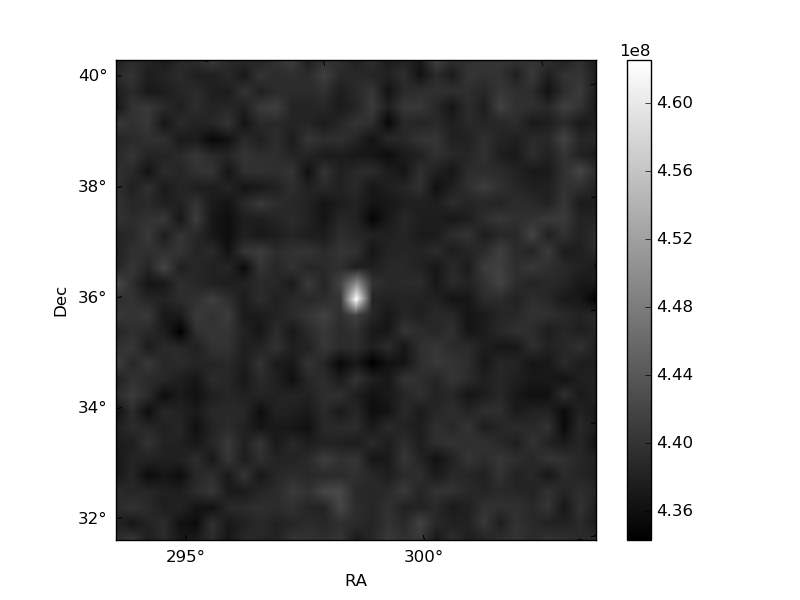
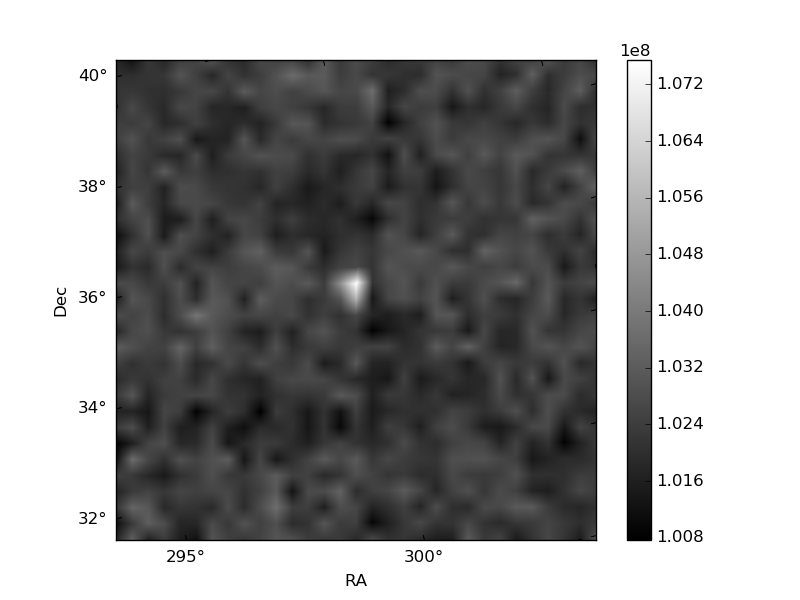
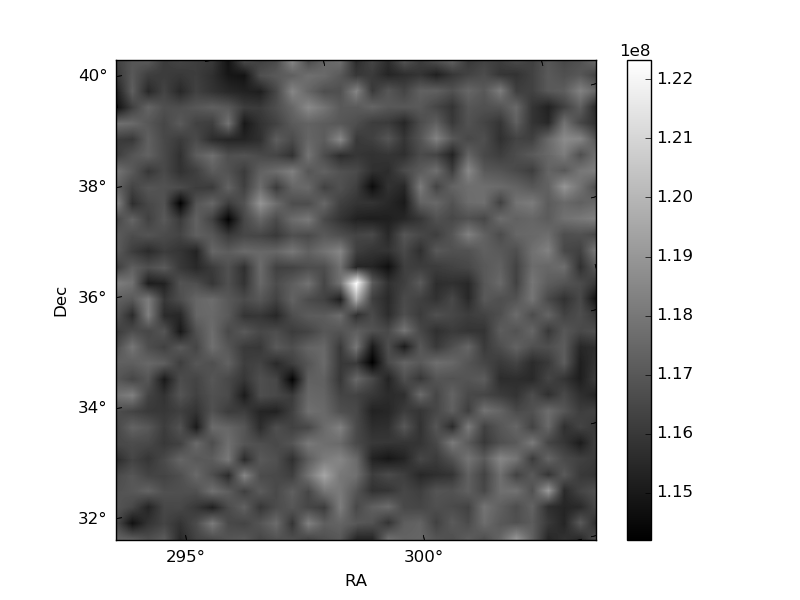
Histogram calculated using DETX and DETY for each event in the final _common_clean file
| Quadrant A | 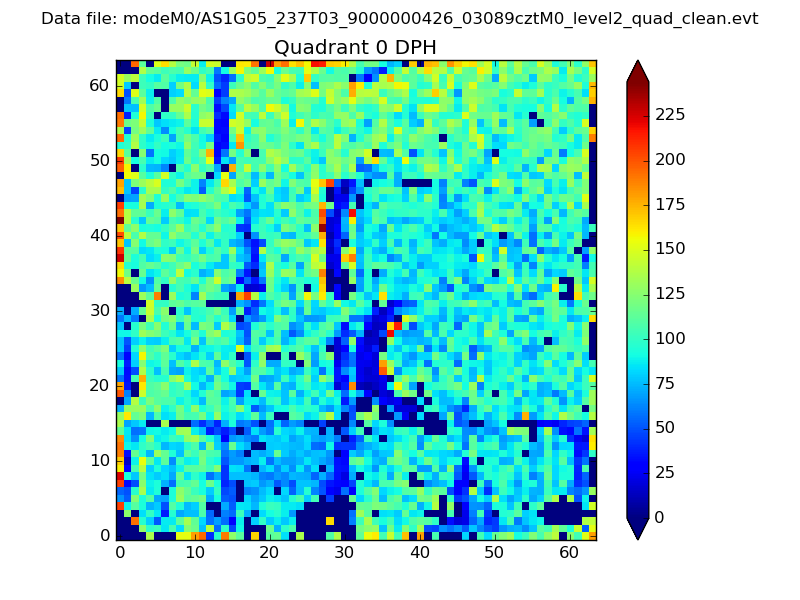 |
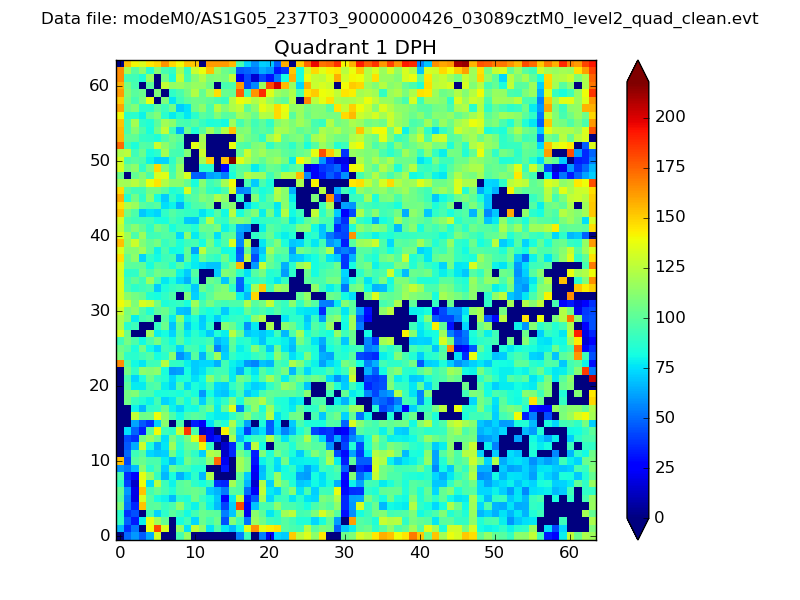 |
Quadrant B |
|---|---|---|---|
| Quadrant D | 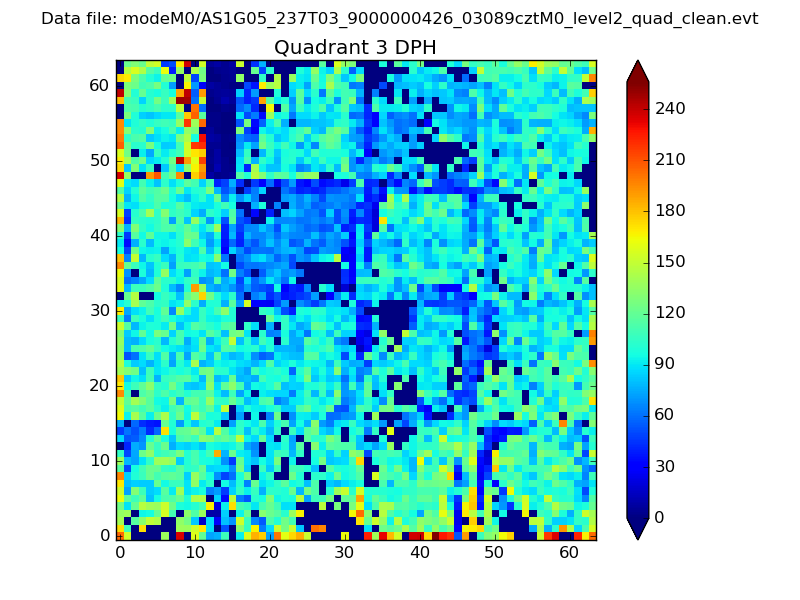 |
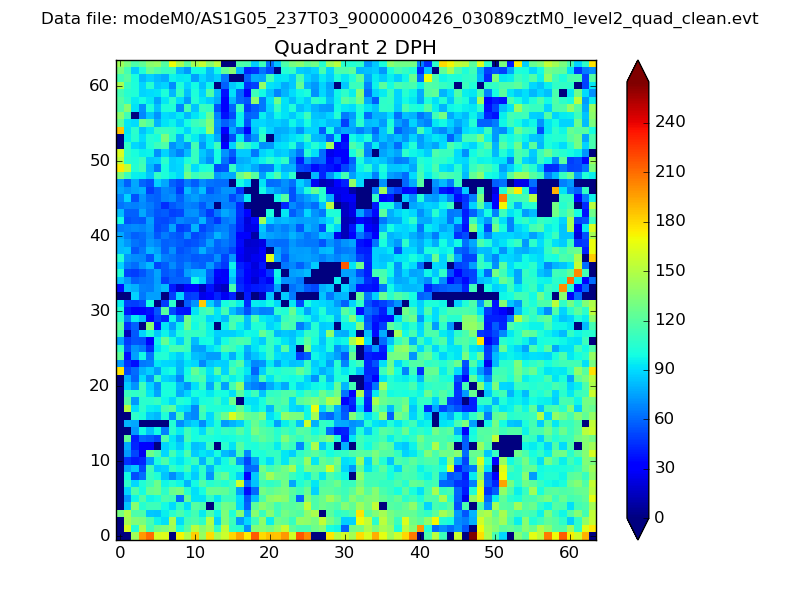 |
Quadrant C |
| Plot type | Count rate plots | Images |
|---|---|---|
| Comparison with Poisson distribution Blue bars denote a histogram of data divided into 1 sec bins. Red curve is a Poisson curve with rate = median count rate of data. |
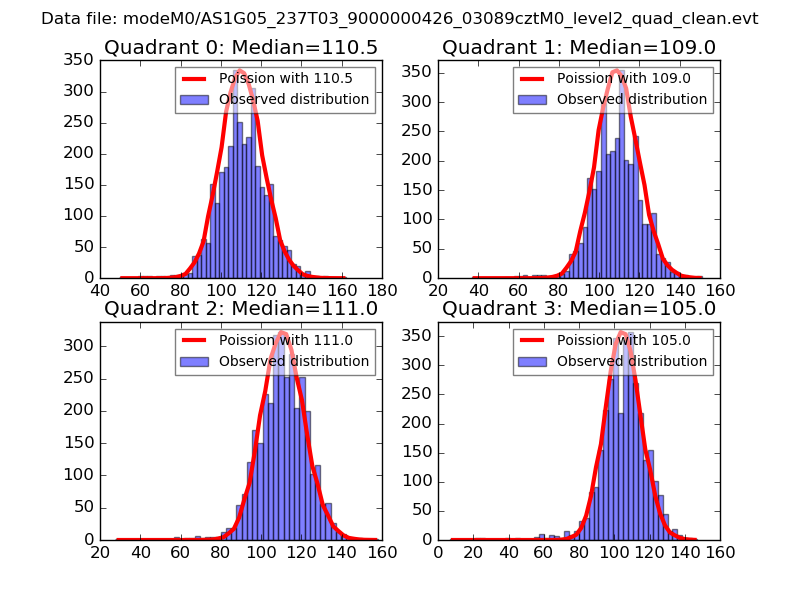 |
 |
| Quadrant-wise count rates Data is divided into 100 sec bins |
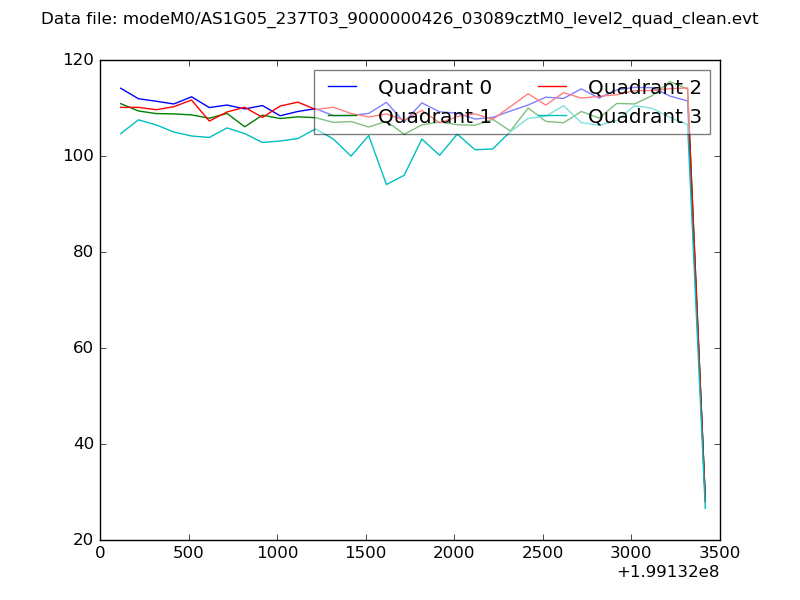 |
|
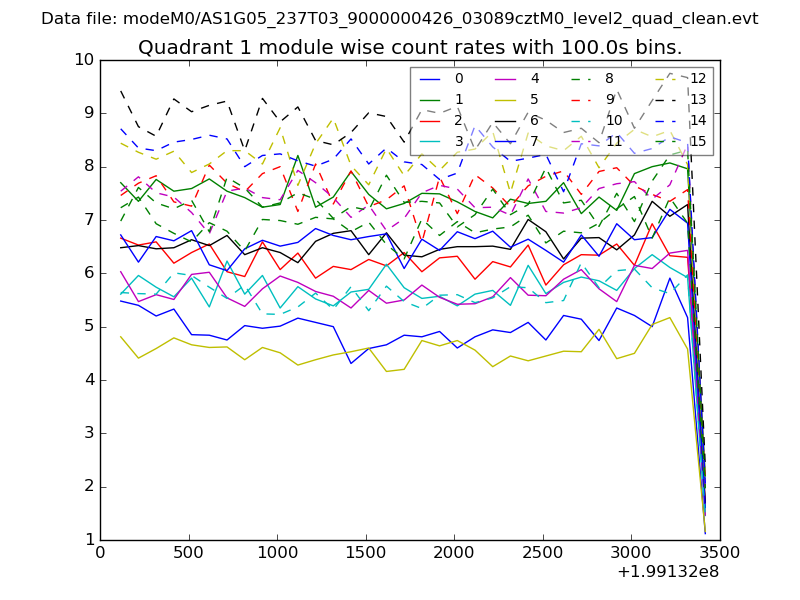
| Module-wise count rates for Quadrant A Data is divided into 100 sec bins |
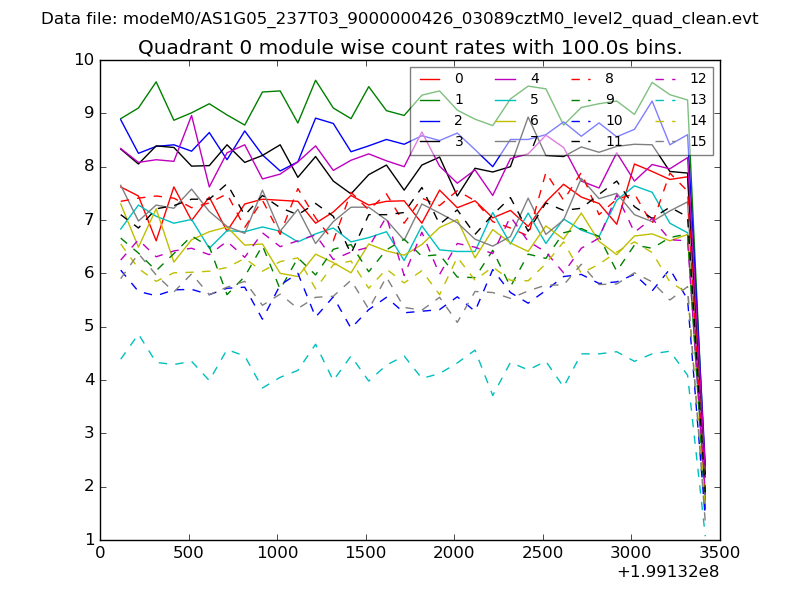 |
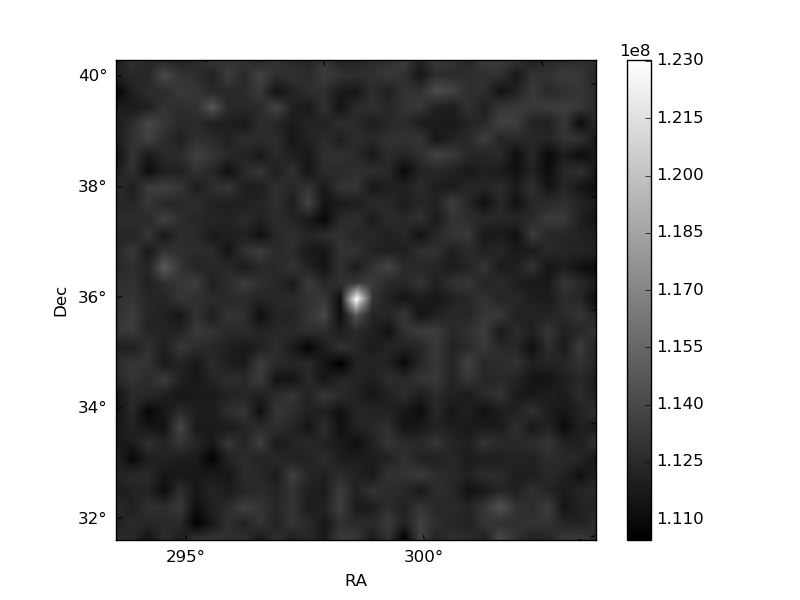 |
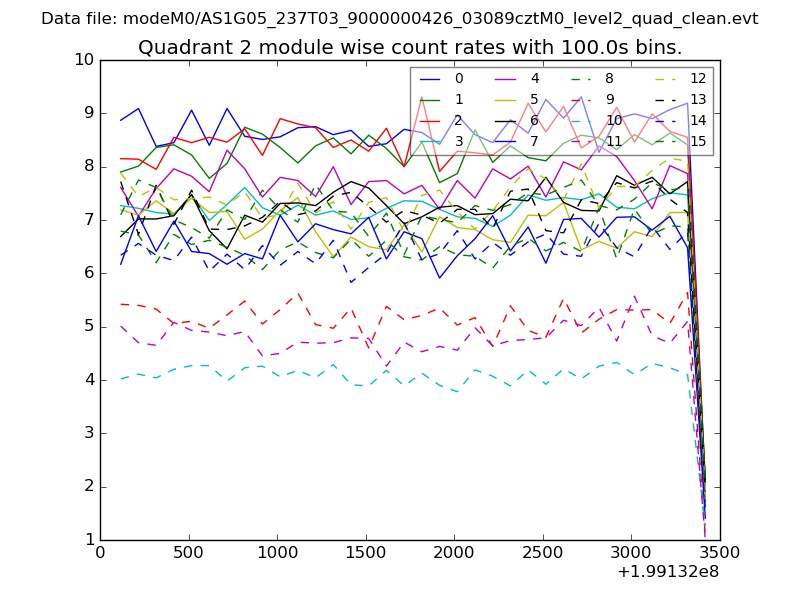
| Module-wise count rates for Quadrant B Data is divided into 100 sec bins |
 |
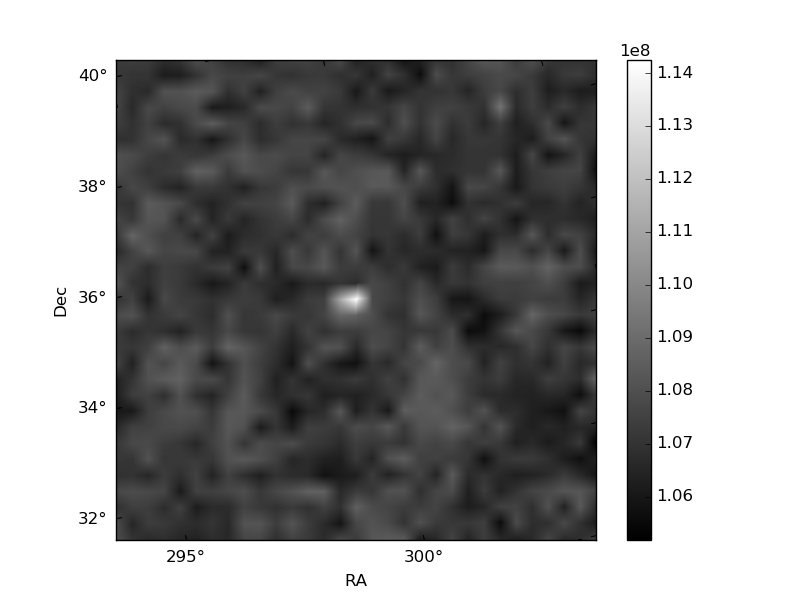 |
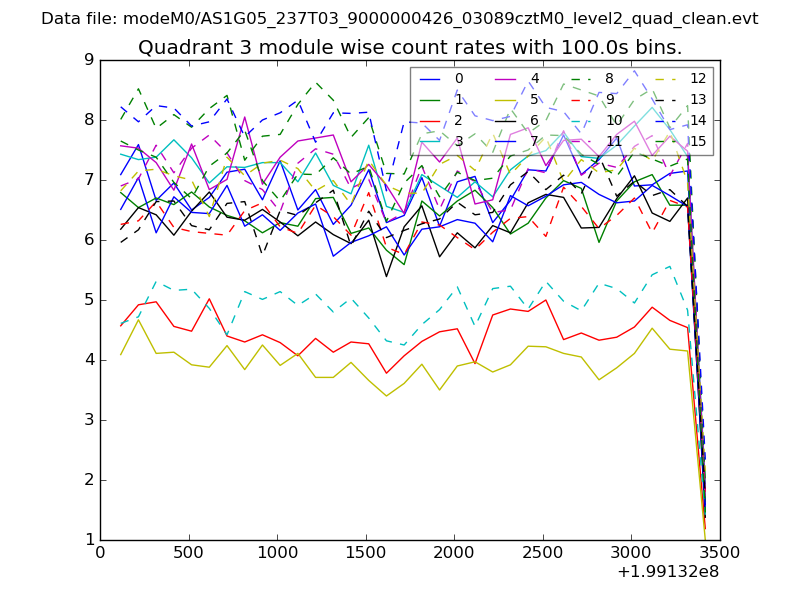
| Module-wise count rates for Quadrant C Data is divided into 100 sec bins |
 |
 |
| Module-wise count rates for Quadrant D Data is divided into 100 sec bins |
 |
 |
| Parameter | Plot |
|---|---|
| CZT HV Monitor | 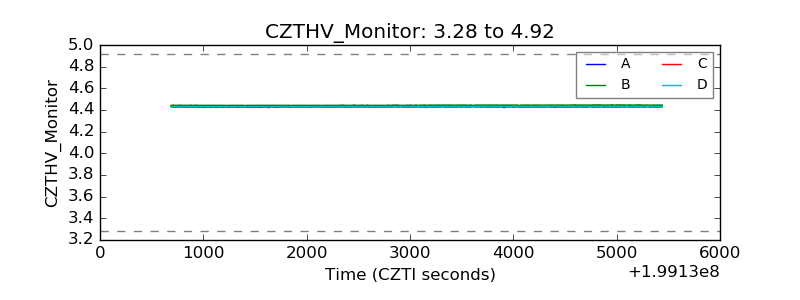 |
| D_VDD | 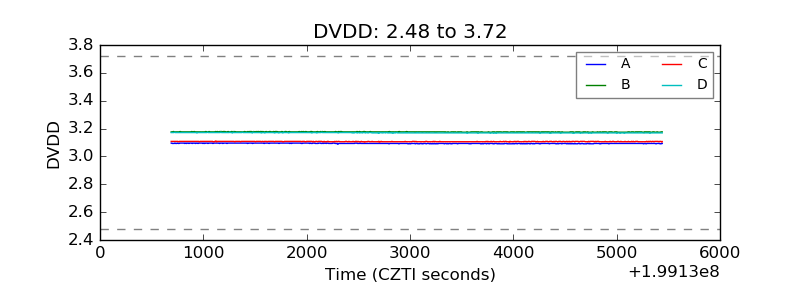 |
| Temperature 1 | 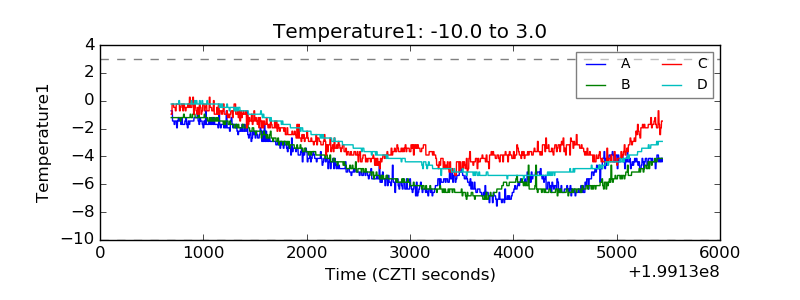 |
| Veto HV Monitor | 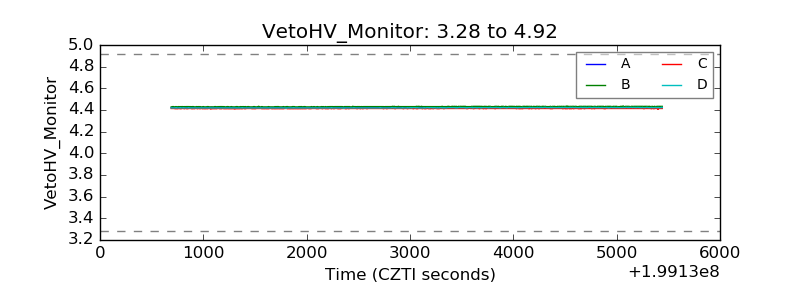 |
| Veto LLD | 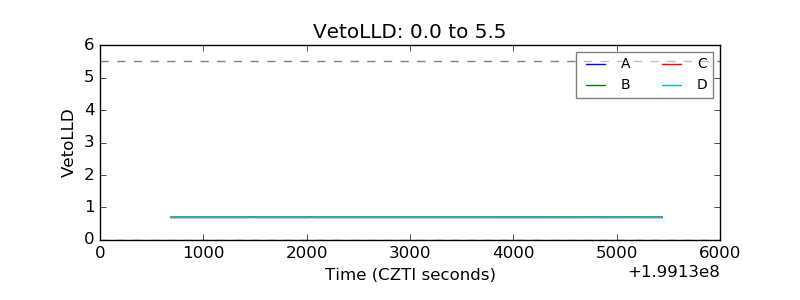 |
| Alpha Counter | 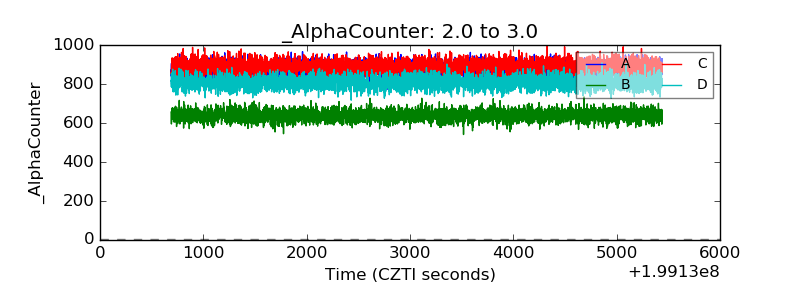 |
| _CPM_Rate | 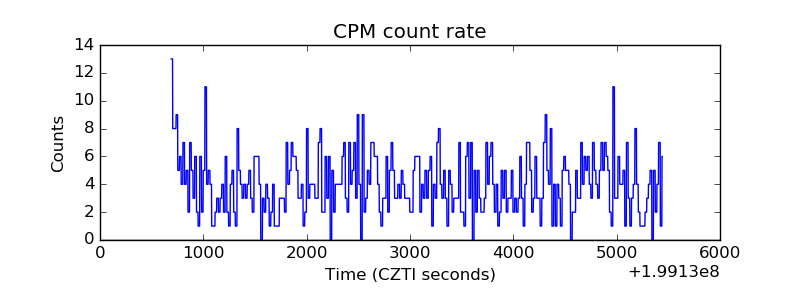 |
| CZT Counter | 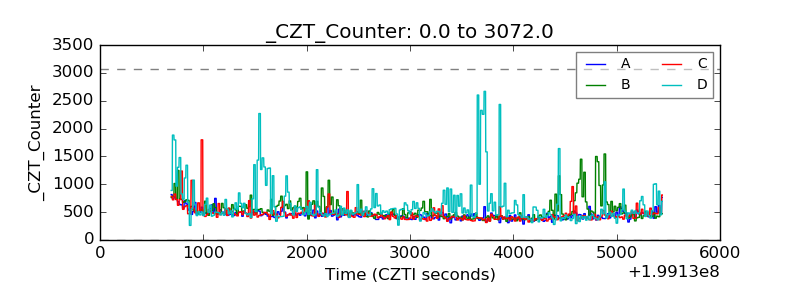 |
| +2.5 Volts monitor |  |
| +5 Volts monitor |  |
| _ROLL_ROT | 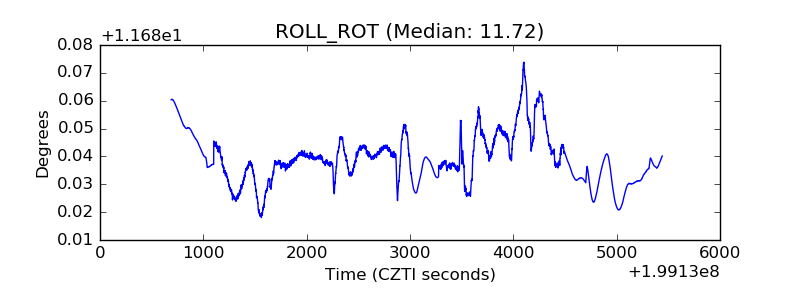 |
| _Roll_DEC | 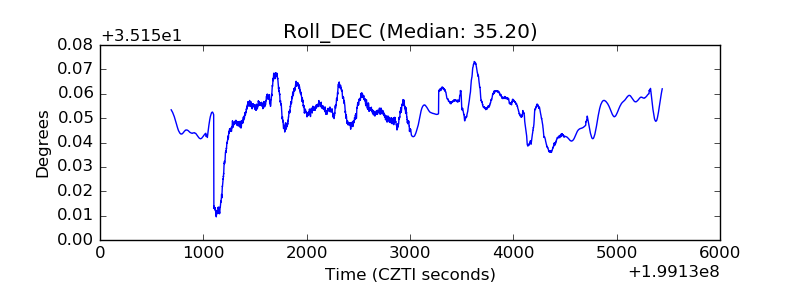 |
| _Roll_RA | 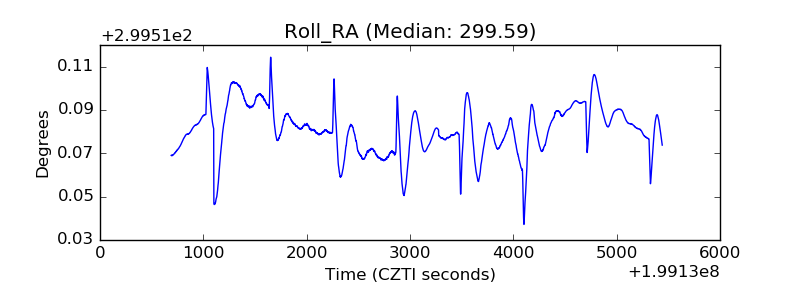 |
| Veto Counter | 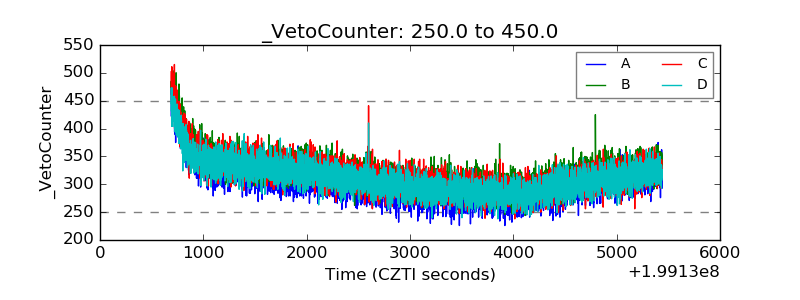 |