| Param | Original file | Final file |
|---|---|---|
| Filename | modeM0/AS1G05_237T03_9000000426_03091cztM0_level2.evt | modeM0/AS1G05_237T03_9000000426_03091cztM0_level2_common_clean.evt |
| Size (bytes) | 1,036,578,240 | 170,179,200 |
| Size | 988.6 MB | 162.3 MB |
| Events in quadrant A | 6,963,415 | 1,056,049 |
| Events in quadrant B | 7,165,764 | 1,052,428 |
| Events in quadrant C | 7,434,714 | 1,054,124 |
| Events in quadrant D | 8,871,733 | 1,015,167 |
| Mode M9 | |||
|---|---|---|---|
| Quadrant | BADHDUFLAG | Total packets | Discarded packets |
| A | 0 | 17 | 0 |
| B | 0 | 17 | 0 |
| C | 0 | 17 | 0 |
| D | 0 | 17 | 0 |
| Mode M0 | |||
|---|---|---|---|
| Quadrant | BADHDUFLAG | Total packets | Discarded packets |
| A | 0 | 30130 | 4 |
| B | 0 | 30878 | 3 |
| C | 0 | 31812 | 3 |
| D | 0 | 36246 | 3 |
| Mode SS | |||
|---|---|---|---|
| Quadrant | BADHDUFLAG | Total packets | Discarded packets |
| A | 0 | 290 | 0 |
| B | 0 | 290 | 0 |
| C | 0 | 290 | 0 |
| D | 0 | 290 | 0 |
| Quadrant | Total seconds | Saturated seconds | Saturation percentage |
|---|---|---|---|
| A | 14154 | 117 | 0.826621% |
| B | 14154 | 186 | 1.314116% |
| C | 14154 | 234 | 1.653243% |
| D | 14154 | 440 | 3.108662% |
Noise dominated data is calculated using 1-second bins in cleaned event files. If a bin has >2000 counts, and if more than 50% of those come from <1% of pixels, then it is considered to be noise-dominated and hence unusable.
| Quadrant | # 1 sec bins | Bins with >0 counts | Bins with >2000 counts | High rate bins dominated by noise | Noise dominated (total time) | Noise dominated (detector-on time) | Marked lightcurve |
|---|---|---|---|---|---|---|---|
| A | 15884 | 14157 | 13 | 13 | 0.08% | 0.09% | 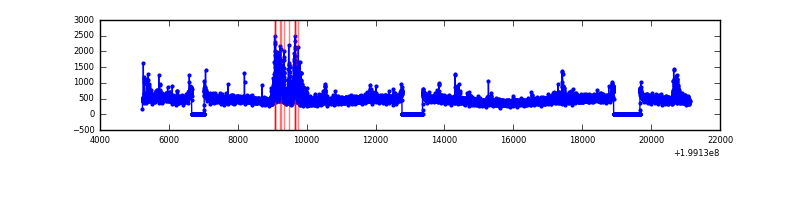 |
| B | 15884 | 14157 | 45 | 45 | 0.28% | 0.32% | 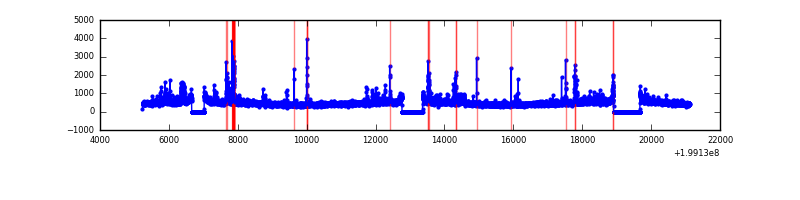 |
| C | 15884 | 14157 | 126 | 126 | 0.79% | 0.89% | 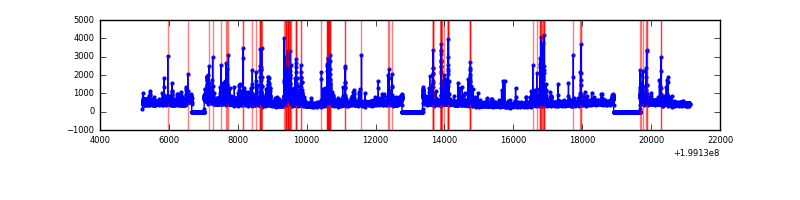 |
| D | 15884 | 14157 | 229 | 229 | 1.44% | 1.62% | 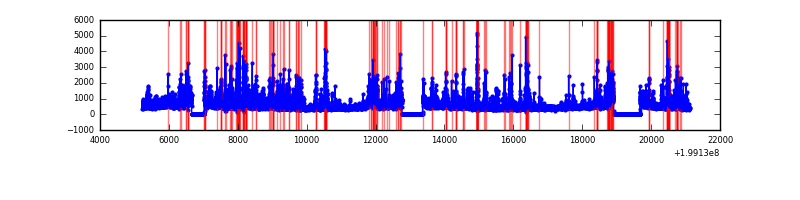 |
Top three noisy pixels from each quadrant. If the there are fewer than three noisy pixels in the level2.evt file, extra rows are filled as -1
| Pixel properties | Quadrant properties | ||||||
|---|---|---|---|---|---|---|---|
| Quadrant | DetID | PixID | Counts | Sigma | Mean | Median | Sigma |
| A | 0 | 50 | 511901 | 1532.16 | 1636 | 1604 | 333.1 |
| A | 8 | 15 | 52893 | 153.99 | 1636 | 1604 | 333.1 |
| A | 13 | 251 | 31565 | 89.96 | 1636 | 1604 | 333.1 |
| B | 0 | 219 | 213573 | 671.62 | 1651 | 1616 | 315.6 |
| B | 15 | 204 | 207079 | 651.04 | 1651 | 1616 | 315.6 |
| B | 2 | 249 | 92498 | 287.97 | 1651 | 1616 | 315.6 |
| C | 14 | 223 | 662989 | 1796.05 | 1582 | 1592 | 368.3 |
| C | 2 | 247 | 185289 | 498.84 | 1582 | 1592 | 368.3 |
| C | 1 | 16 | 154672 | 415.69 | 1582 | 1592 | 368.3 |
| D | 1 | 7 | 1347612 | 3233.53 | 1552 | 1517 | 416.3 |
| D | 13 | 114 | 436396 | 1044.65 | 1552 | 1517 | 416.3 |
| D | 2 | 136 | 413467 | 989.57 | 1552 | 1517 | 416.3 |
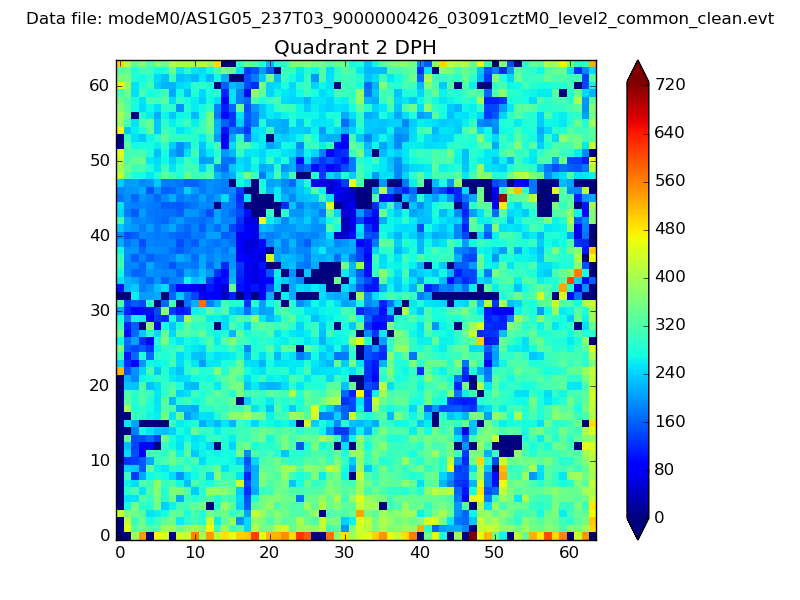
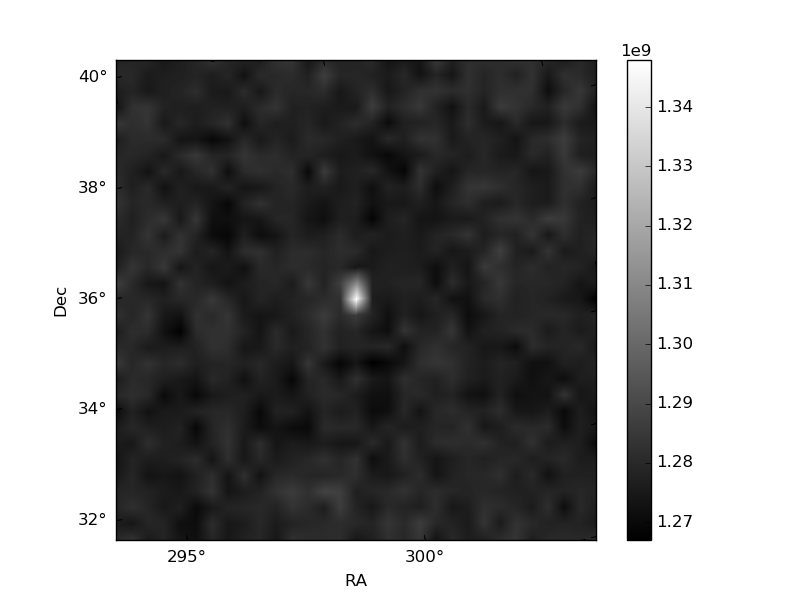
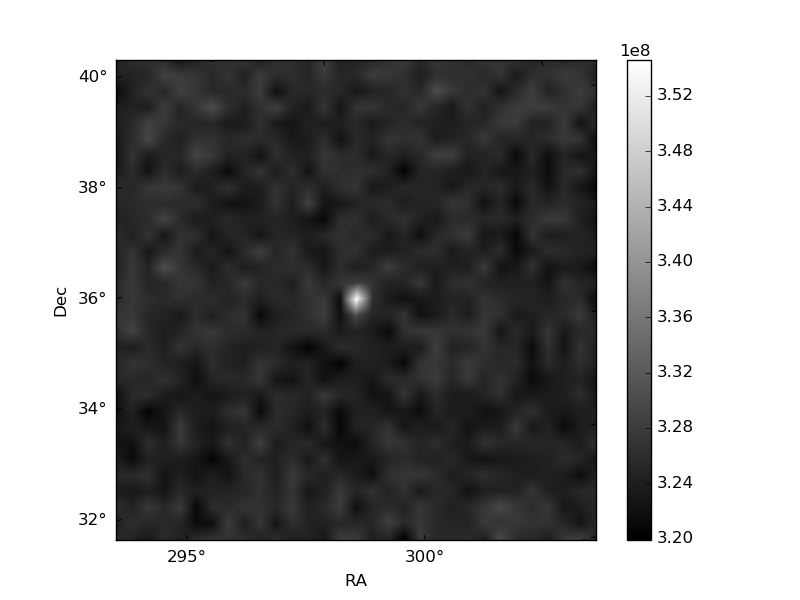
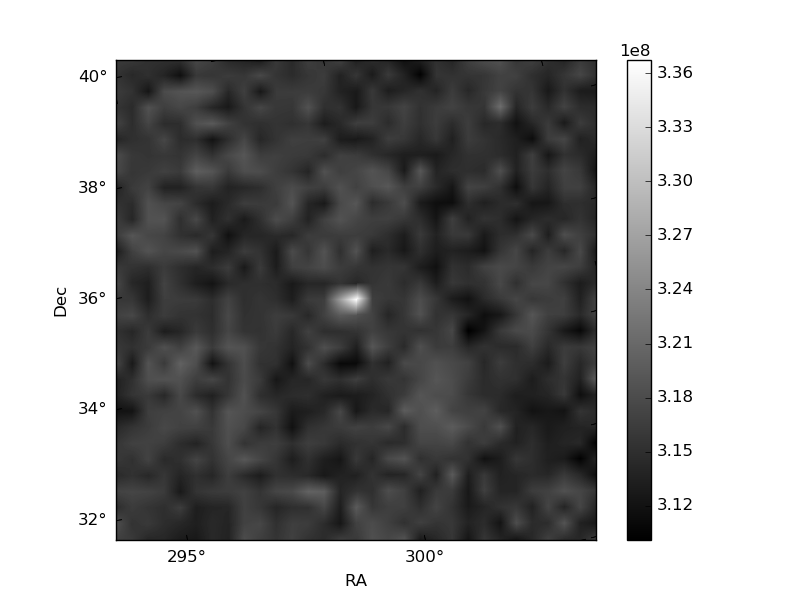
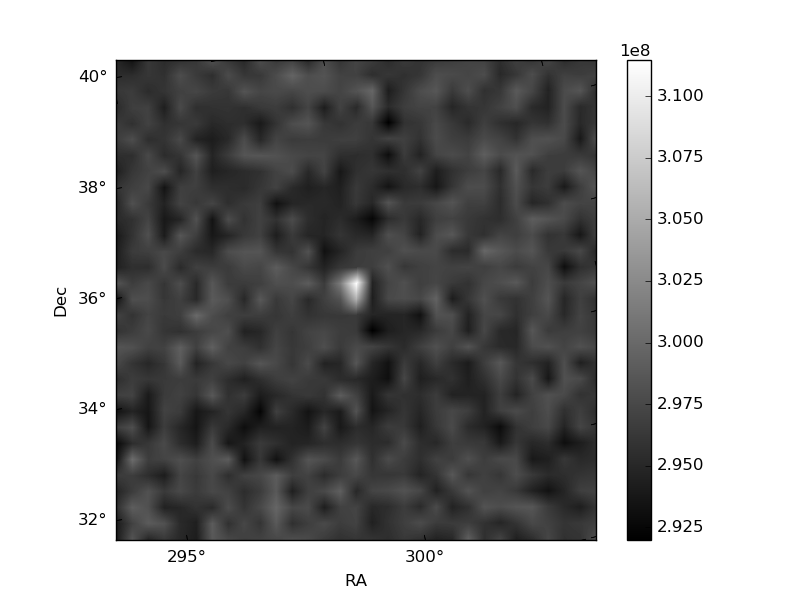
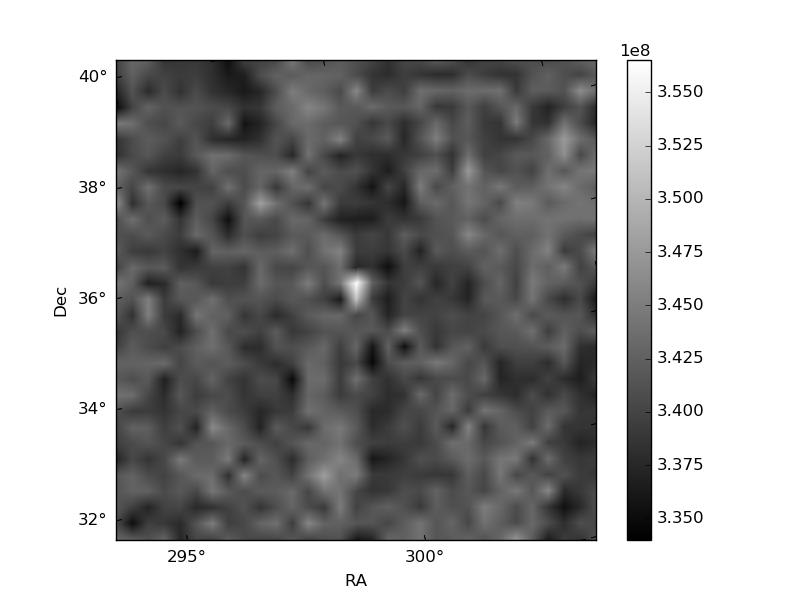
Histogram calculated using DETX and DETY for each event in the final _common_clean file
| Quadrant A | 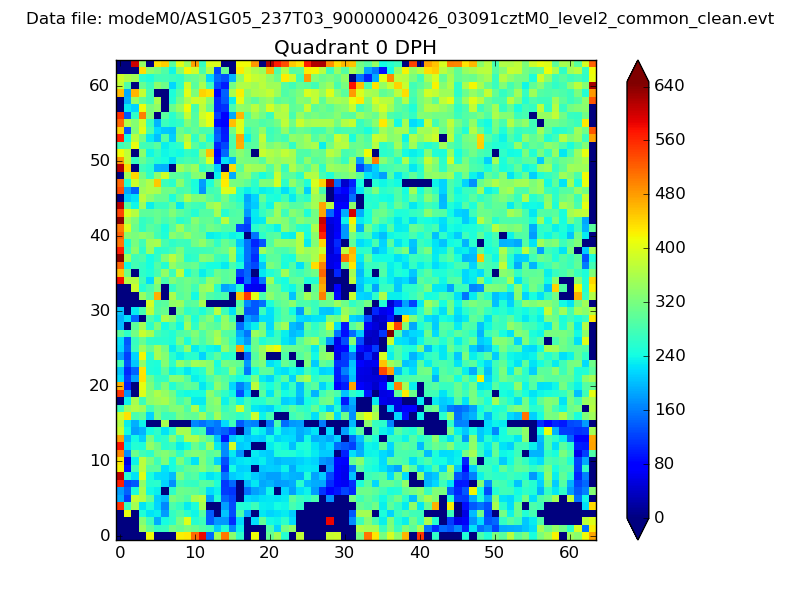 |
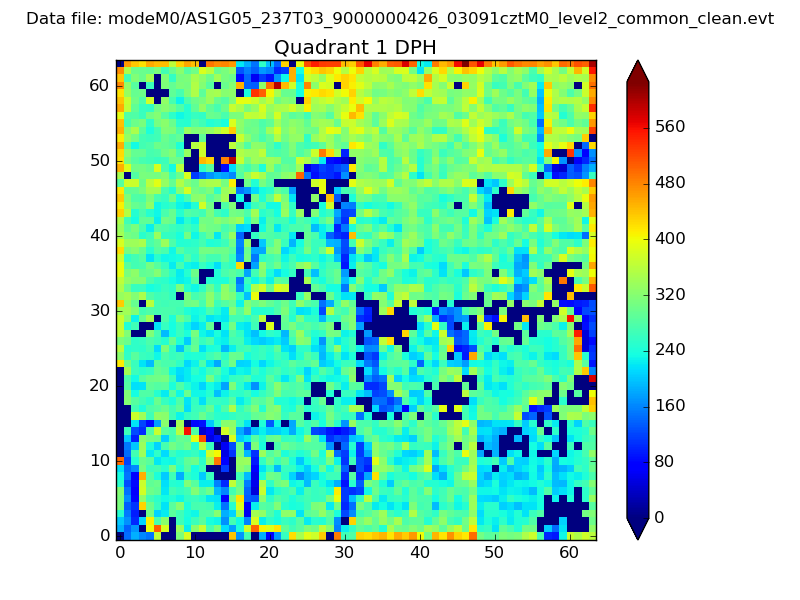 |
Quadrant B |
|---|---|---|---|
| Quadrant D | 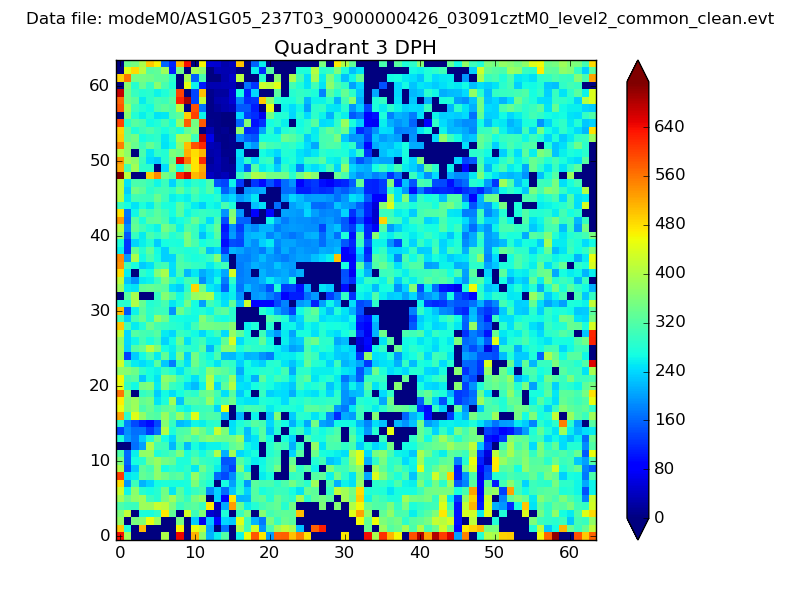 |
 |
Quadrant C |
| Plot type | Count rate plots | Images |
|---|---|---|
| Comparison with Poisson distribution Blue bars denote a histogram of data divided into 1 sec bins. Red curve is a Poisson curve with rate = median count rate of data. |
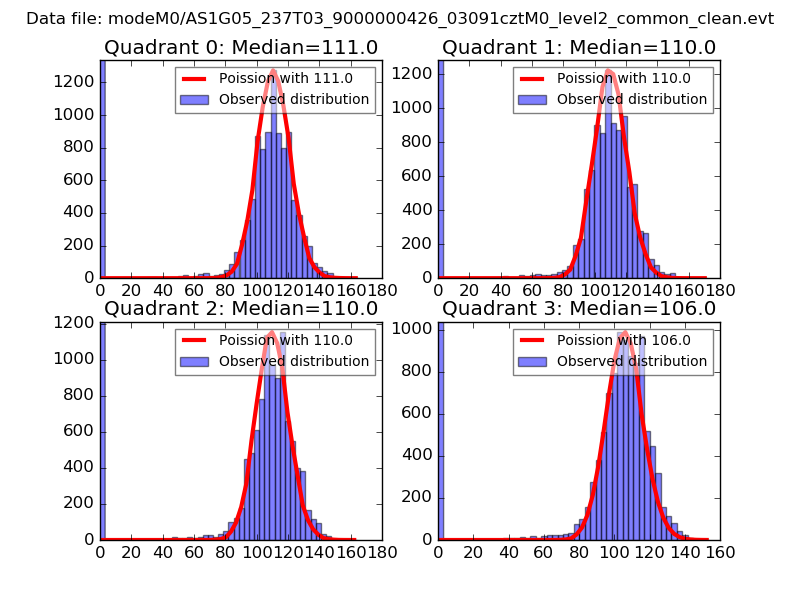 |
 |
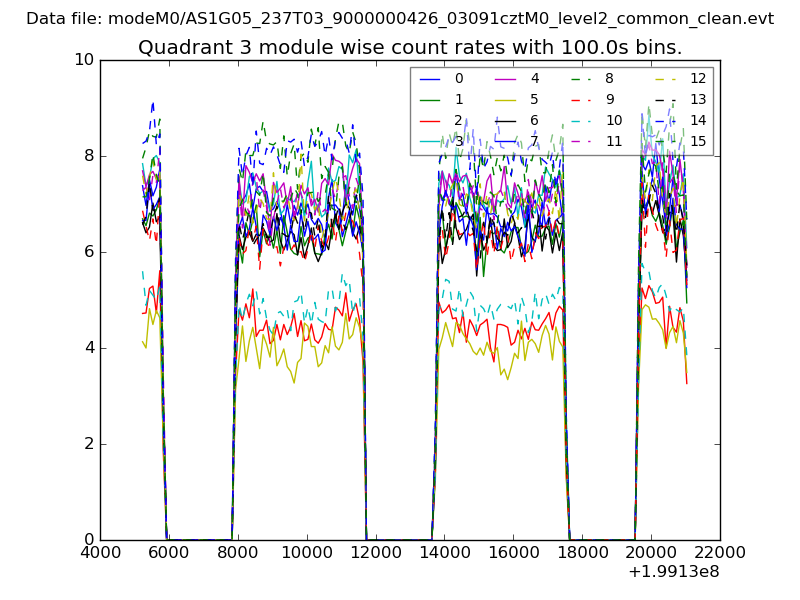
| Quadrant-wise count rates Data is divided into 100 sec bins |
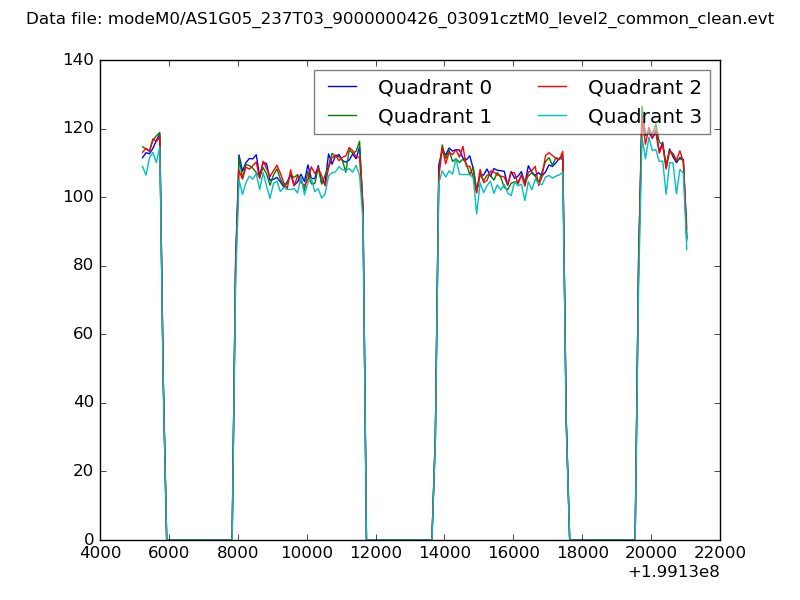 |
|
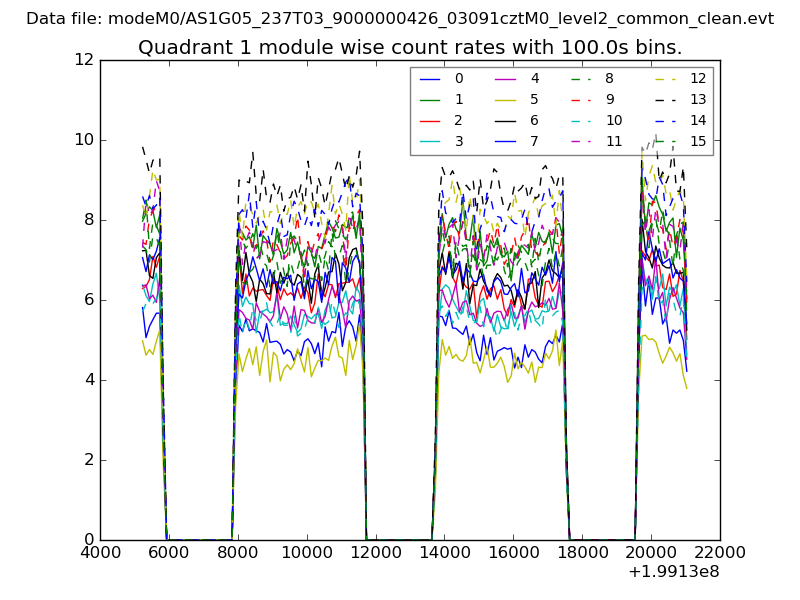
| Module-wise count rates for Quadrant A Data is divided into 100 sec bins |
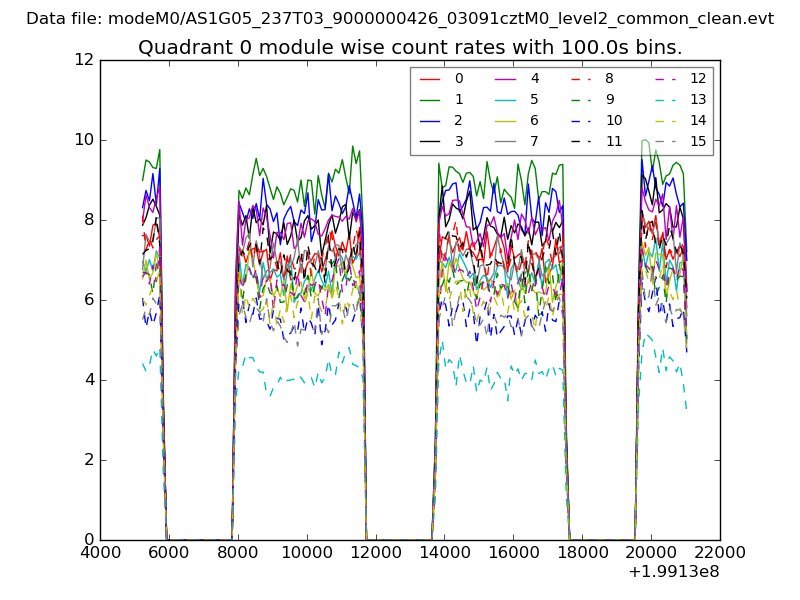 |
 |
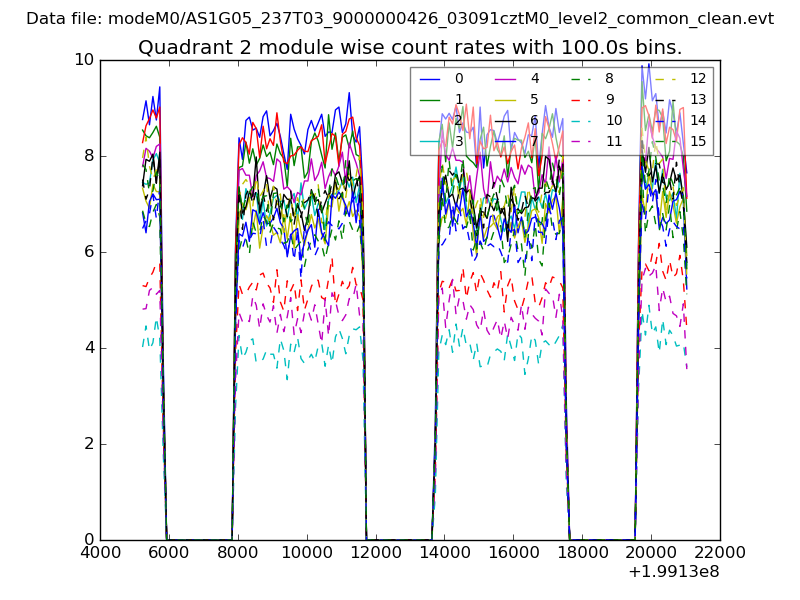
| Module-wise count rates for Quadrant B Data is divided into 100 sec bins |
 |
 |
| Module-wise count rates for Quadrant C Data is divided into 100 sec bins |
 |
 |
| Module-wise count rates for Quadrant D Data is divided into 100 sec bins |
 |
 |
| Parameter | Plot |
|---|---|
| CZT HV Monitor | 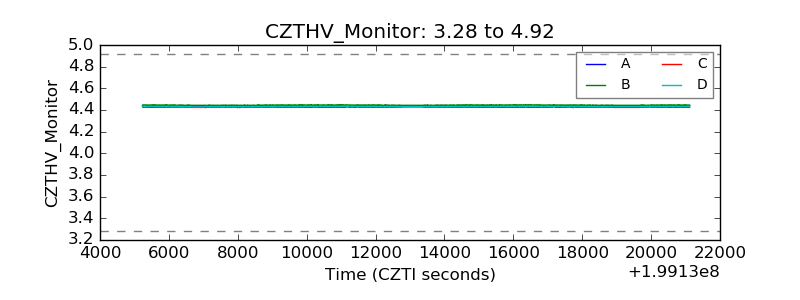 |
| D_VDD | 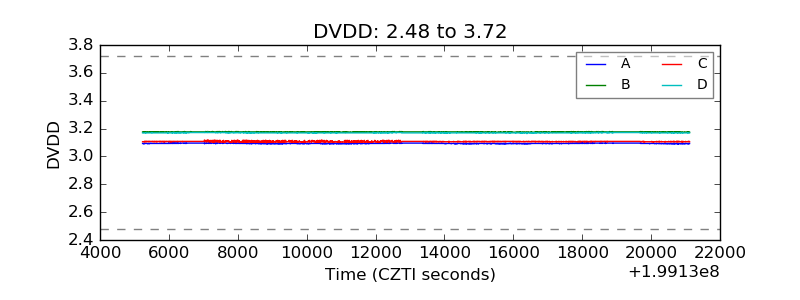 |
| Temperature 1 | 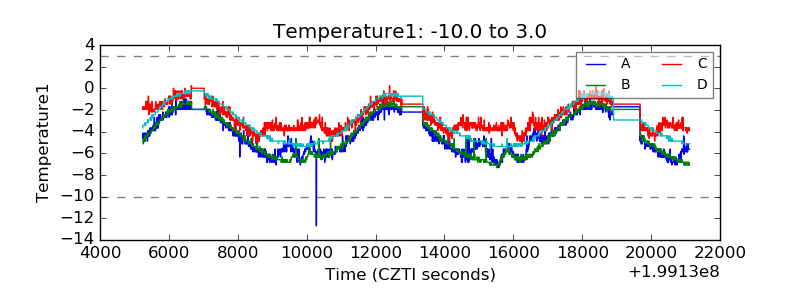 |
| Veto HV Monitor | 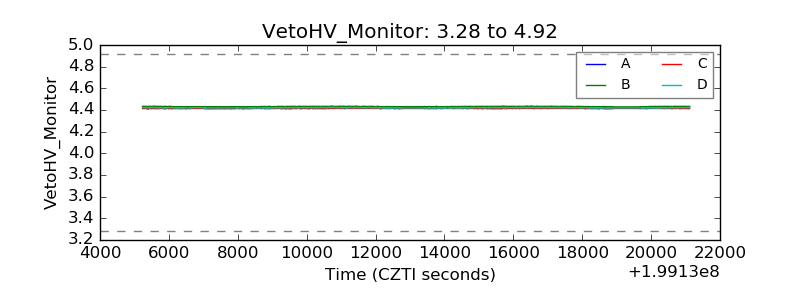 |
| Veto LLD | 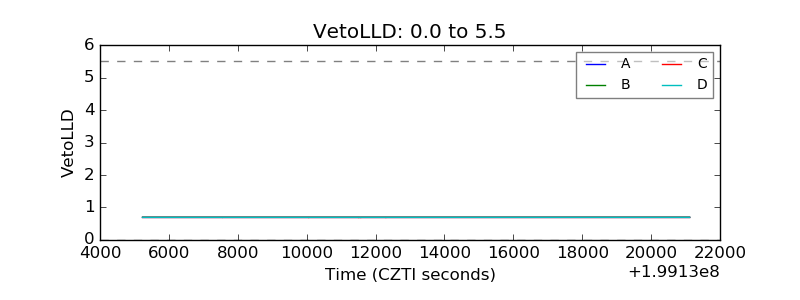 |
| Alpha Counter | 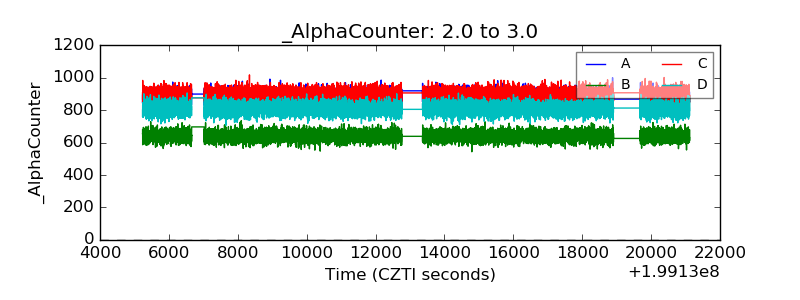 |
| _CPM_Rate | 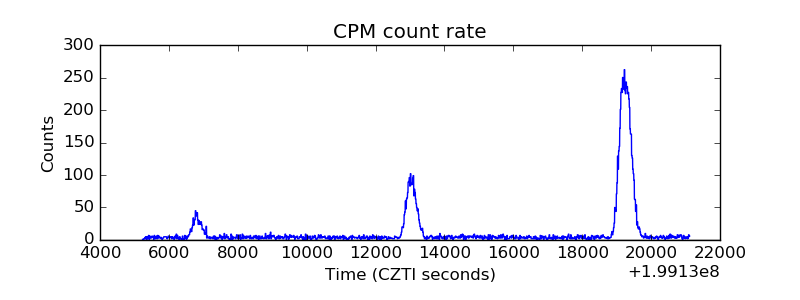 |
| CZT Counter | 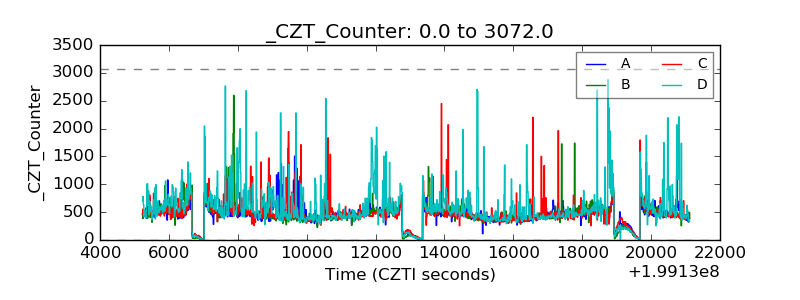 |
| +2.5 Volts monitor |  |
| +5 Volts monitor | 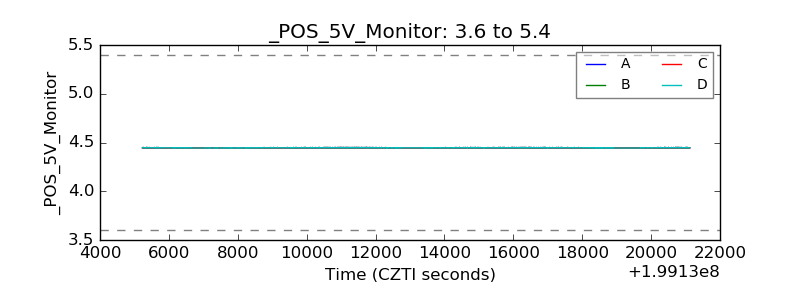 |
| Veto Counter | 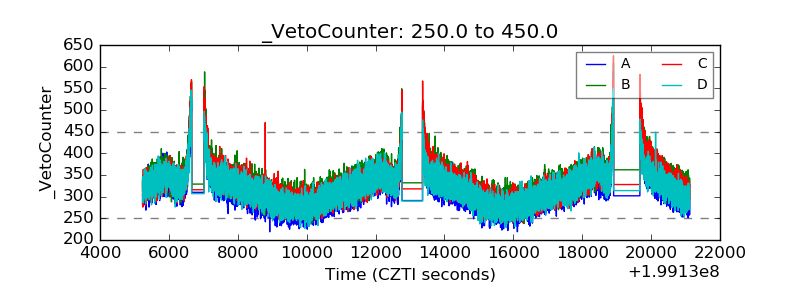 |