| Param | Original file | Final file |
|---|---|---|
| Filename | modeM0/AS1G05_237T03_9000000426_03092cztM0_level2.evt | modeM0/AS1G05_237T03_9000000426_03092cztM0_level2_quad_clean.evt |
| Size (bytes) | 527,794,560 | 91,823,040 |
| Size | 503.3 MB | 87.6 MB |
| Events in quadrant A | 3,281,460 | 579,692 |
| Events in quadrant B | 3,467,252 | 582,802 |
| Events in quadrant C | 3,643,537 | 579,988 |
| Events in quadrant D | 5,116,296 | 549,991 |
| Mode M9 | |||
|---|---|---|---|
| Quadrant | BADHDUFLAG | Total packets | Discarded packets |
| A | 0 | 16 | 0 |
| B | 0 | 16 | 0 |
| C | 0 | 16 | 0 |
| D | 0 | 16 | 0 |
| Mode M0 | |||
|---|---|---|---|
| Quadrant | BADHDUFLAG | Total packets | Discarded packets |
| A | 0 | 14605 | 3 |
| B | 0 | 15117 | 2 |
| C | 0 | 15757 | 2 |
| D | 0 | 20274 | 2 |
| Mode SS | |||
|---|---|---|---|
| Quadrant | BADHDUFLAG | Total packets | Discarded packets |
| A | 0 | 146 | 0 |
| B | 0 | 146 | 0 |
| C | 0 | 146 | 0 |
| D | 0 | 146 | 0 |
| Quadrant | Total seconds | Saturated seconds | Saturation percentage |
|---|---|---|---|
| A | 7004 | 47 | 0.671045% |
| B | 7004 | 61 | 0.870931% |
| C | 7004 | 133 | 1.898915% |
| D | 7004 | 524 | 7.481439% |
Noise dominated data is calculated using 1-second bins in cleaned event files. If a bin has >2000 counts, and if more than 50% of those come from <1% of pixels, then it is considered to be noise-dominated and hence unusable.
| Quadrant | # 1 sec bins | Bins with >0 counts | Bins with >2000 counts | High rate bins dominated by noise | Noise dominated (total time) | Noise dominated (detector-on time) | Marked lightcurve |
|---|---|---|---|---|---|---|---|
| A | 8699 | 7006 | 3 | 3 | 0.03% | 0.04% | 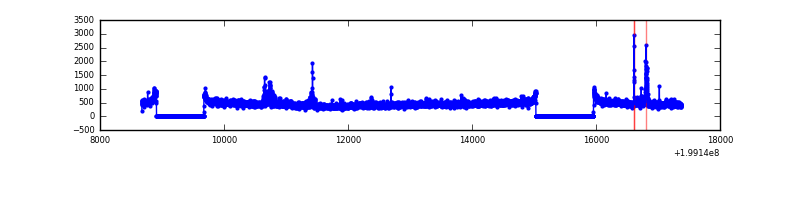 |
| B | 8699 | 7006 | 4 | 4 | 0.05% | 0.06% | 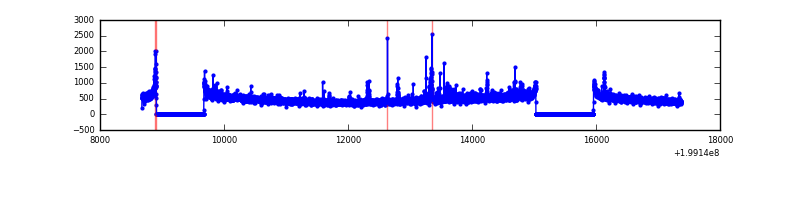 |
| C | 8699 | 7006 | 73 | 73 | 0.84% | 1.04% | 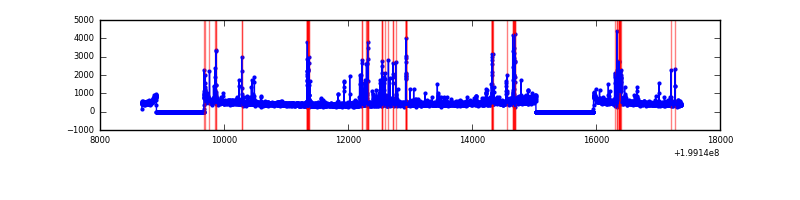 |
| D | 8699 | 7006 | 372 | 372 | 4.28% | 5.31% | 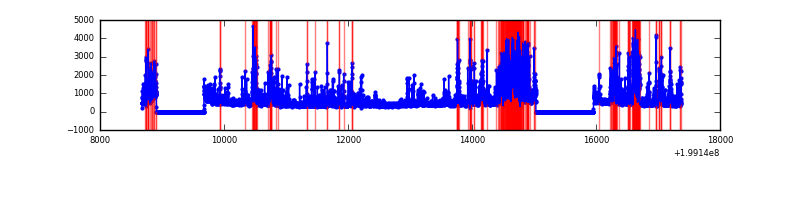 |
Top three noisy pixels from each quadrant. If the there are fewer than three noisy pixels in the level2.evt file, extra rows are filled as -1
| Pixel properties | Quadrant properties | ||||||
|---|---|---|---|---|---|---|---|
| Quadrant | DetID | PixID | Counts | Sigma | Mean | Median | Sigma |
| A | 0 | 50 | 102345 | 614.73 | 804 | 788 | 165.2 |
| A | 12 | 247 | 55452 | 330.88 | 804 | 788 | 165.2 |
| A | 8 | 15 | 15522 | 89.19 | 804 | 788 | 165.2 |
| B | 15 | 204 | 134138 | 846.63 | 819 | 801 | 157.5 |
| B | 0 | 219 | 57015 | 356.93 | 819 | 801 | 157.5 |
| B | 2 | 249 | 28760 | 177.53 | 819 | 801 | 157.5 |
| C | 14 | 223 | 234430 | 1271.47 | 781 | 788 | 183.8 |
| C | 1 | 16 | 135668 | 734.01 | 781 | 788 | 183.8 |
| C | 1 | 192 | 91706 | 494.77 | 781 | 788 | 183.8 |
| D | 1 | 7 | 1226505 | 6532.39 | 755 | 732 | 187.6 |
| D | 1 | 193 | 483957 | 2575.2 | 755 | 732 | 187.6 |
| D | 2 | 136 | 269012 | 1429.72 | 755 | 732 | 187.6 |
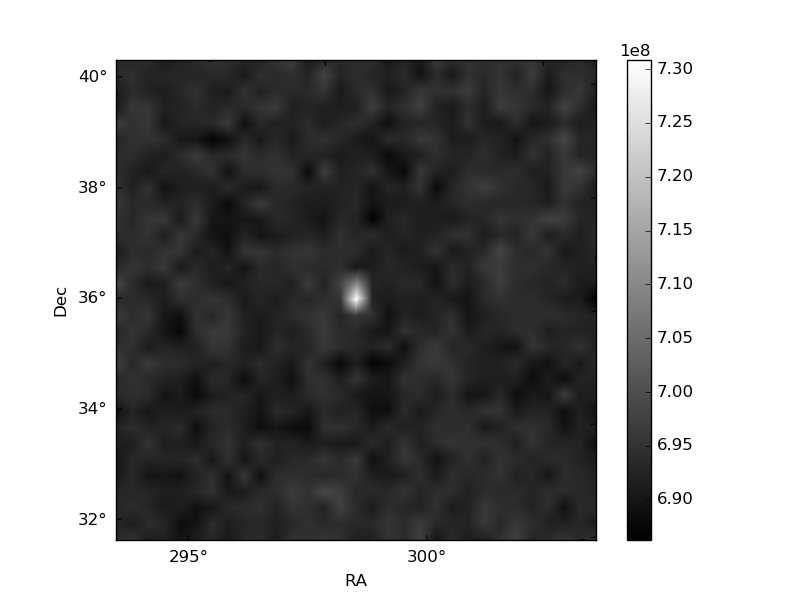
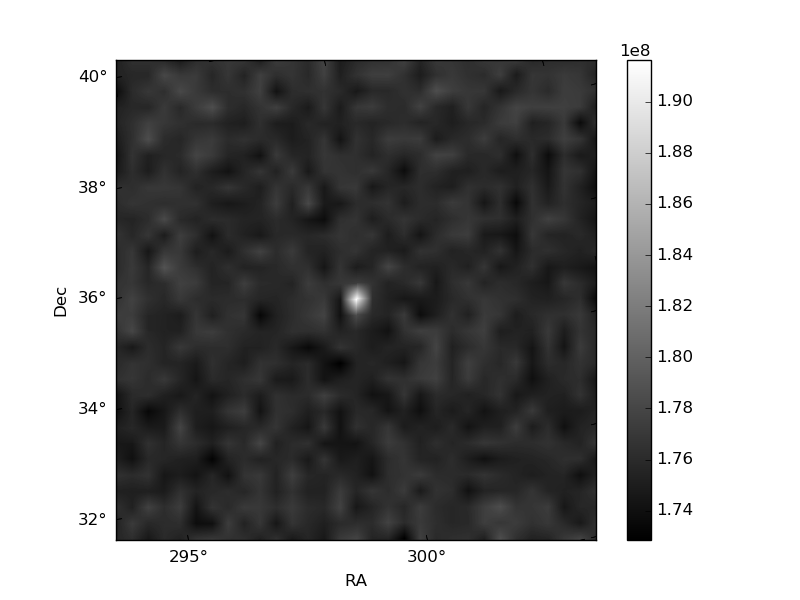
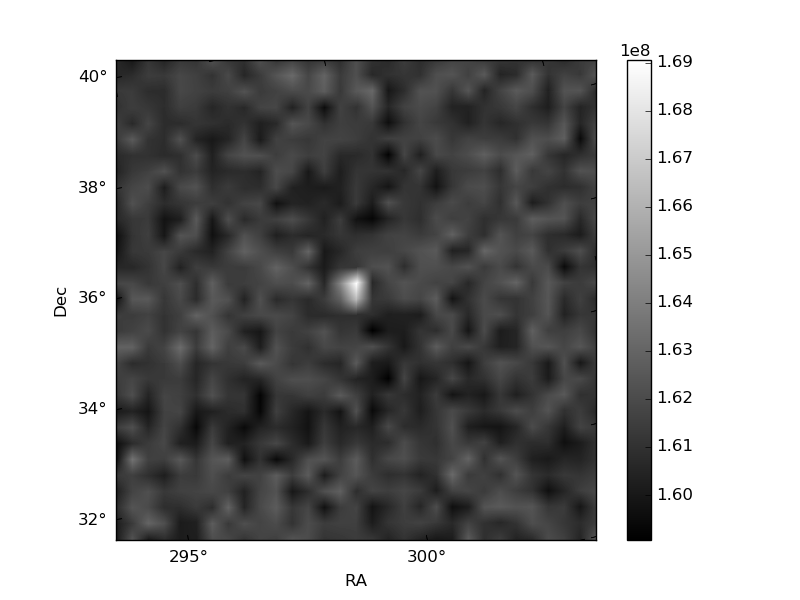
Histogram calculated using DETX and DETY for each event in the final _common_clean file
| Quadrant A | 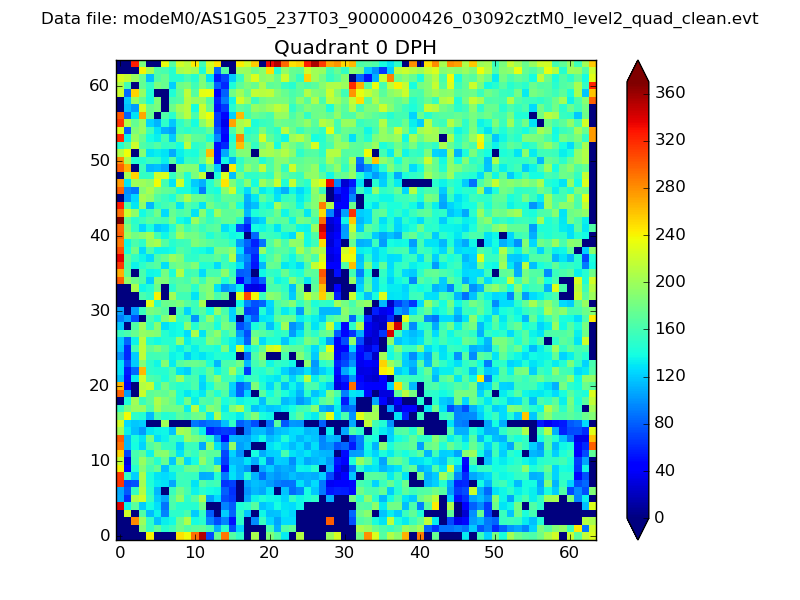 |
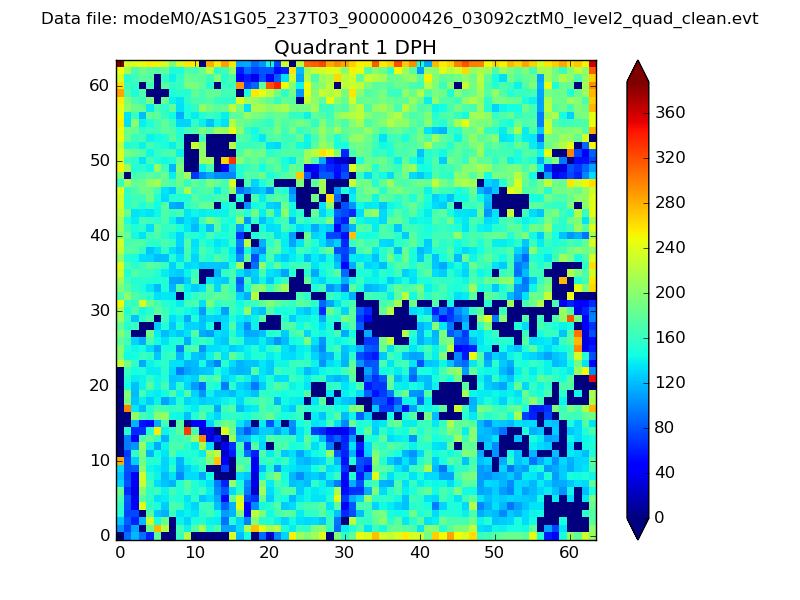 |
Quadrant B |
|---|---|---|---|
| Quadrant D | 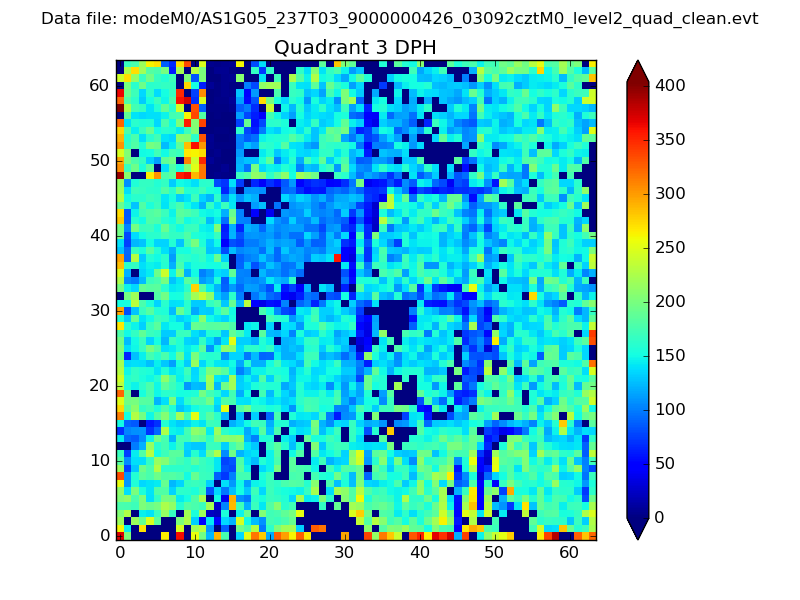 |
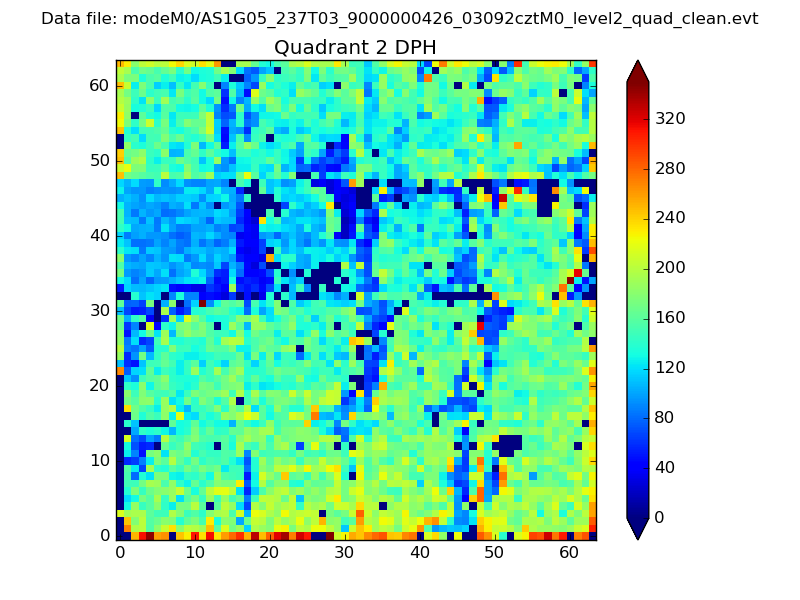 |
Quadrant C |
| Plot type | Count rate plots | Images |
|---|---|---|
| Comparison with Poisson distribution Blue bars denote a histogram of data divided into 1 sec bins. Red curve is a Poisson curve with rate = median count rate of data. |
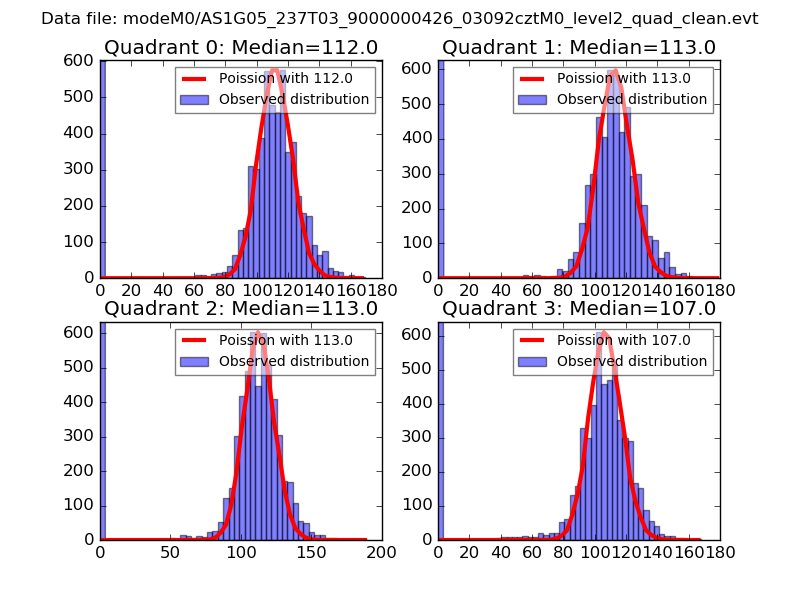 |
 |
| Quadrant-wise count rates Data is divided into 100 sec bins |
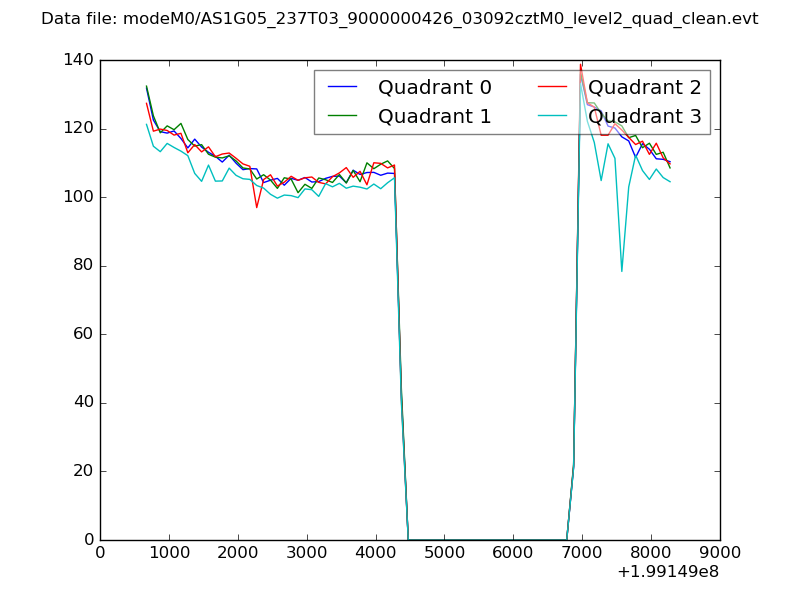 |
|
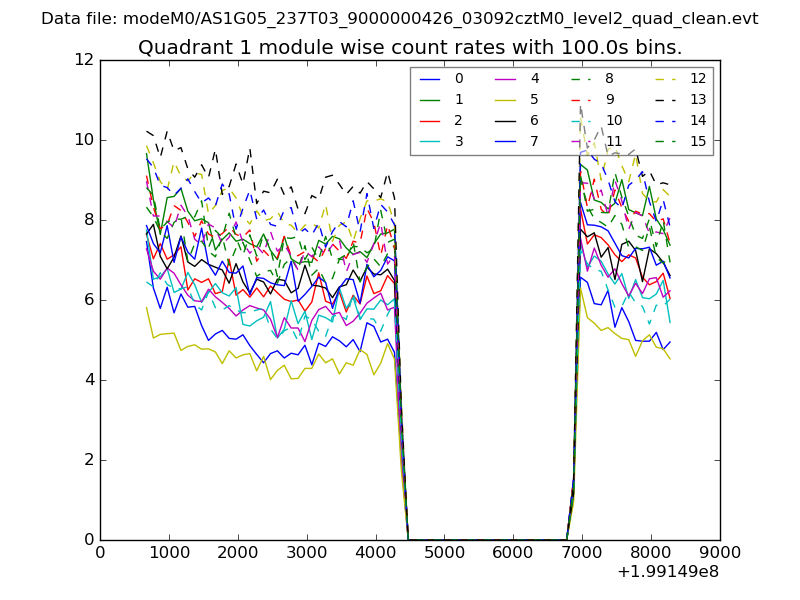
| Module-wise count rates for Quadrant A Data is divided into 100 sec bins |
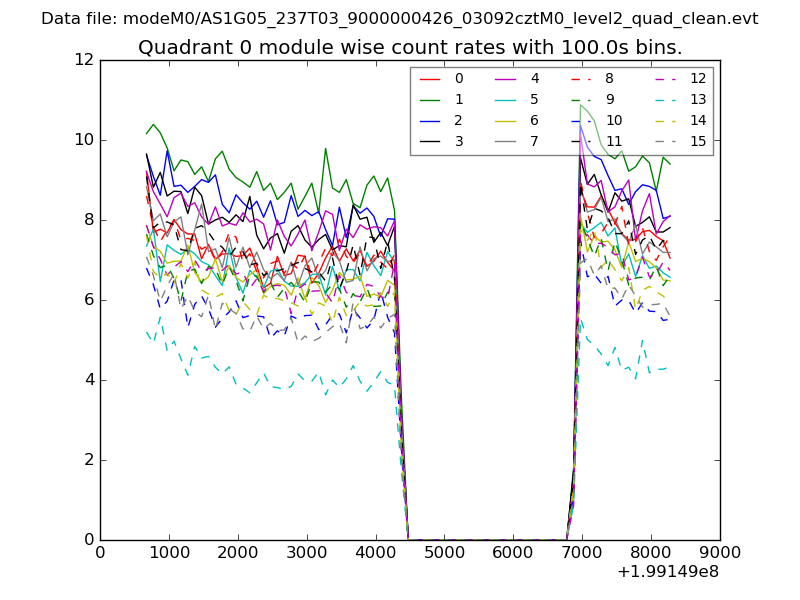 |
 |
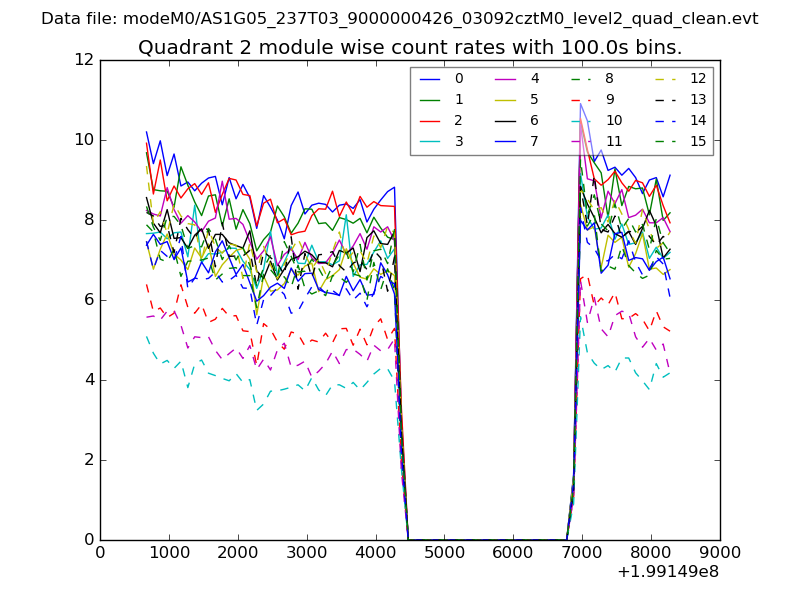
| Module-wise count rates for Quadrant B Data is divided into 100 sec bins |
 |
 |
| Module-wise count rates for Quadrant C Data is divided into 100 sec bins |
 |
 |
| Module-wise count rates for Quadrant D Data is divided into 100 sec bins |
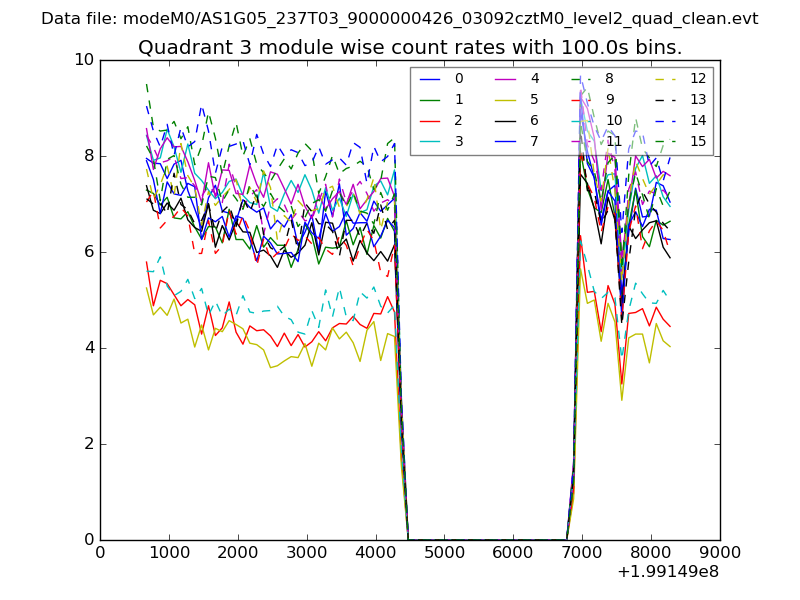 |
 |
| Parameter | Plot |
|---|---|
| CZT HV Monitor | 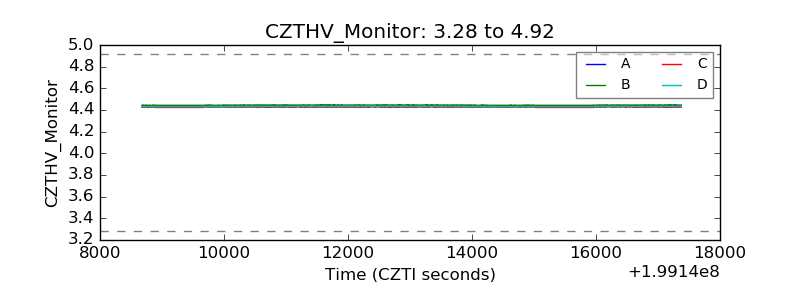 |
| D_VDD | 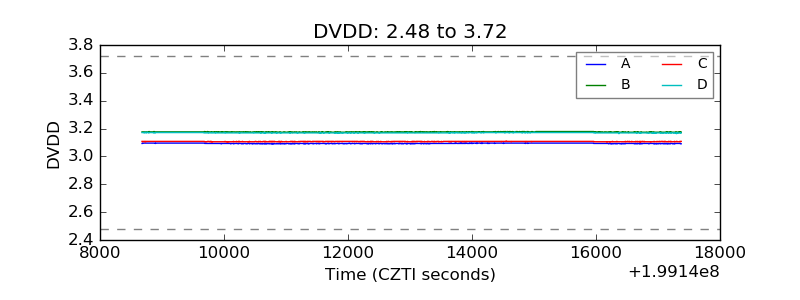 |
| Temperature 1 | 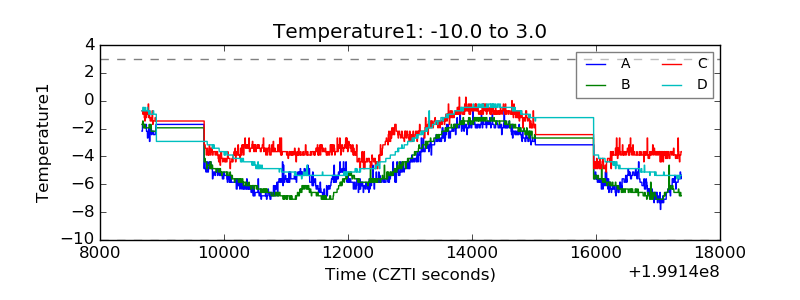 |
| Veto HV Monitor | 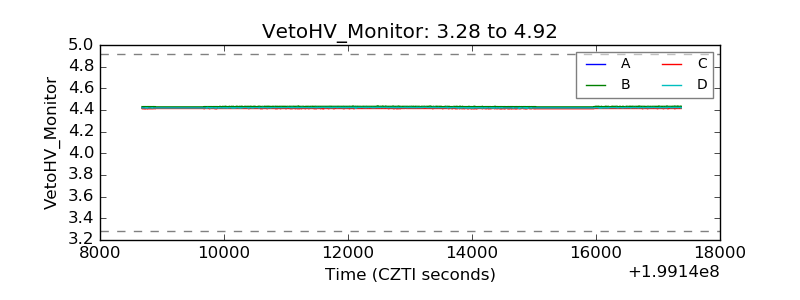 |
| Veto LLD | 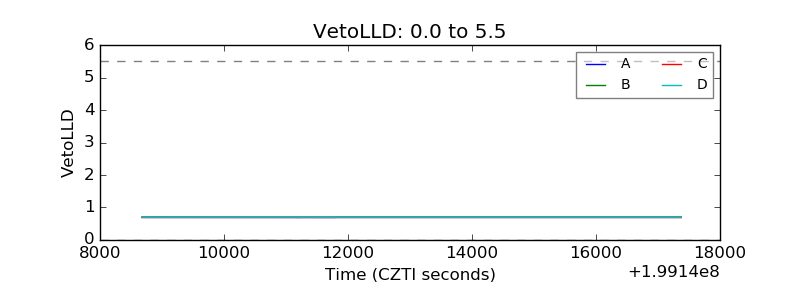 |
| Alpha Counter | 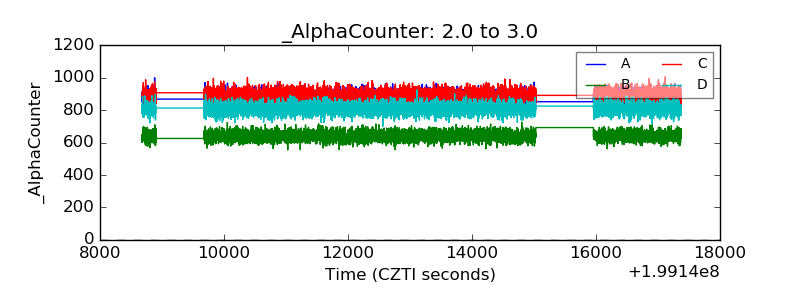 |
| _CPM_Rate | 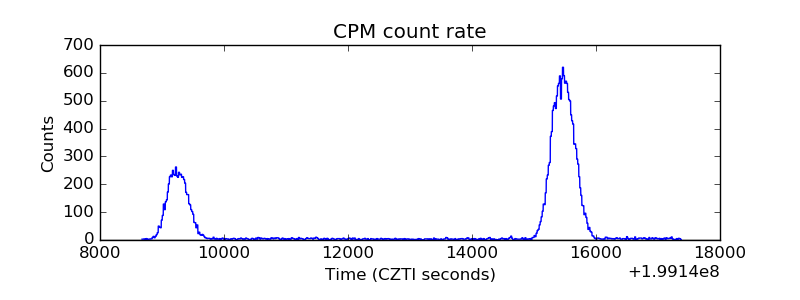 |
| CZT Counter | 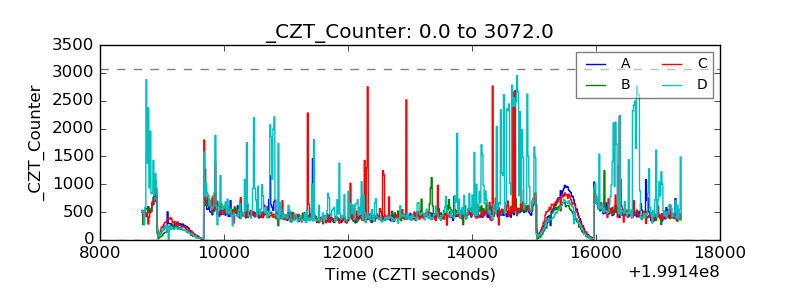 |
| +2.5 Volts monitor |  |
| +5 Volts monitor |  |
| _ROLL_ROT | 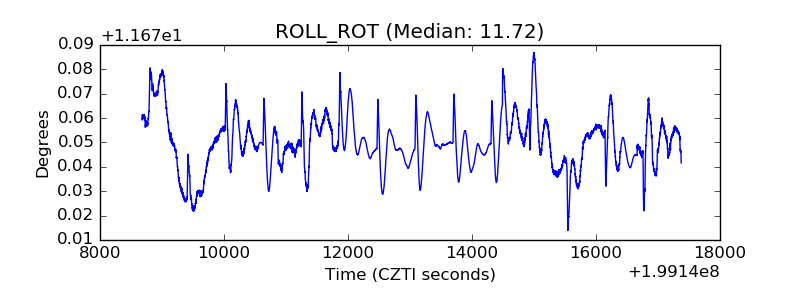 |
| _Roll_DEC | 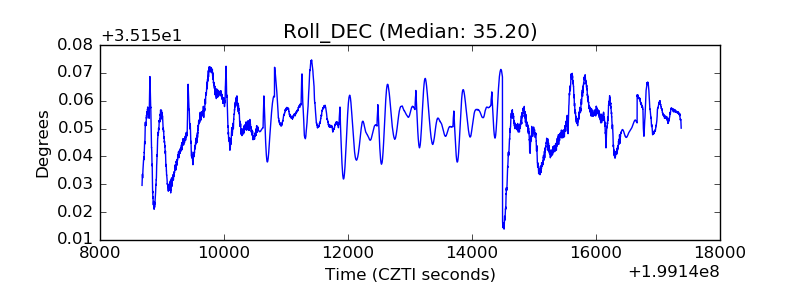 |
| _Roll_RA | 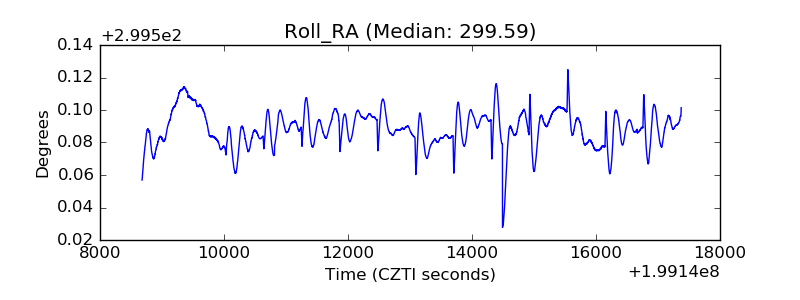 |
| Veto Counter | 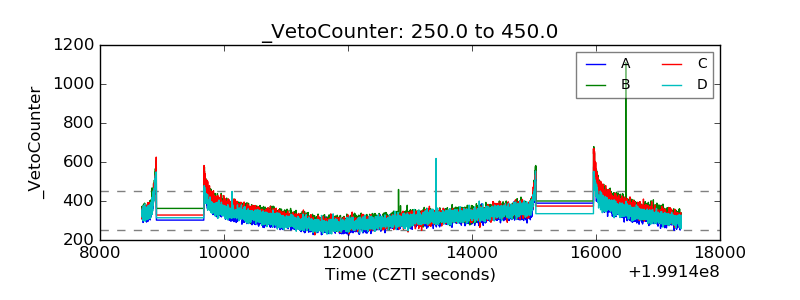 |