| Param | Original file | Final file |
|---|---|---|
| Filename | modeM0/AS1G05_237T03_9000000426_03093cztM0_level2.evt | modeM0/AS1G05_237T03_9000000426_03093cztM0_level2_quad_clean.evt |
| Size (bytes) | 487,414,080 | 85,890,240 |
| Size | 464.8 MB | 81.9 MB |
| Events in quadrant A | 3,397,896 | 540,657 |
| Events in quadrant B | 3,203,017 | 545,950 |
| Events in quadrant C | 3,421,235 | 542,601 |
| Events in quadrant D | 4,292,576 | 512,845 |
| Mode M9 | |||
|---|---|---|---|
| Quadrant | BADHDUFLAG | Total packets | Discarded packets |
| A | 0 | 15 | 0 |
| B | 0 | 15 | 0 |
| C | 0 | 15 | 0 |
| D | 0 | 16 | 0 |
| Mode M0 | |||
|---|---|---|---|
| Quadrant | BADHDUFLAG | Total packets | Discarded packets |
| A | 0 | 14560 | 3 |
| B | 0 | 14016 | 2 |
| C | 0 | 14775 | 2 |
| D | 0 | 17619 | 2 |
| Mode SS | |||
|---|---|---|---|
| Quadrant | BADHDUFLAG | Total packets | Discarded packets |
| A | 0 | 134 | 0 |
| B | 0 | 134 | 0 |
| C | 0 | 134 | 0 |
| D | 0 | 134 | 0 |
| Quadrant | Total seconds | Saturated seconds | Saturation percentage |
|---|---|---|---|
| A | 6577 | 40 | 0.608180% |
| B | 6577 | 22 | 0.334499% |
| C | 6577 | 61 | 0.927475% |
| D | 6577 | 288 | 4.378896% |
Noise dominated data is calculated using 1-second bins in cleaned event files. If a bin has >2000 counts, and if more than 50% of those come from <1% of pixels, then it is considered to be noise-dominated and hence unusable.
| Quadrant | # 1 sec bins | Bins with >0 counts | Bins with >2000 counts | High rate bins dominated by noise | Noise dominated (total time) | Noise dominated (detector-on time) | Marked lightcurve |
|---|---|---|---|---|---|---|---|
| A | 7662 | 6578 | 20 | 20 | 0.26% | 0.30% | 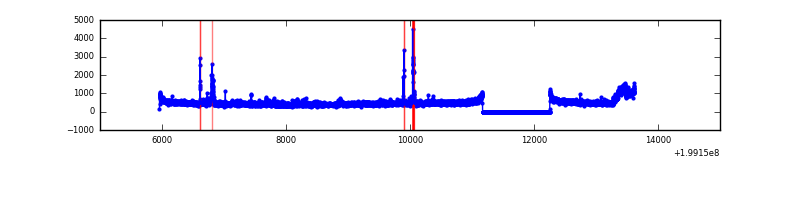 |
| B | 7662 | 6578 | 0 | 0 | 0.00% | 0.00% | 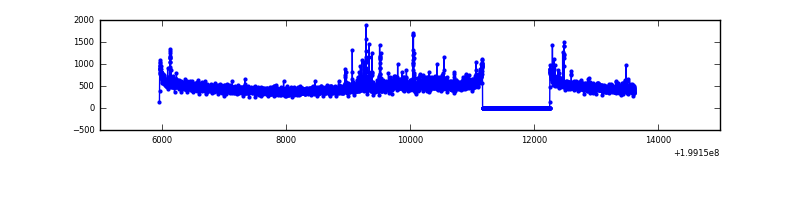 |
| C | 7662 | 6578 | 44 | 44 | 0.57% | 0.67% | 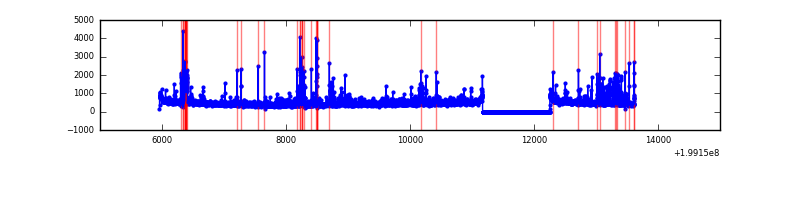 |
| D | 7662 | 6578 | 228 | 228 | 2.98% | 3.47% | 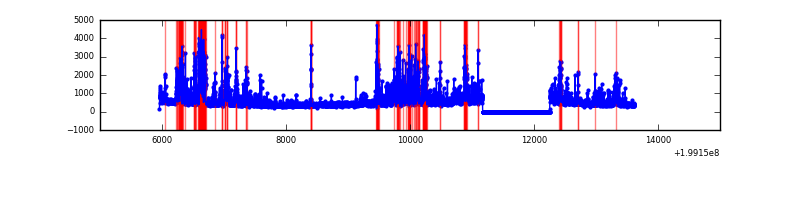 |
Top three noisy pixels from each quadrant. If the there are fewer than three noisy pixels in the level2.evt file, extra rows are filled as -1
| Pixel properties | Quadrant properties | ||||||
|---|---|---|---|---|---|---|---|
| Quadrant | DetID | PixID | Counts | Sigma | Mean | Median | Sigma |
| A | 14 | 249 | 259908 | 1695.52 | 747 | 732 | 152.9 |
| A | 8 | 15 | 150962 | 982.8 | 747 | 732 | 152.9 |
| A | 12 | 247 | 59147 | 382.15 | 747 | 732 | 152.9 |
| B | 15 | 204 | 108240 | 732.44 | 765 | 748 | 146.8 |
| B | 0 | 219 | 52814 | 354.77 | 765 | 748 | 146.8 |
| B | 15 | 85 | 19519 | 127.9 | 765 | 748 | 146.8 |
| C | 1 | 192 | 208542 | 1218.63 | 728 | 735 | 170.5 |
| C | 14 | 223 | 159064 | 928.48 | 728 | 735 | 170.5 |
| C | 1 | 16 | 85093 | 494.7 | 728 | 735 | 170.5 |
| D | 1 | 7 | 1236414 | 6643.42 | 704 | 690 | 186.0 |
| D | 2 | 136 | 184370 | 987.49 | 704 | 690 | 186.0 |
| D | 13 | 114 | 46797 | 247.88 | 704 | 690 | 186.0 |
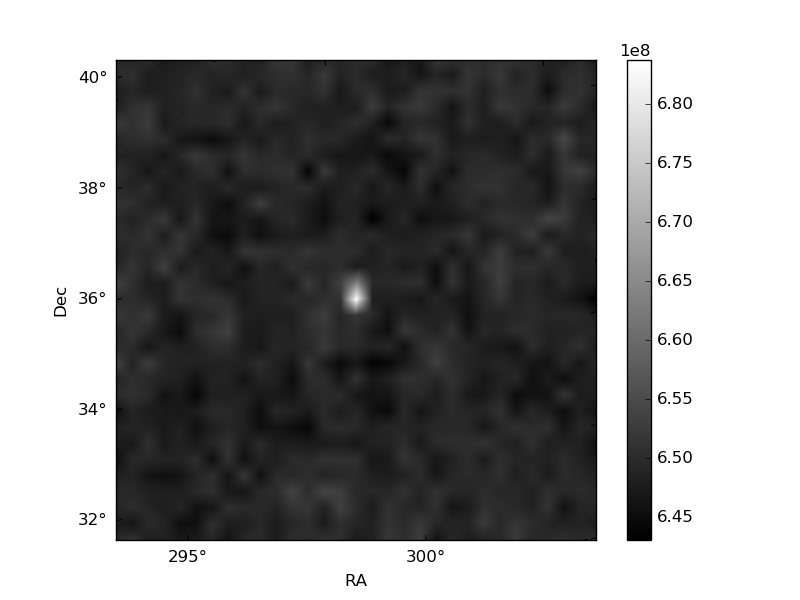
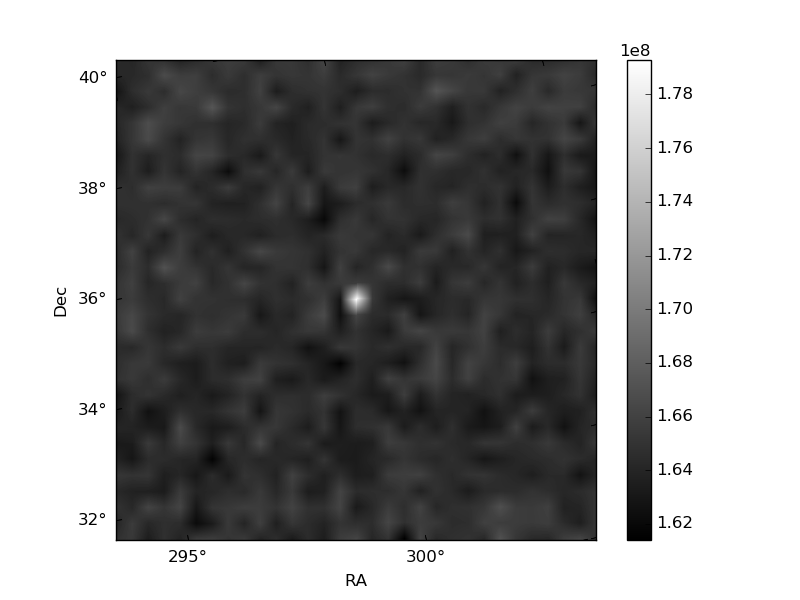
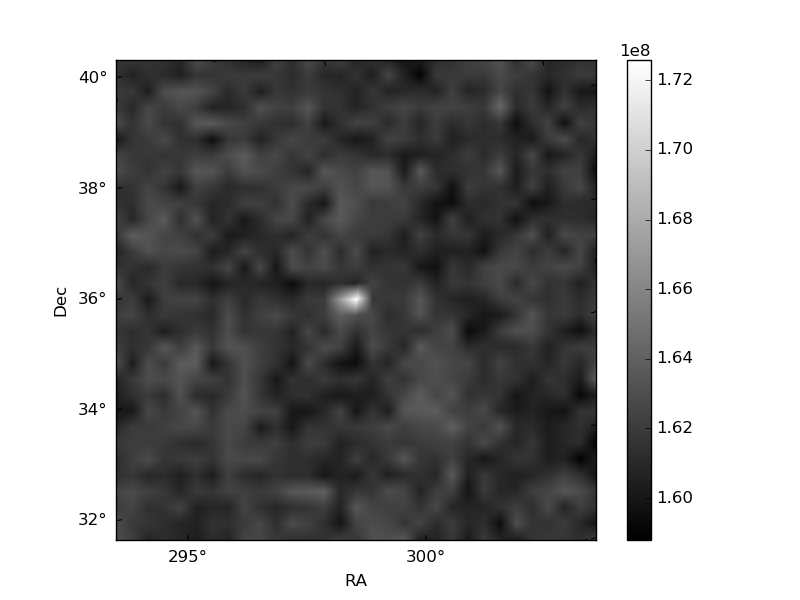
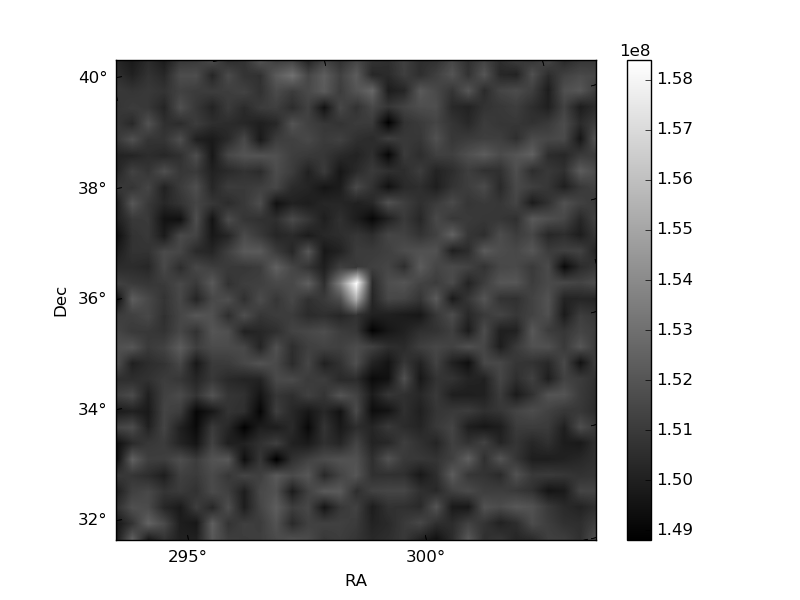
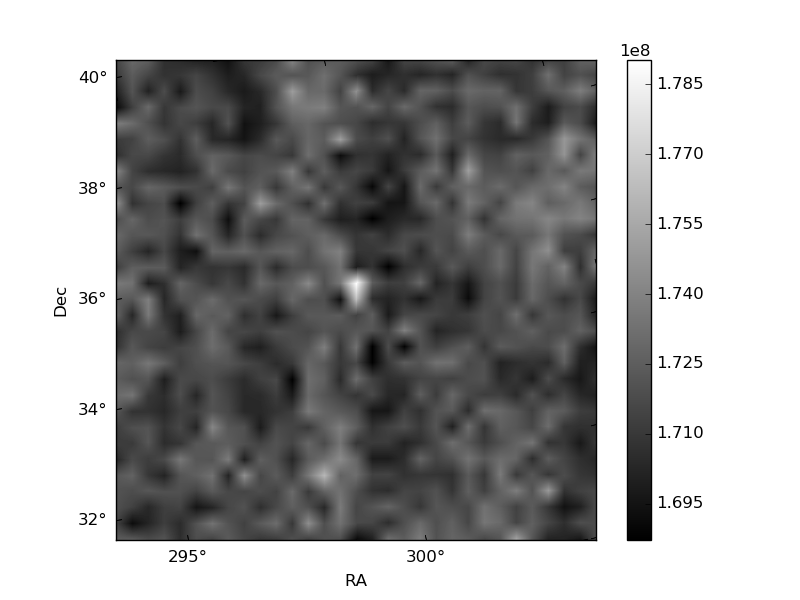
Histogram calculated using DETX and DETY for each event in the final _common_clean file
| Quadrant A | 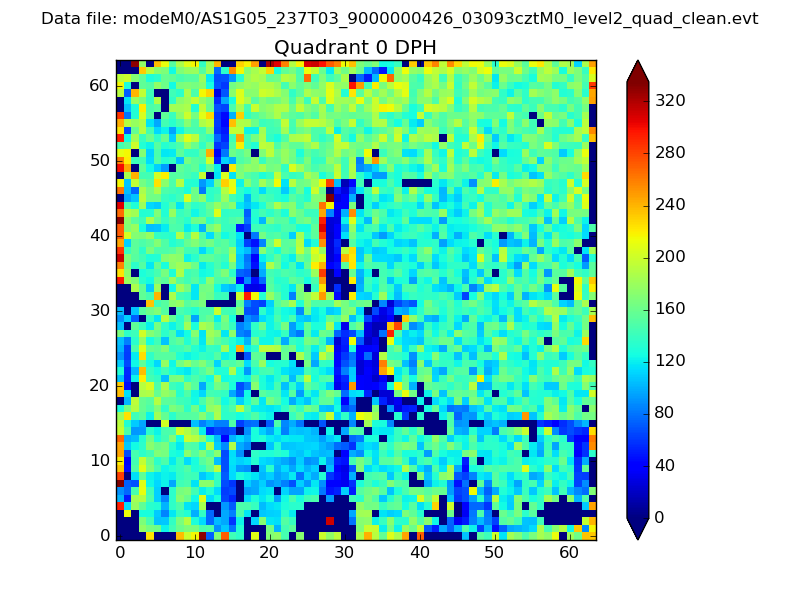 |
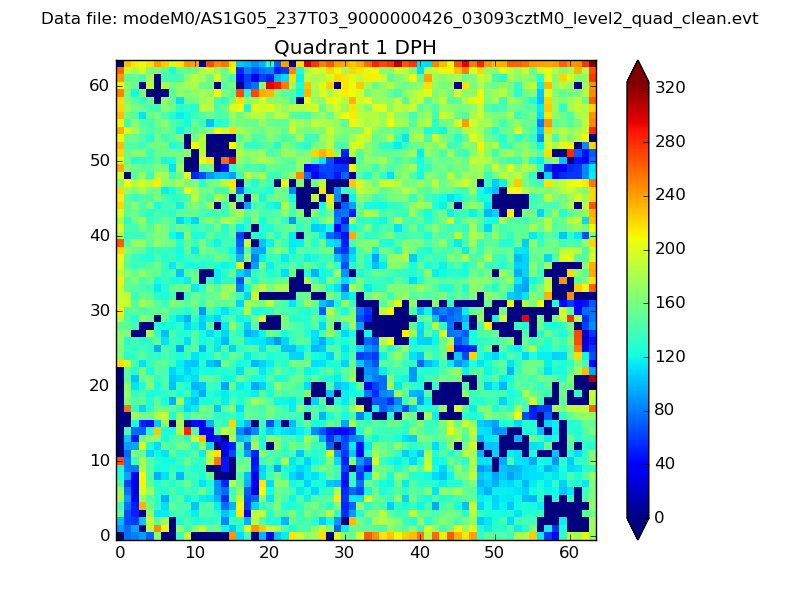 |
Quadrant B |
|---|---|---|---|
| Quadrant D | 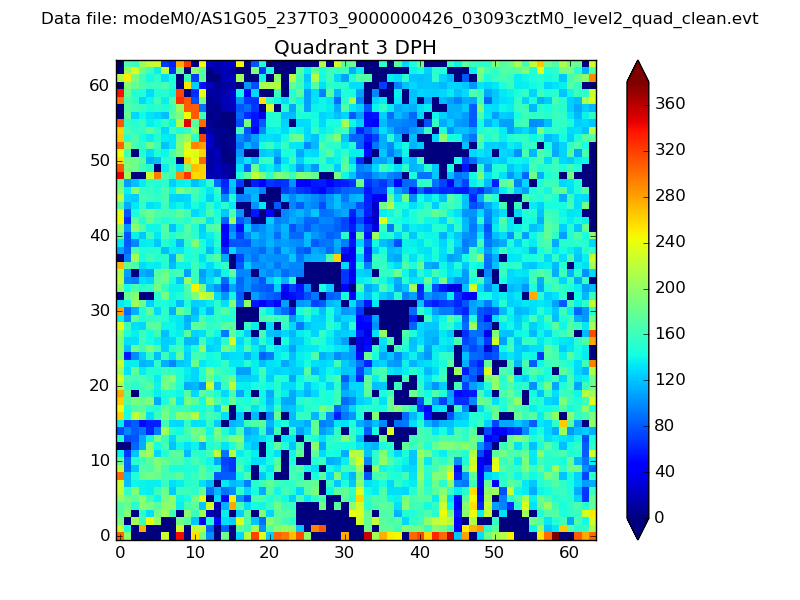 |
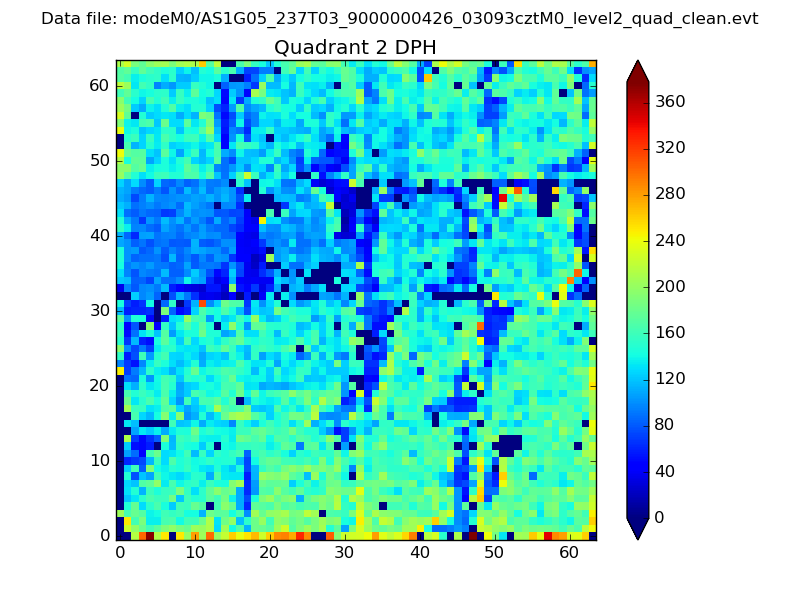 |
Quadrant C |
| Plot type | Count rate plots | Images |
|---|---|---|
| Comparison with Poisson distribution Blue bars denote a histogram of data divided into 1 sec bins. Red curve is a Poisson curve with rate = median count rate of data. |
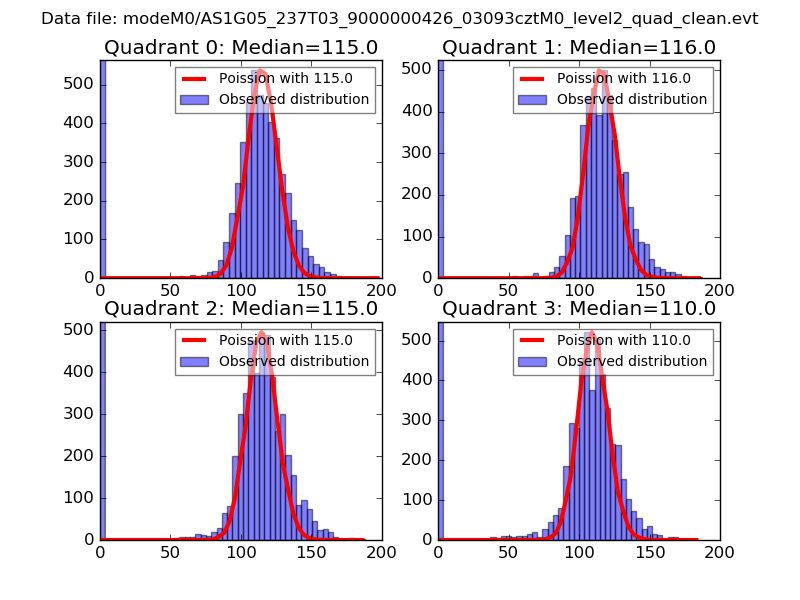 |
 |
| Quadrant-wise count rates Data is divided into 100 sec bins |
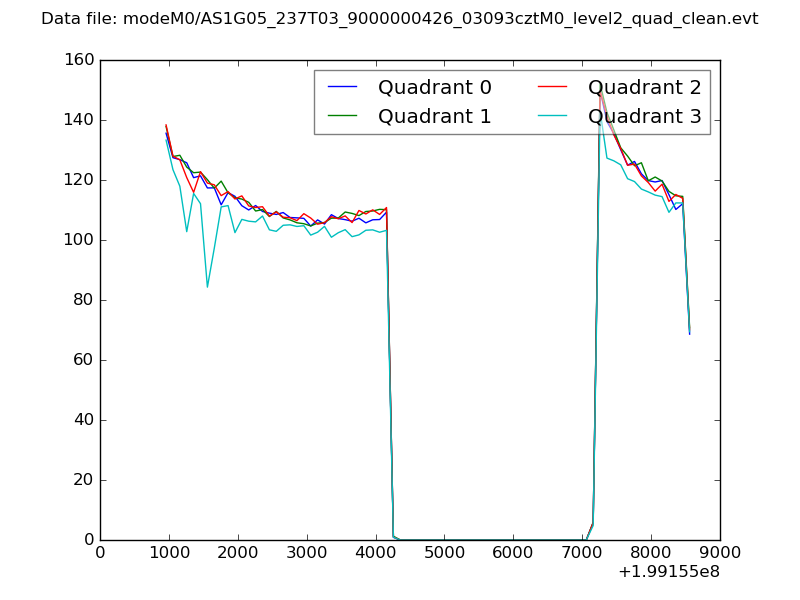 |
|
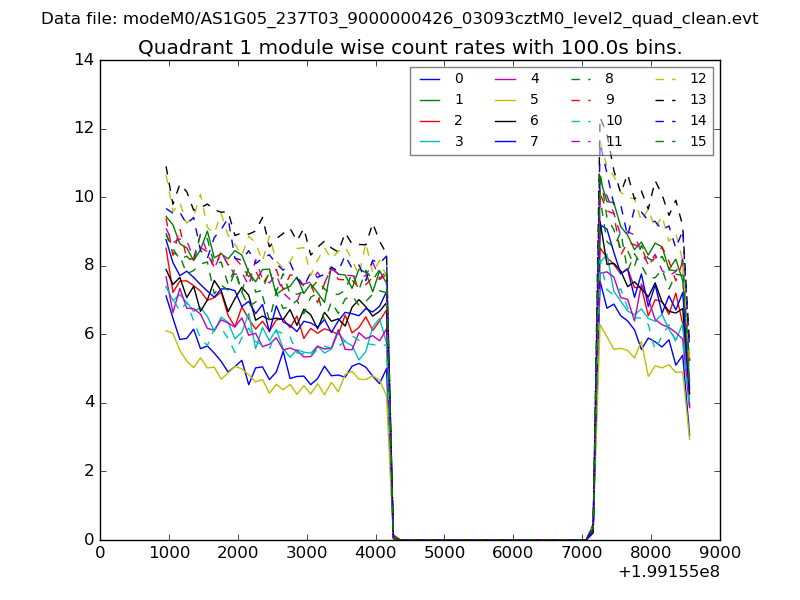
| Module-wise count rates for Quadrant A Data is divided into 100 sec bins |
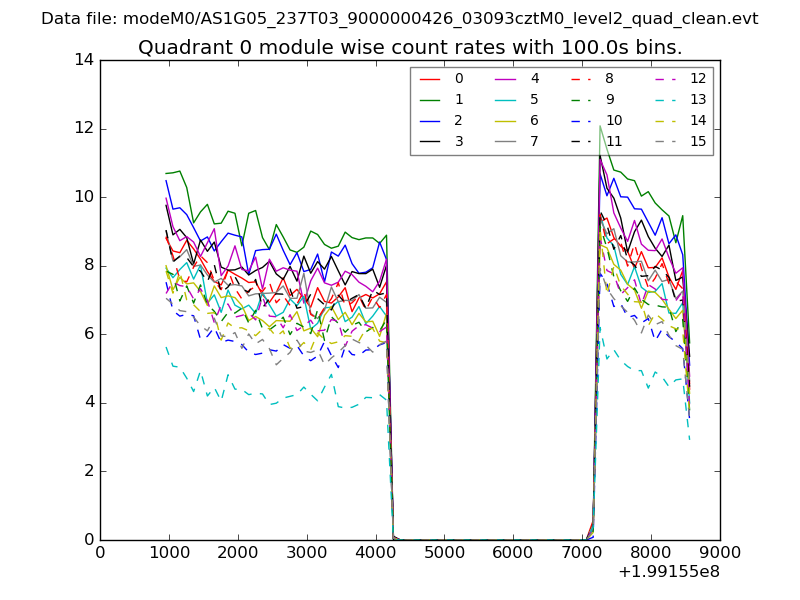 |
 |
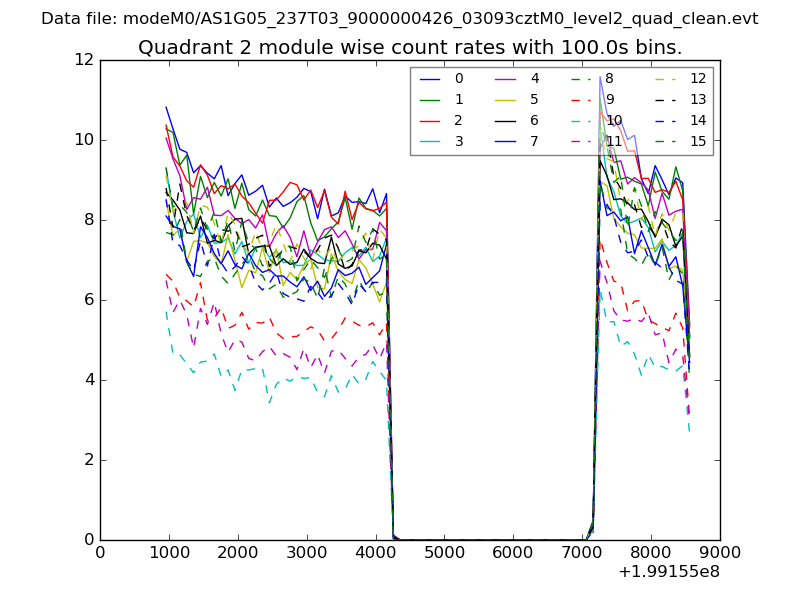
| Module-wise count rates for Quadrant B Data is divided into 100 sec bins |
 |
 |
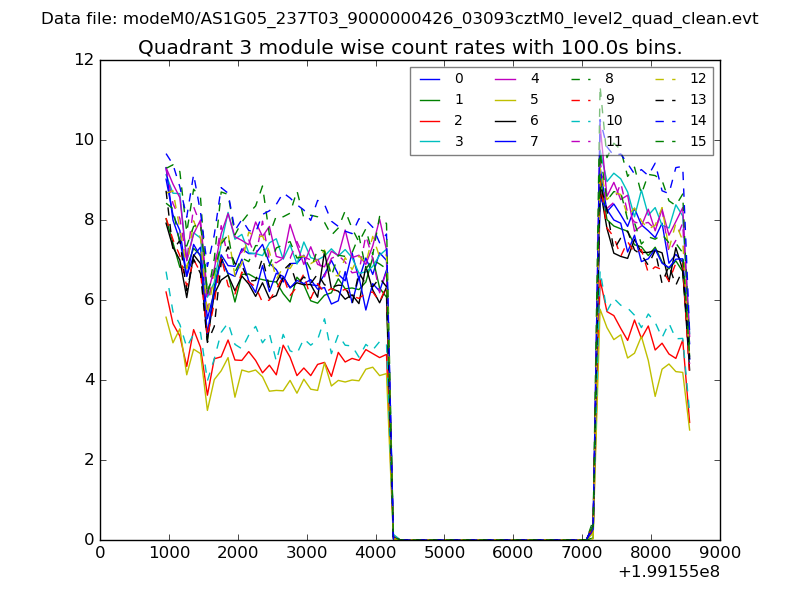
| Module-wise count rates for Quadrant C Data is divided into 100 sec bins |
 |
 |
| Module-wise count rates for Quadrant D Data is divided into 100 sec bins |
 |
 |
| Parameter | Plot |
|---|---|
| CZT HV Monitor | 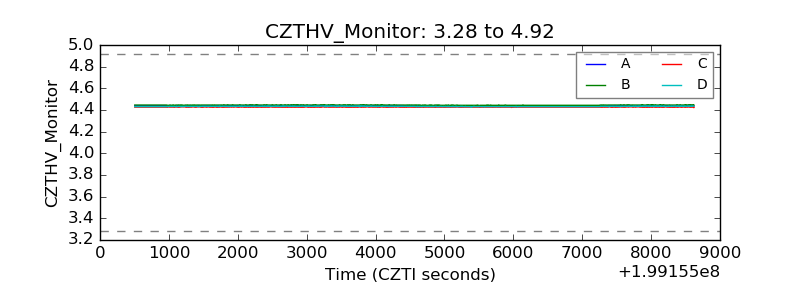 |
| D_VDD | 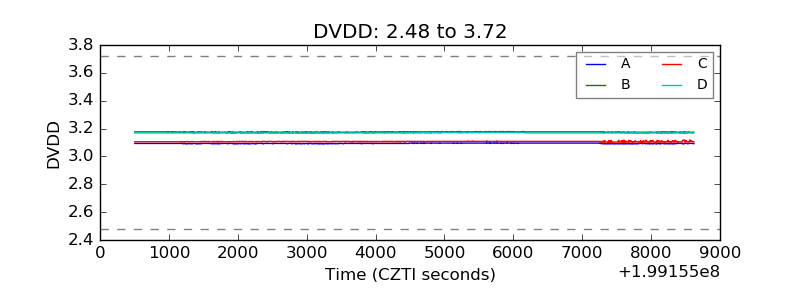 |
| Temperature 1 | 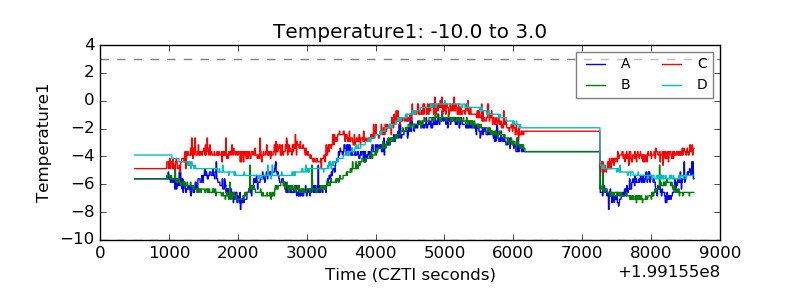 |
| Veto HV Monitor | 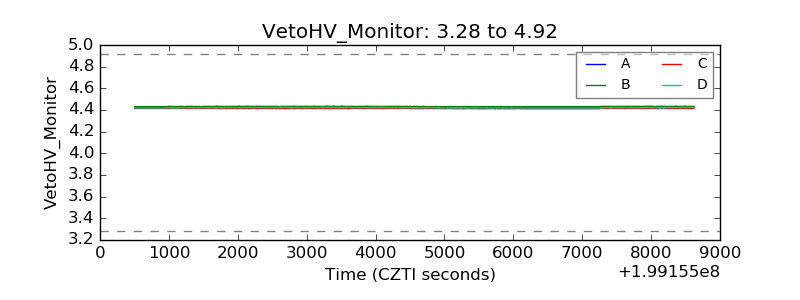 |
| Veto LLD | 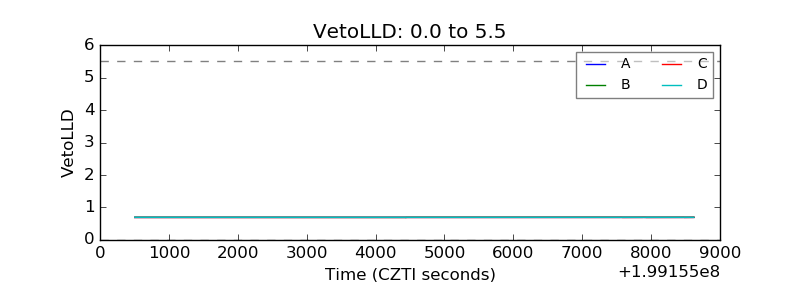 |
| Alpha Counter | 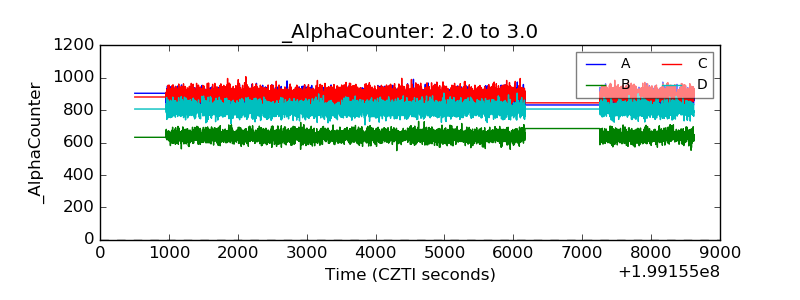 |
| _CPM_Rate | 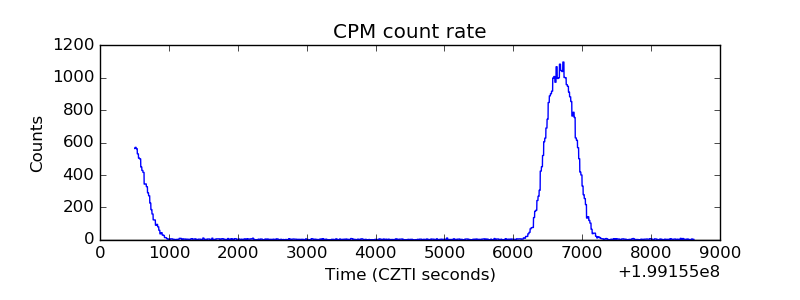 |
| CZT Counter | 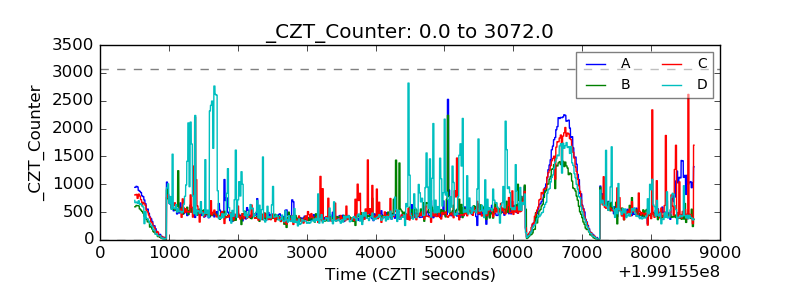 |
| +2.5 Volts monitor |  |
| +5 Volts monitor | 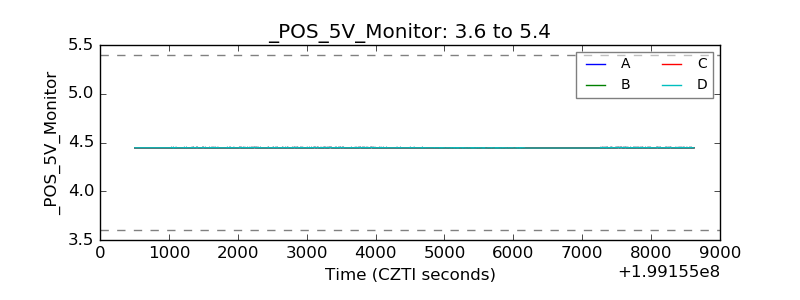 |
| _ROLL_ROT | 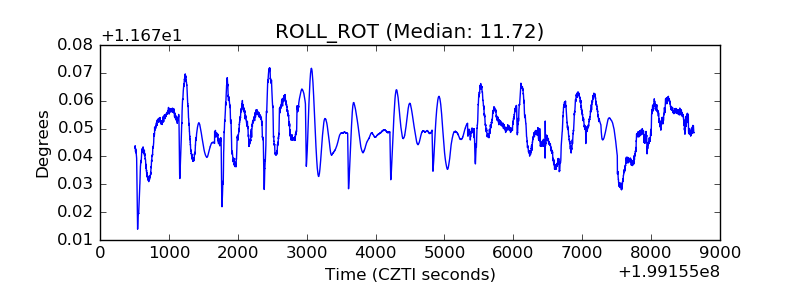 |
| _Roll_DEC | 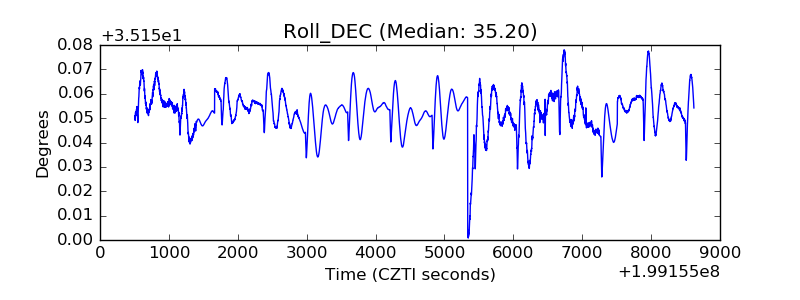 |
| _Roll_RA | 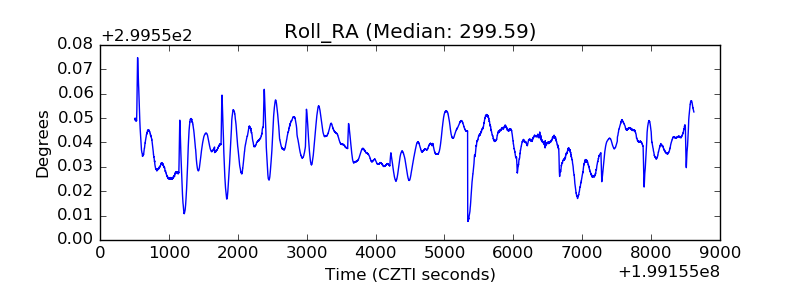 |
| Veto Counter | 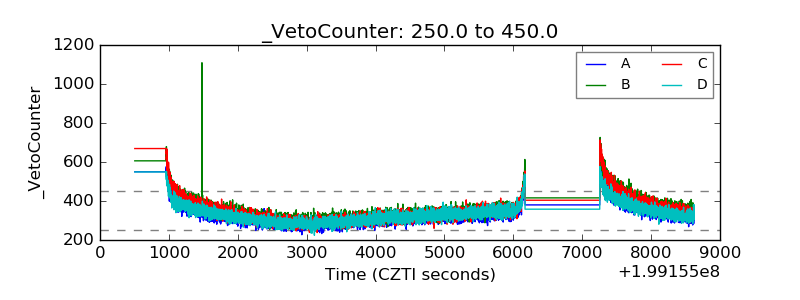 |