| Param | Original file | Final file |
|---|---|---|
| Filename | modeM0/AS1G05_237T03_9000000426_03097cztM0_level2.evt | modeM0/AS1G05_237T03_9000000426_03097cztM0_level2_quad_clean.evt |
| Size (bytes) | 420,442,560 | 68,149,440 |
| Size | 401.0 MB | 65.0 MB |
| Events in quadrant A | 3,075,619 | 426,846 |
| Events in quadrant B | 3,030,639 | 428,026 |
| Events in quadrant C | 2,859,849 | 423,535 |
| Events in quadrant D | 3,395,732 | 402,933 |
| Mode M9 | |||
|---|---|---|---|
| Quadrant | BADHDUFLAG | Total packets | Discarded packets |
| A | 0 | 12 | 0 |
| B | 0 | 12 | 0 |
| C | 0 | 12 | 0 |
| D | 0 | 12 | 0 |
| Mode M0 | |||
|---|---|---|---|
| Quadrant | BADHDUFLAG | Total packets | Discarded packets |
| A | 0 | 12471 | 3 |
| B | 0 | 12458 | 2 |
| C | 0 | 11880 | 2 |
| D | 0 | 13871 | 2 |
| Mode SS | |||
|---|---|---|---|
| Quadrant | BADHDUFLAG | Total packets | Discarded packets |
| A | 0 | 112 | 0 |
| B | 0 | 112 | 0 |
| C | 0 | 112 | 0 |
| D | 0 | 112 | 0 |
| Quadrant | Total seconds | Saturated seconds | Saturation percentage |
|---|---|---|---|
| A | 5457 | 183 | 3.353491% |
| B | 5457 | 68 | 1.246106% |
| C | 5457 | 38 | 0.696353% |
| D | 5457 | 144 | 2.638813% |
Noise dominated data is calculated using 1-second bins in cleaned event files. If a bin has >2000 counts, and if more than 50% of those come from <1% of pixels, then it is considered to be noise-dominated and hence unusable.
| Quadrant | # 1 sec bins | Bins with >0 counts | Bins with >2000 counts | High rate bins dominated by noise | Noise dominated (total time) | Noise dominated (detector-on time) | Marked lightcurve |
|---|---|---|---|---|---|---|---|
| A | 6747 | 5459 | 142 | 142 | 2.10% | 2.60% | 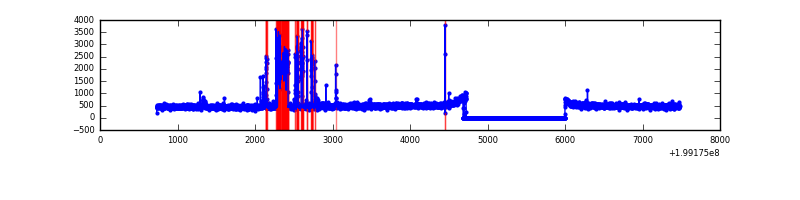 |
| B | 6747 | 5459 | 22 | 22 | 0.33% | 0.40% | 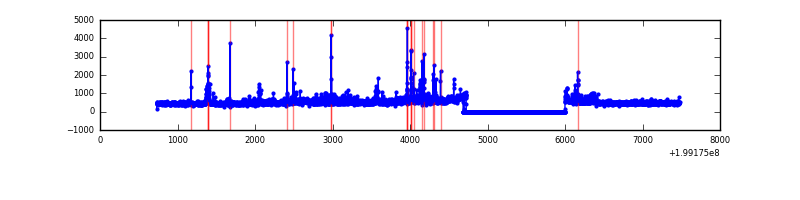 |
| C | 6747 | 5459 | 12 | 12 | 0.18% | 0.22% | 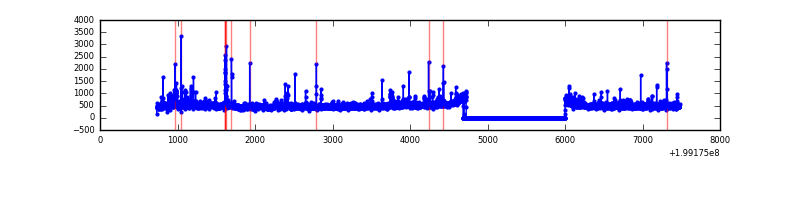 |
| D | 6747 | 5459 | 101 | 101 | 1.50% | 1.85% | 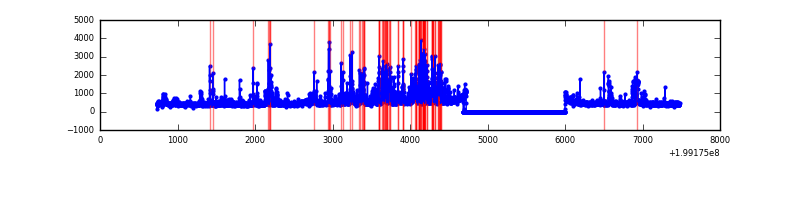 |
Top three noisy pixels from each quadrant. If the there are fewer than three noisy pixels in the level2.evt file, extra rows are filled as -1
| Pixel properties | Quadrant properties | ||||||
|---|---|---|---|---|---|---|---|
| Quadrant | DetID | PixID | Counts | Sigma | Mean | Median | Sigma |
| A | 14 | 249 | 451820 | 3403.46 | 657 | 645 | 132.6 |
| A | 8 | 15 | 66167 | 494.27 | 657 | 645 | 132.6 |
| A | 12 | 194 | 7297 | 50.18 | 657 | 645 | 132.6 |
| B | 15 | 204 | 134689 | 1053.01 | 664 | 652 | 127.3 |
| B | 0 | 219 | 95705 | 746.75 | 664 | 652 | 127.3 |
| B | 10 | 244 | 51058 | 396.0 | 664 | 652 | 127.3 |
| C | 1 | 192 | 204391 | 1394.2 | 630 | 635 | 146.1 |
| C | 6 | 80 | 67849 | 459.91 | 630 | 635 | 146.1 |
| C | 14 | 223 | 39828 | 268.18 | 630 | 635 | 146.1 |
| D | 1 | 7 | 669185 | 4377.67 | 629 | 612 | 152.7 |
| D | 2 | 136 | 91240 | 593.41 | 629 | 612 | 152.7 |
| D | 9 | 85 | 76070 | 494.08 | 629 | 612 | 152.7 |
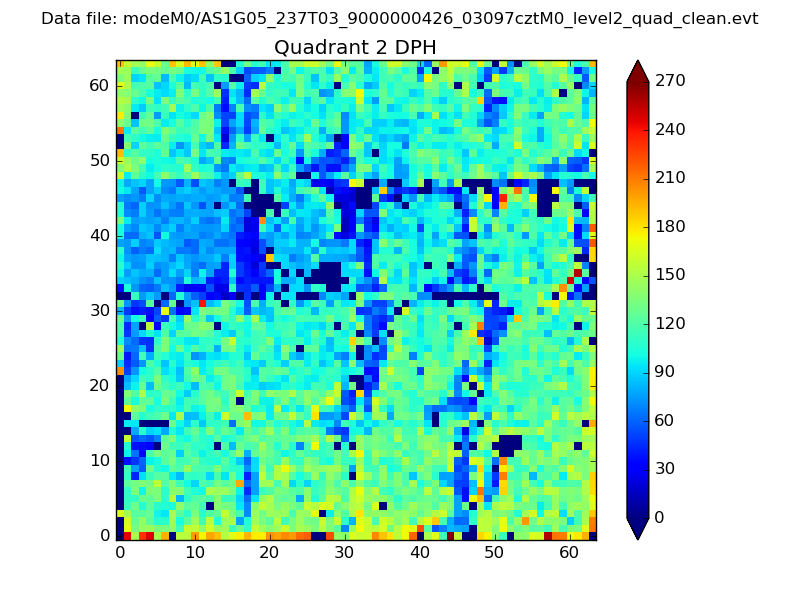
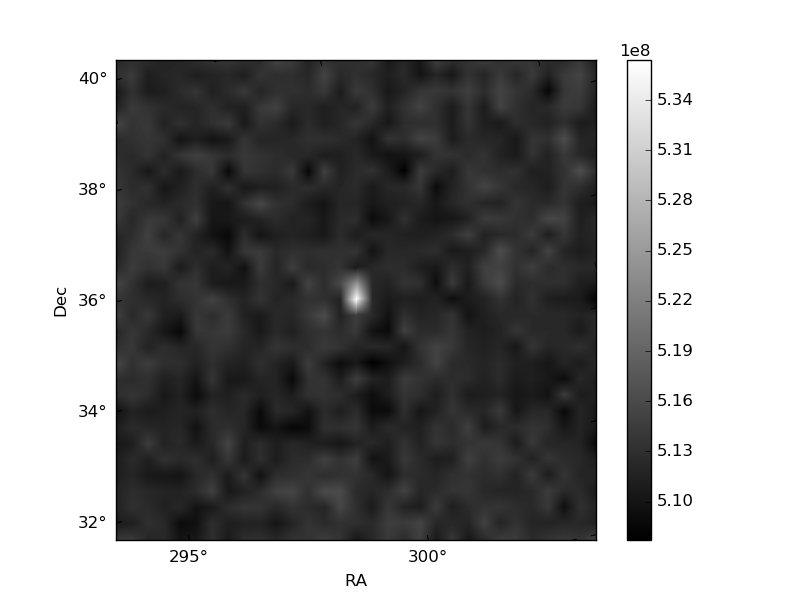
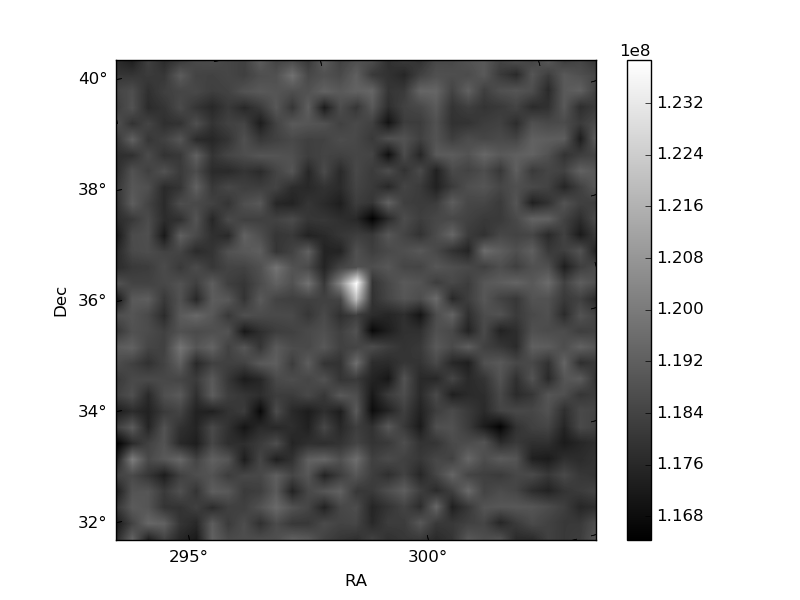
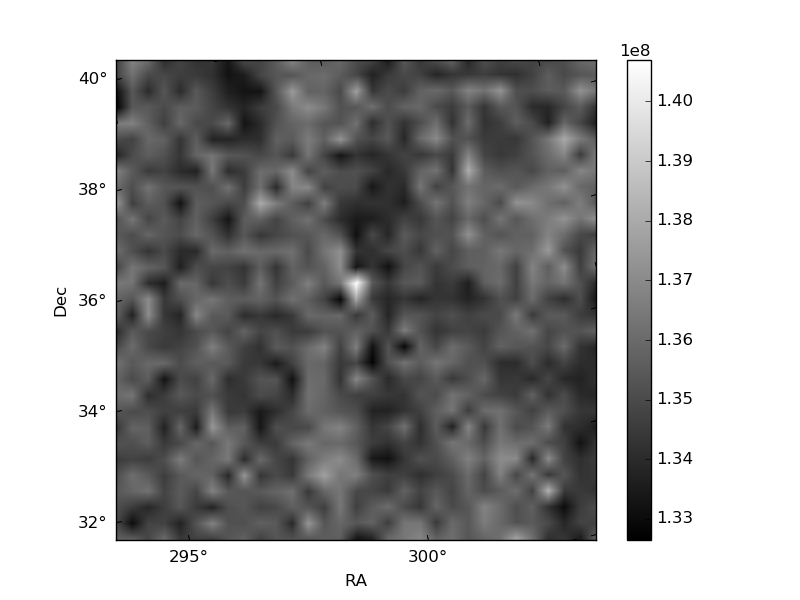
Histogram calculated using DETX and DETY for each event in the final _common_clean file
| Quadrant A | 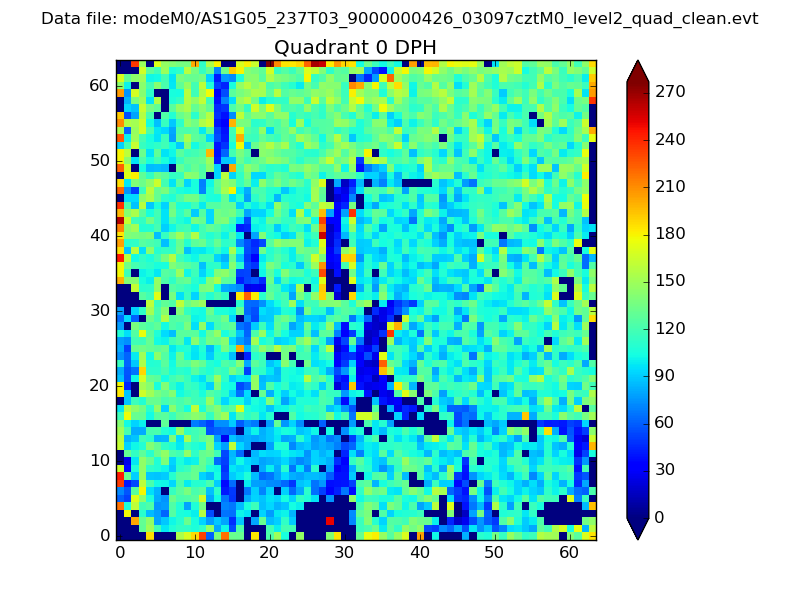 |
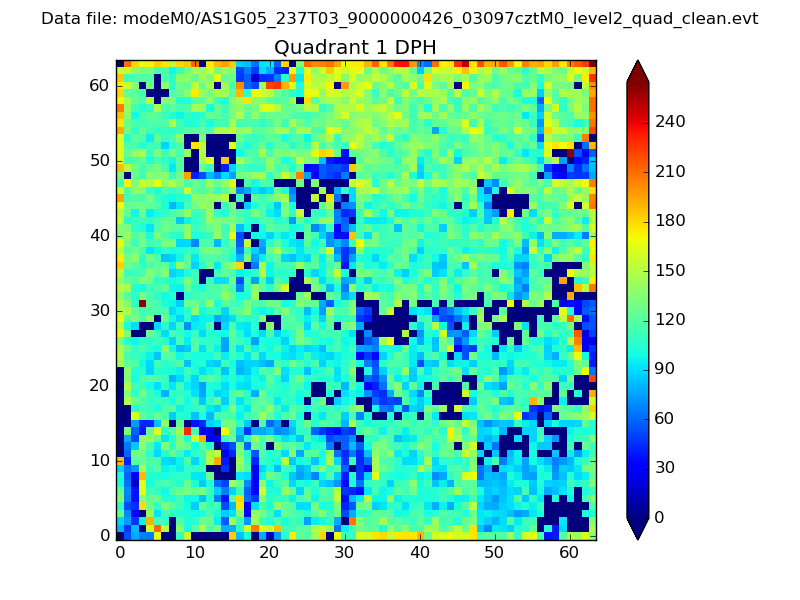 |
Quadrant B |
|---|---|---|---|
| Quadrant D | 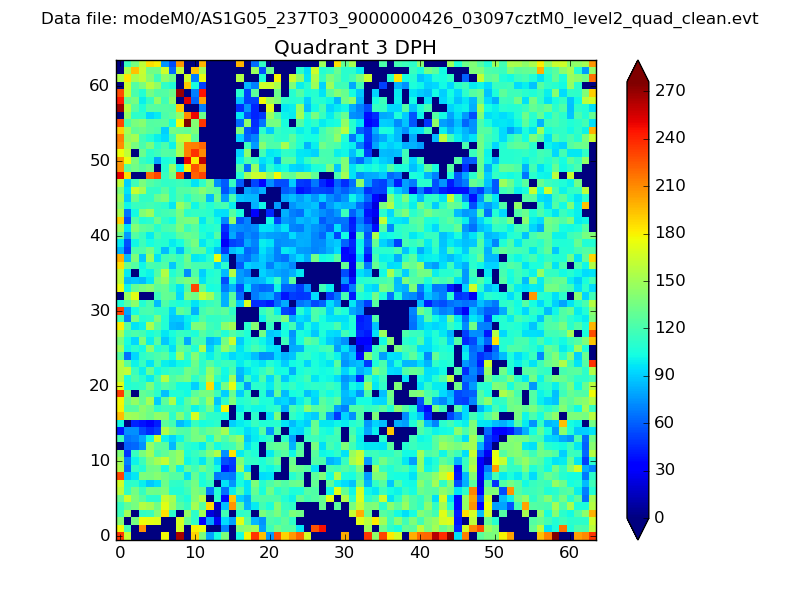 |
 |
Quadrant C |
| Plot type | Count rate plots | Images |
|---|---|---|
| Comparison with Poisson distribution Blue bars denote a histogram of data divided into 1 sec bins. Red curve is a Poisson curve with rate = median count rate of data. |
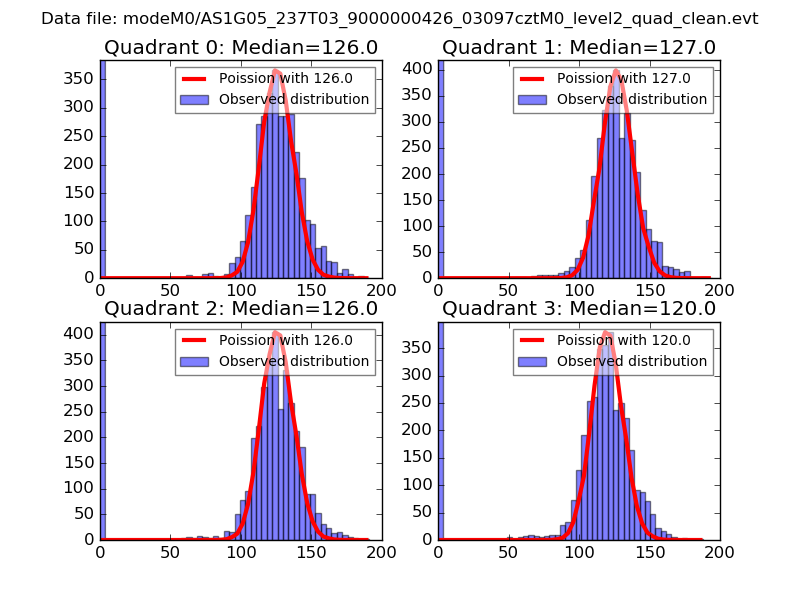 |
 |
| Quadrant-wise count rates Data is divided into 100 sec bins |
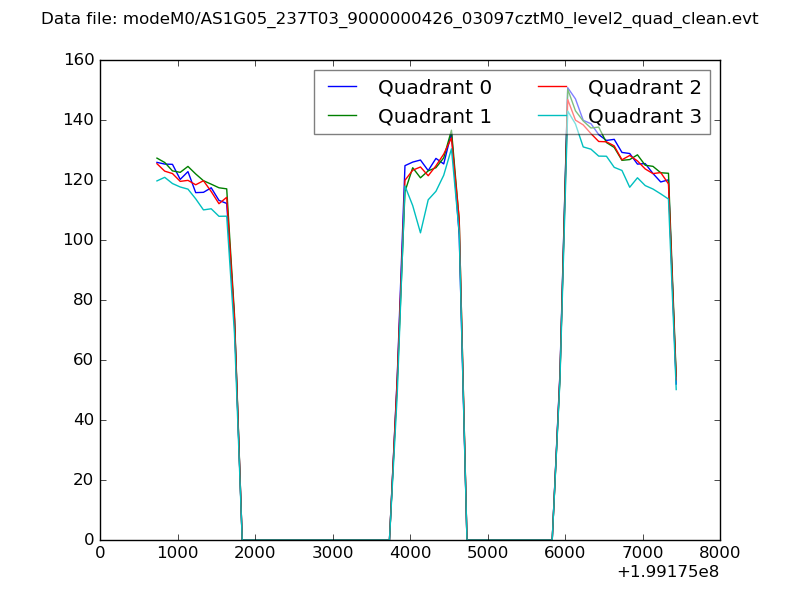 |
|
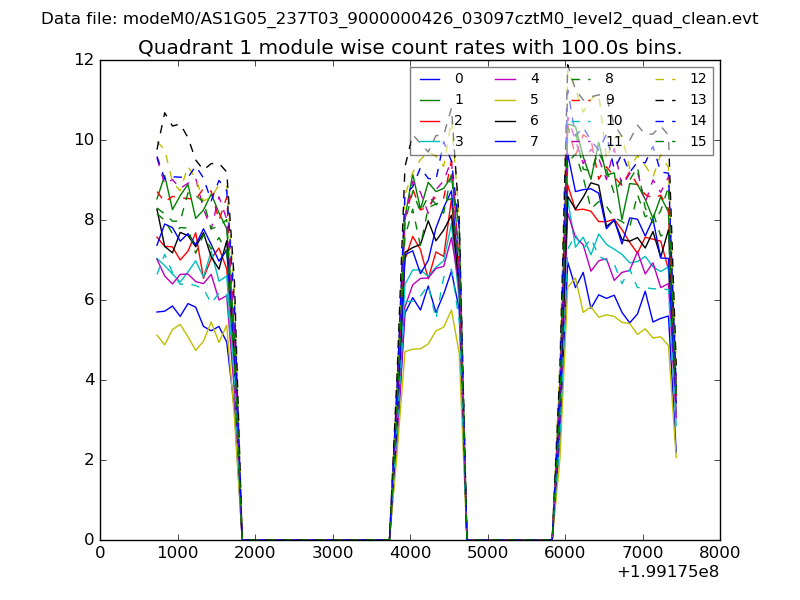
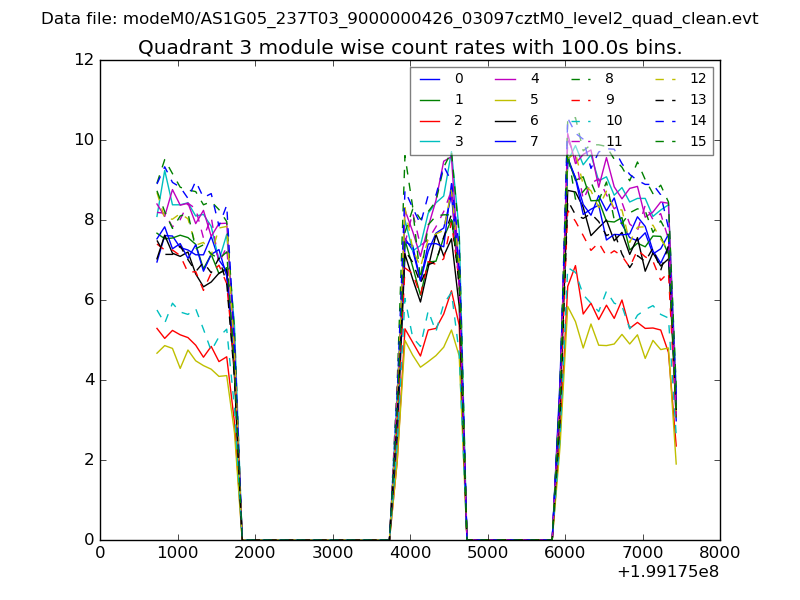
| Module-wise count rates for Quadrant A Data is divided into 100 sec bins |
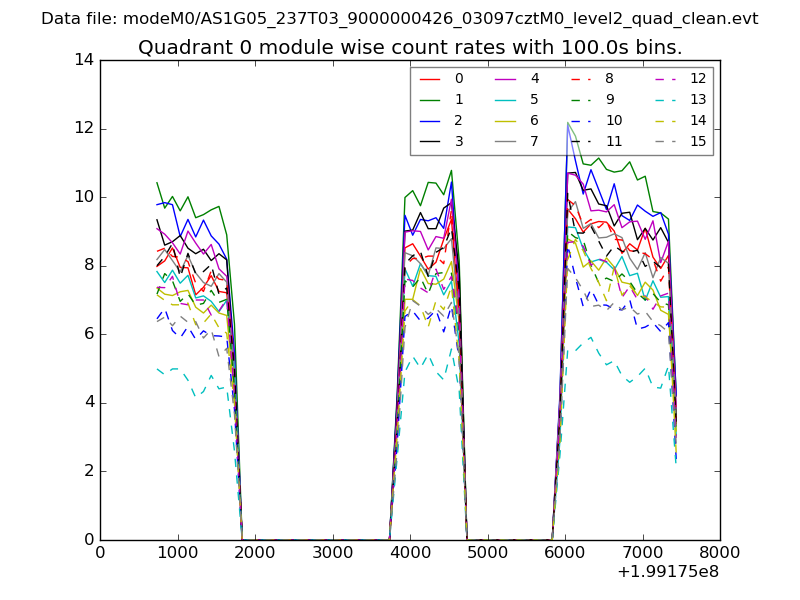 |
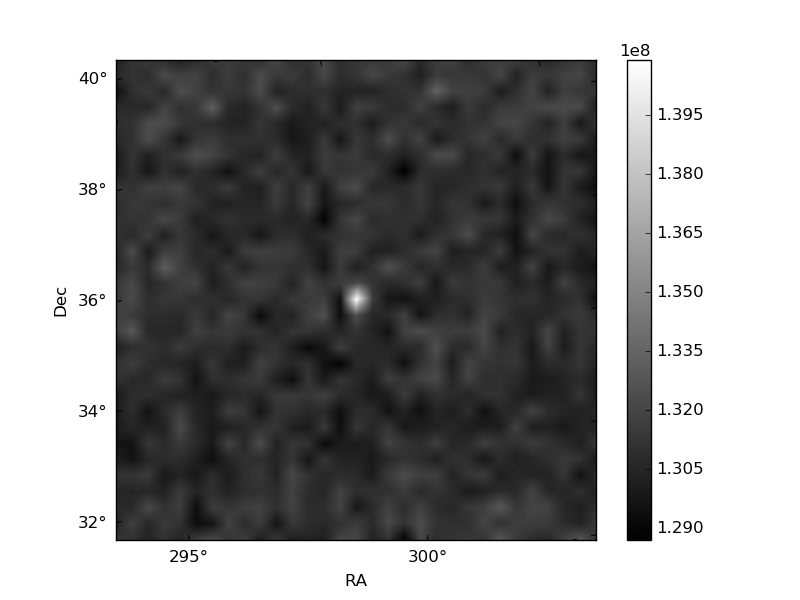 |
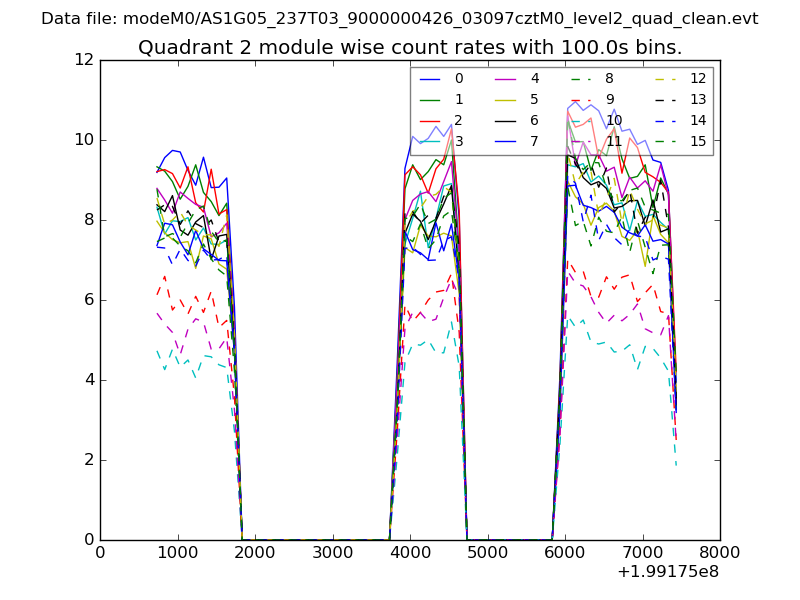
| Module-wise count rates for Quadrant B Data is divided into 100 sec bins |
 |
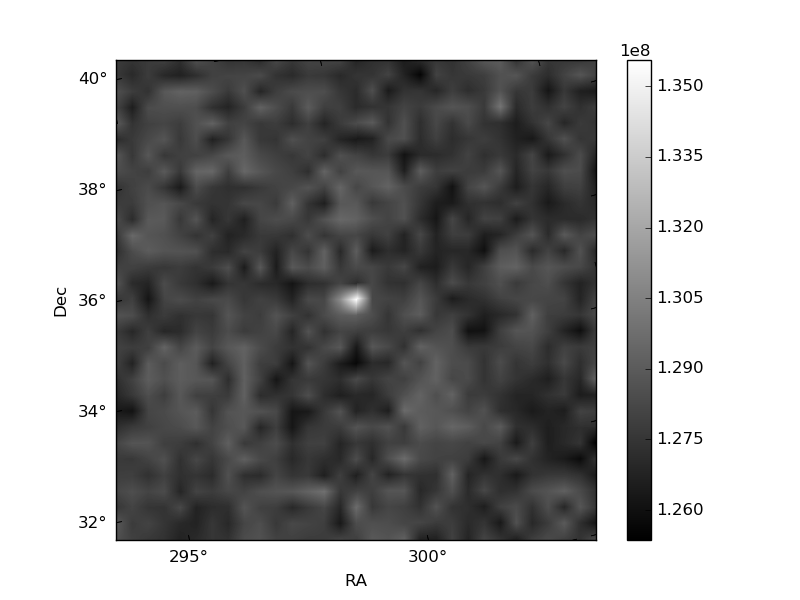 |
| Module-wise count rates for Quadrant C Data is divided into 100 sec bins |
 |
 |
| Module-wise count rates for Quadrant D Data is divided into 100 sec bins |
 |
 |
| Parameter | Plot |
|---|---|
| CZT HV Monitor |  |
| D_VDD | 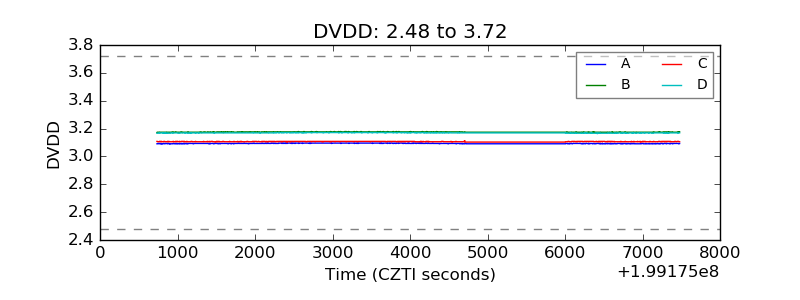 |
| Temperature 1 | 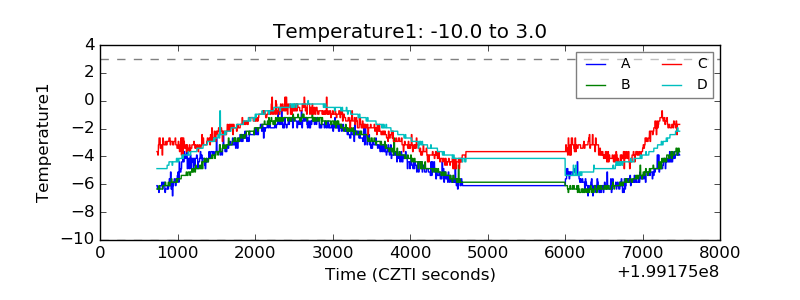 |
| Veto HV Monitor | 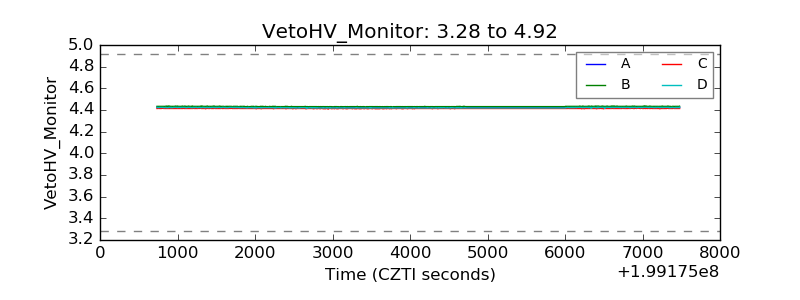 |
| Veto LLD | 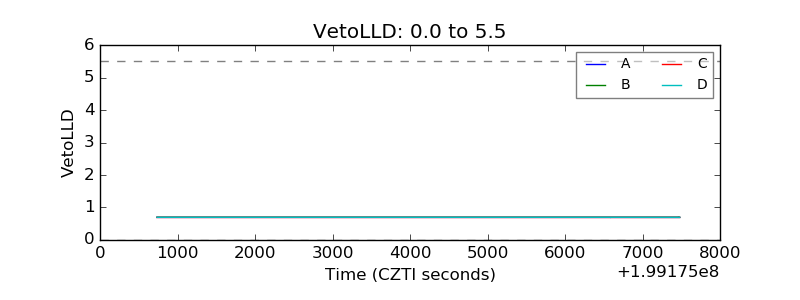 |
| Alpha Counter | 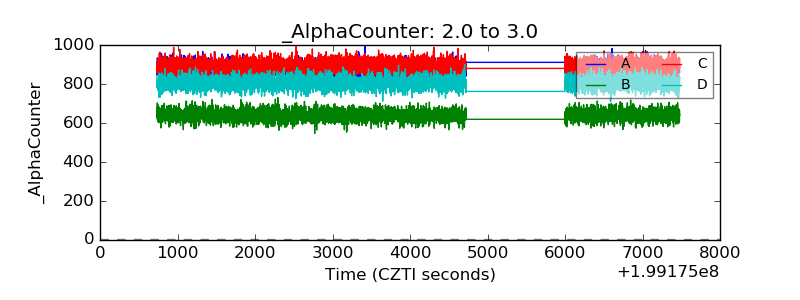 |
| _CPM_Rate | 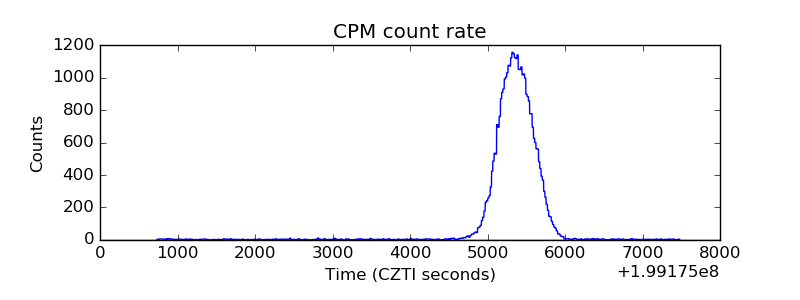 |
| CZT Counter | 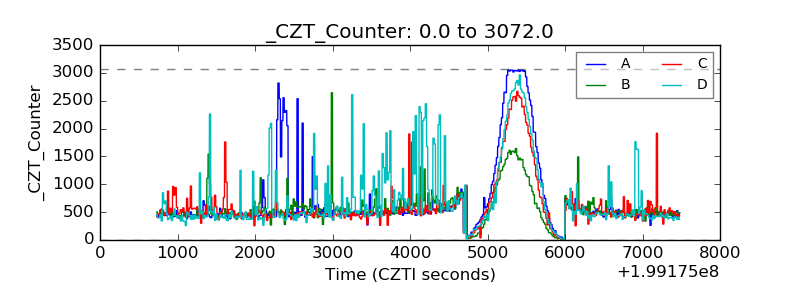 |
| +2.5 Volts monitor |  |
| +5 Volts monitor | 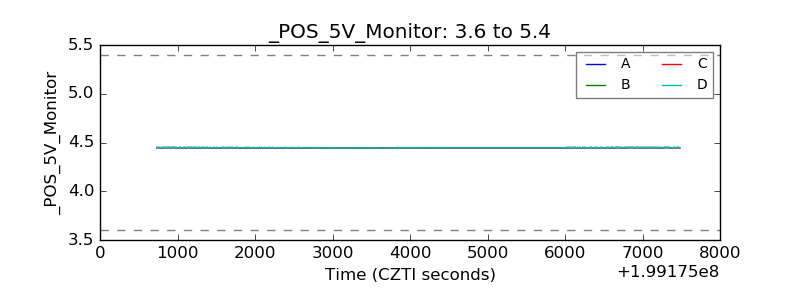 |
| _ROLL_ROT | 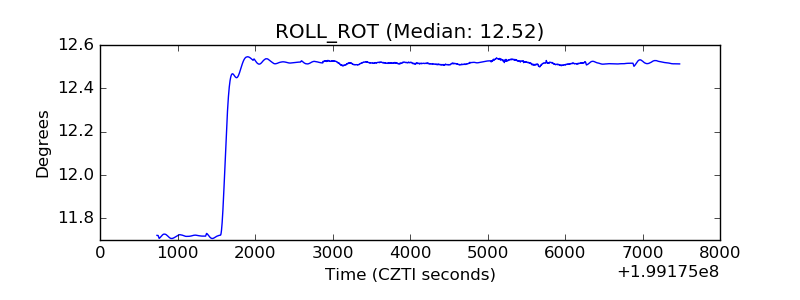 |
| _Roll_DEC | 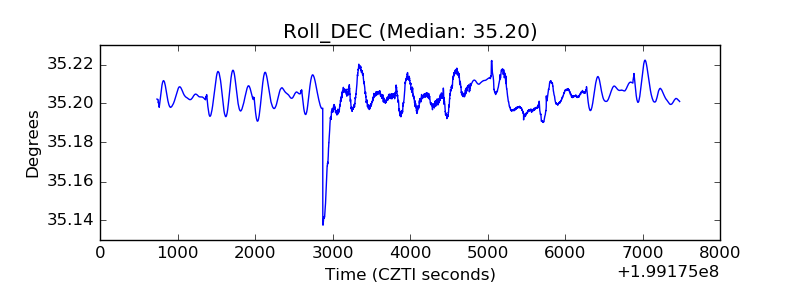 |
| _Roll_RA | 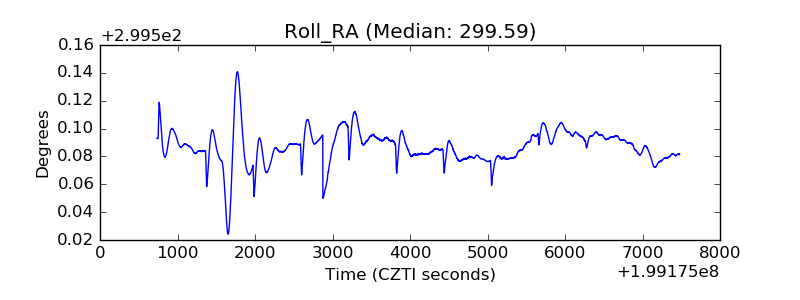 |
| Veto Counter | 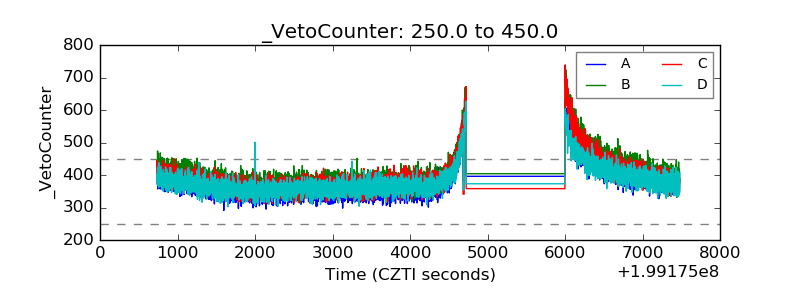 |