| Param | Original file | Final file |
|---|---|---|
| Filename | modeM0/AS1G05_237T03_9000000426_03100cztM0_level2.evt | modeM0/AS1G05_237T03_9000000426_03100cztM0_level2_quad_clean.evt |
| Size (bytes) | 551,770,560 | 69,310,080 |
| Size | 526.2 MB | 66.1 MB |
| Events in quadrant A | 3,455,192 | 419,391 |
| Events in quadrant B | 3,764,259 | 418,391 |
| Events in quadrant C | 5,182,289 | 391,159 |
| Events in quadrant D | 3,844,337 | 392,323 |
| Mode M9 | |||
|---|---|---|---|
| Quadrant | BADHDUFLAG | Total packets | Discarded packets |
| A | 0 | 7 | 0 |
| B | 0 | 7 | 0 |
| C | 0 | 7 | 0 |
| D | 0 | 7 | 0 |
| Mode M0 | |||
|---|---|---|---|
| Quadrant | BADHDUFLAG | Total packets | Discarded packets |
| A | 0 | 14382 | 2 |
| B | 0 | 15434 | 1 |
| C | 0 | 20039 | 1 |
| D | 0 | 16334 | 1 |
| Mode SS | |||
|---|---|---|---|
| Quadrant | BADHDUFLAG | Total packets | Discarded packets |
| A | 0 | 138 | 0 |
| B | 0 | 138 | 0 |
| C | 0 | 138 | 0 |
| D | 0 | 138 | 0 |
| Quadrant | Total seconds | Saturated seconds | Saturation percentage |
|---|---|---|---|
| A | 6845 | 148 | 2.162162% |
| B | 6845 | 167 | 2.439737% |
| C | 6845 | 721 | 10.533236% |
| D | 6845 | 262 | 3.827611% |
Noise dominated data is calculated using 1-second bins in cleaned event files. If a bin has >2000 counts, and if more than 50% of those come from <1% of pixels, then it is considered to be noise-dominated and hence unusable.
| Quadrant | # 1 sec bins | Bins with >0 counts | Bins with >2000 counts | High rate bins dominated by noise | Noise dominated (total time) | Noise dominated (detector-on time) | Marked lightcurve |
|---|---|---|---|---|---|---|---|
| A | 7530 | 6846 | 7 | 7 | 0.09% | 0.10% | 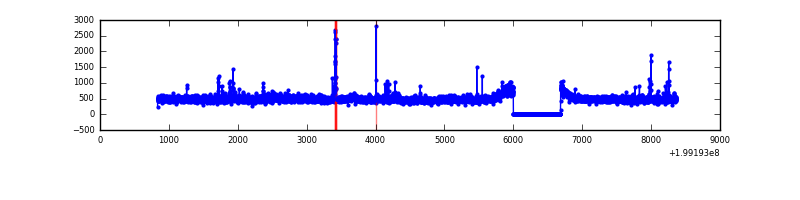 |
| B | 7530 | 6845 | 33 | 33 | 0.44% | 0.48% | 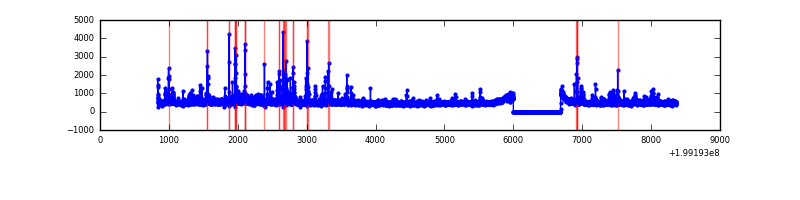 |
| C | 7530 | 6846 | 564 | 564 | 7.49% | 8.24% | 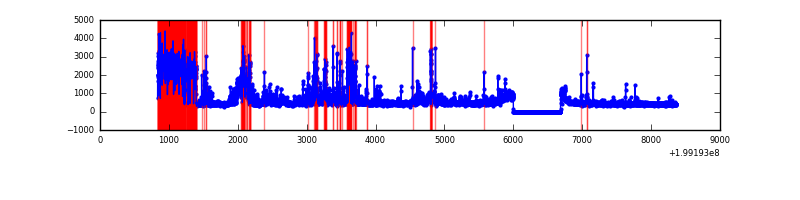 |
| D | 7530 | 6846 | 194 | 194 | 2.58% | 2.83% | 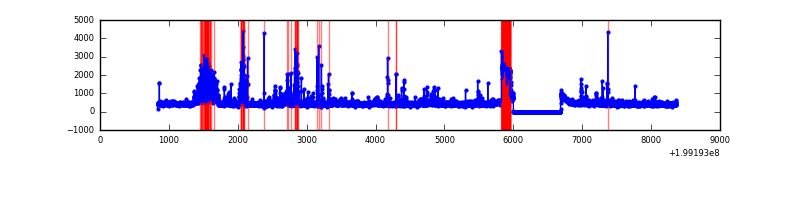 |
Top three noisy pixels from each quadrant. If the there are fewer than three noisy pixels in the level2.evt file, extra rows are filled as -1
| Pixel properties | Quadrant properties | ||||||
|---|---|---|---|---|---|---|---|
| Quadrant | DetID | PixID | Counts | Sigma | Mean | Median | Sigma |
| A | 8 | 15 | 275583 | 1657.9 | 800 | 781 | 165.8 |
| A | 14 | 249 | 40571 | 240.06 | 800 | 781 | 165.8 |
| A | 12 | 247 | 29977 | 176.14 | 800 | 781 | 165.8 |
| B | 15 | 204 | 180987 | 1141.01 | 807 | 787 | 157.9 |
| B | 0 | 219 | 122511 | 770.75 | 807 | 787 | 157.9 |
| B | 1 | 223 | 98263 | 617.21 | 807 | 787 | 157.9 |
| C | 1 | 192 | 1747077 | 10027.56 | 746 | 751 | 174.2 |
| C | 14 | 223 | 358176 | 2052.37 | 746 | 751 | 174.2 |
| C | 5 | 250 | 85191 | 484.86 | 746 | 751 | 174.2 |
| D | 1 | 7 | 402143 | 2055.5 | 746 | 726 | 195.3 |
| D | 2 | 107 | 289007 | 1476.18 | 746 | 726 | 195.3 |
| D | 13 | 46 | 97549 | 495.79 | 746 | 726 | 195.3 |
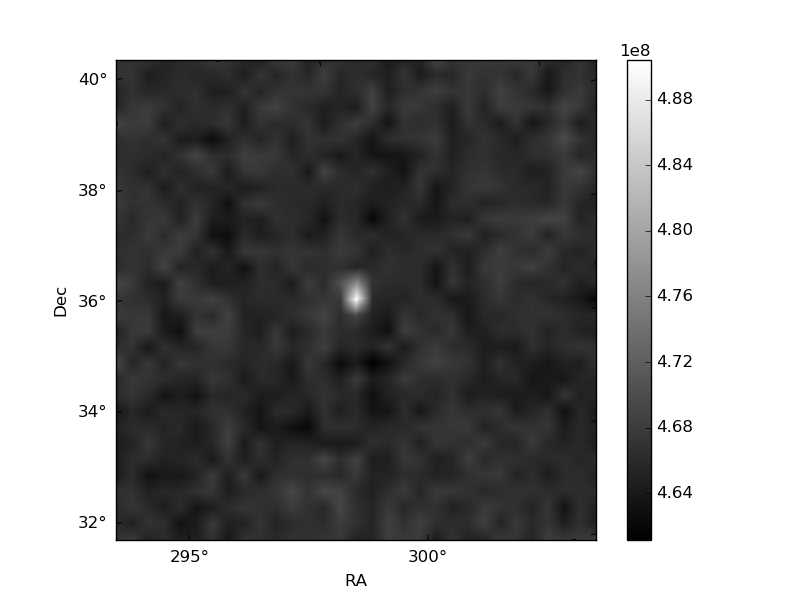
Histogram calculated using DETX and DETY for each event in the final _common_clean file
| Quadrant A | 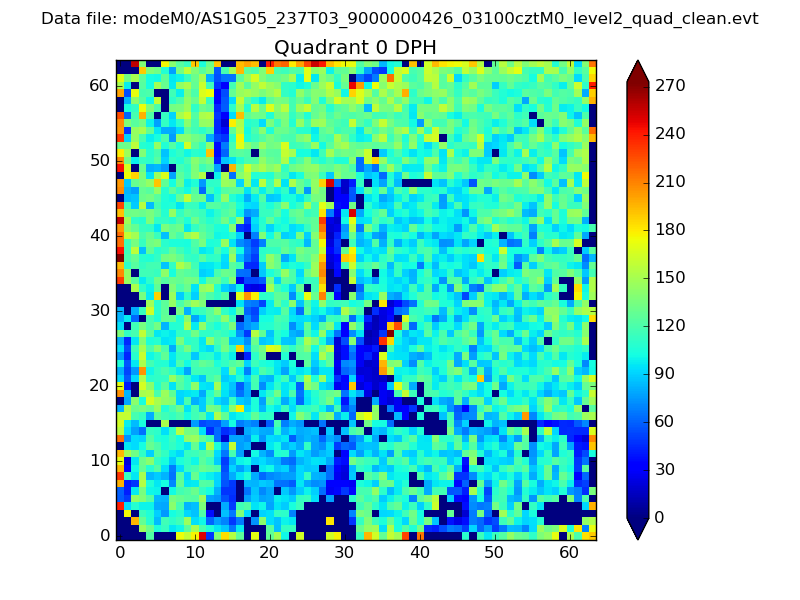 |
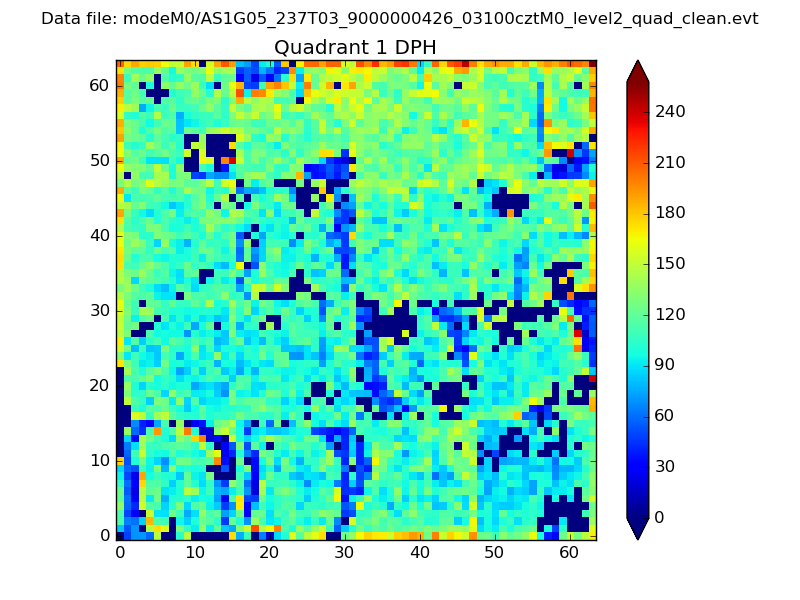 |
Quadrant B |
|---|---|---|---|
| Quadrant D | 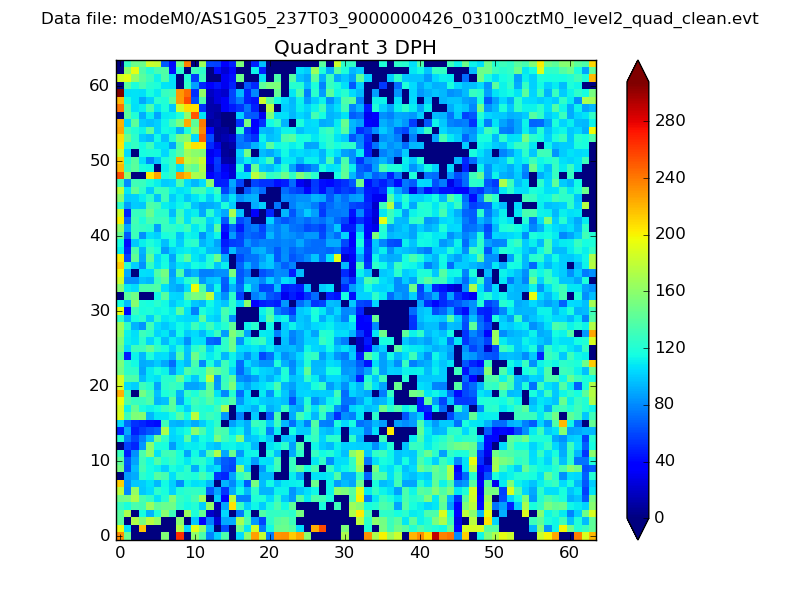 |
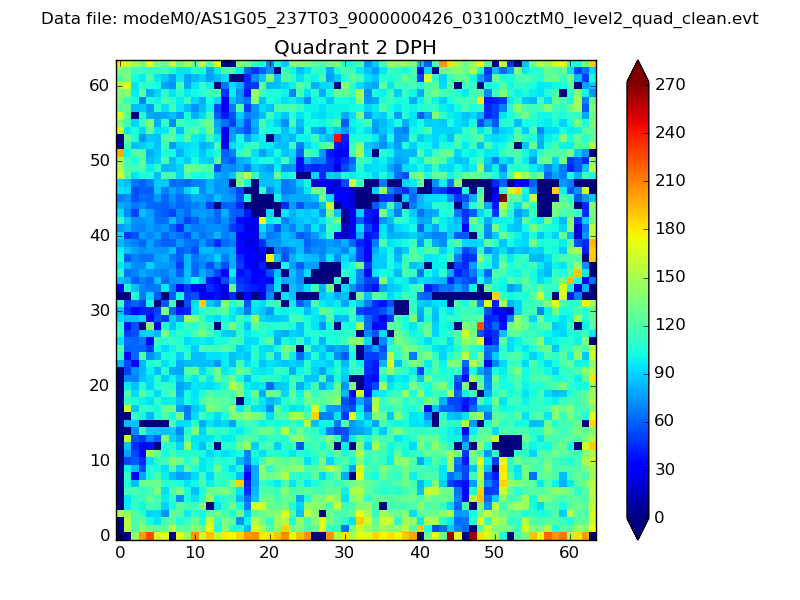 |
Quadrant C |
| Plot type | Count rate plots | Images |
|---|---|---|
| Comparison with Poisson distribution Blue bars denote a histogram of data divided into 1 sec bins. Red curve is a Poisson curve with rate = median count rate of data. |
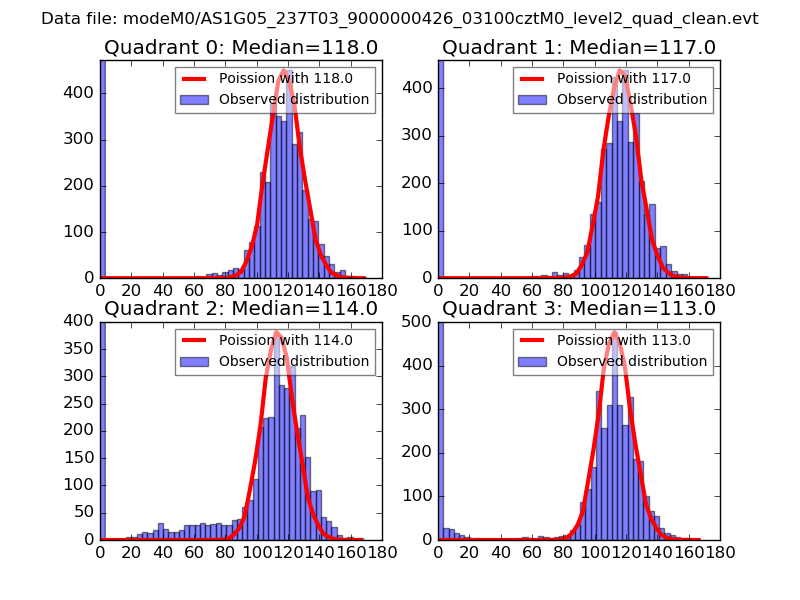 |
 |
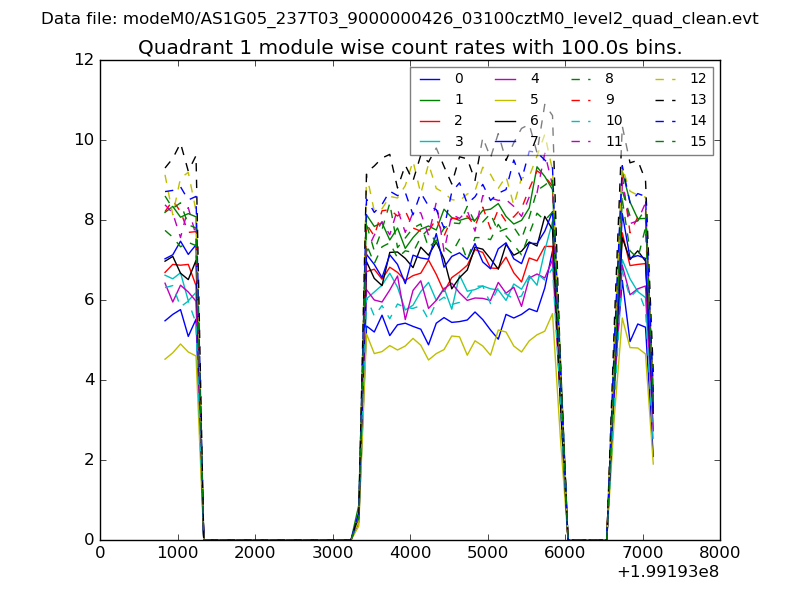
| Quadrant-wise count rates Data is divided into 100 sec bins |
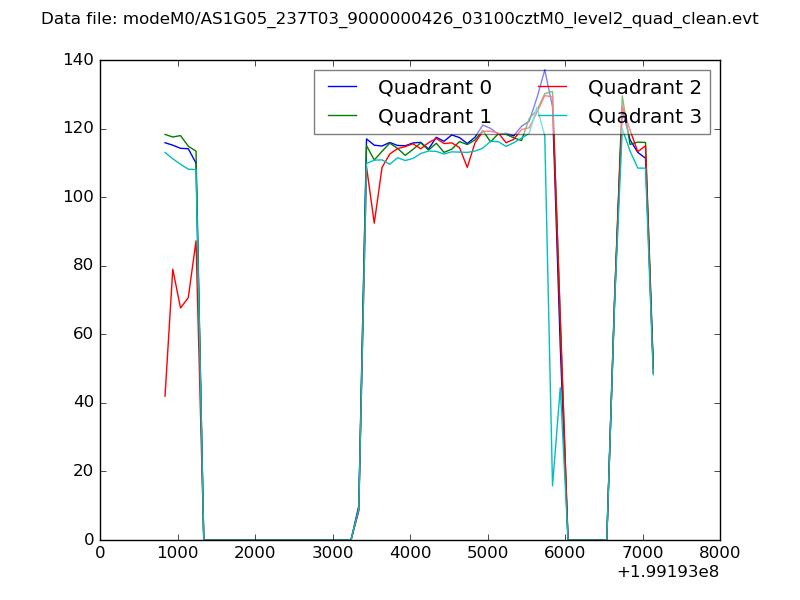 |
|
| Module-wise count rates for Quadrant A Data is divided into 100 sec bins |
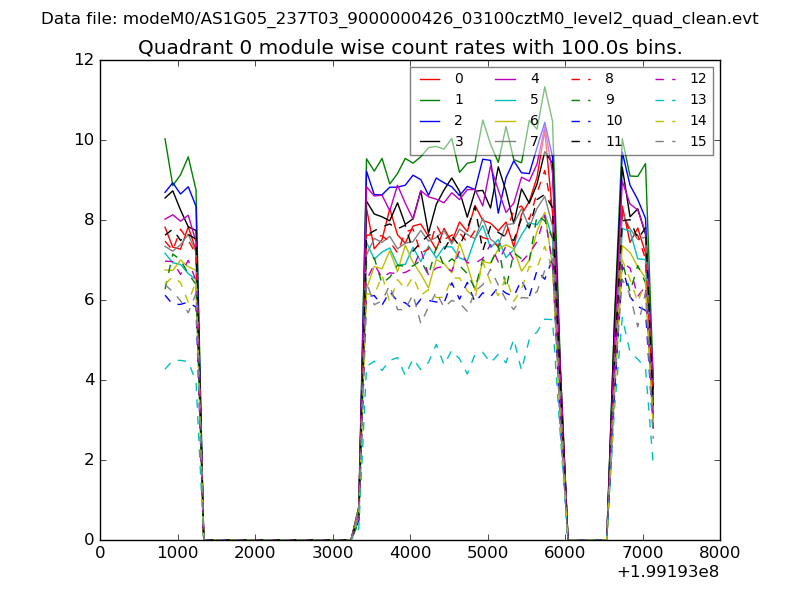 |
 |
| Module-wise count rates for Quadrant B Data is divided into 100 sec bins |
 |
 |
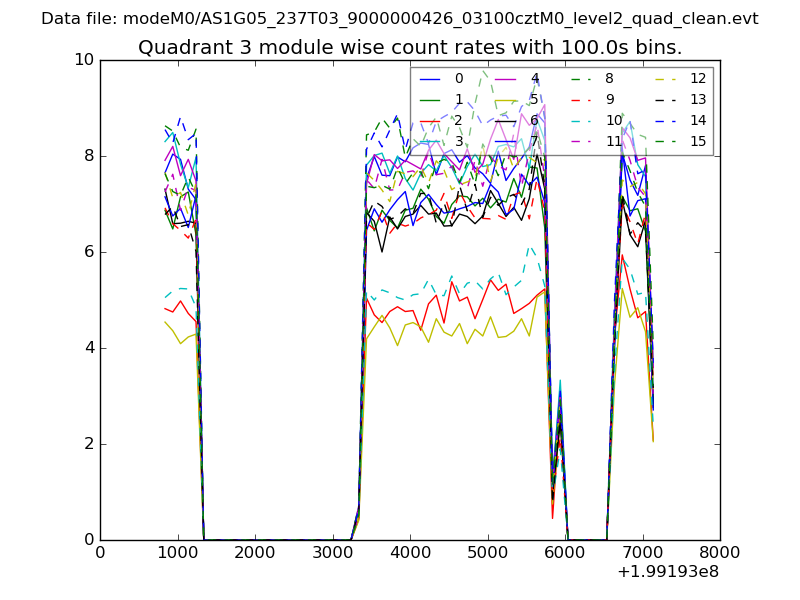
| Module-wise count rates for Quadrant C Data is divided into 100 sec bins |
 |
 |
| Module-wise count rates for Quadrant D Data is divided into 100 sec bins |
 |
 |
| Parameter | Plot |
|---|---|
| CZT HV Monitor | 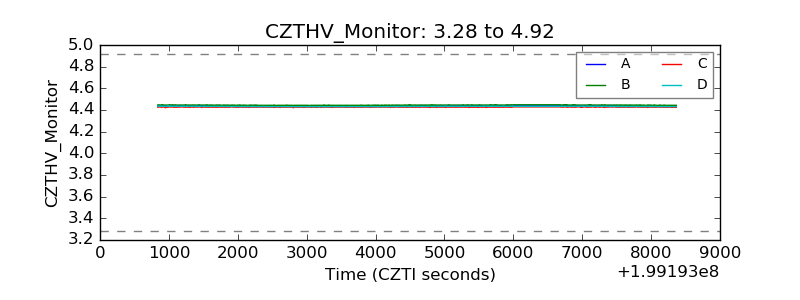 |
| D_VDD | 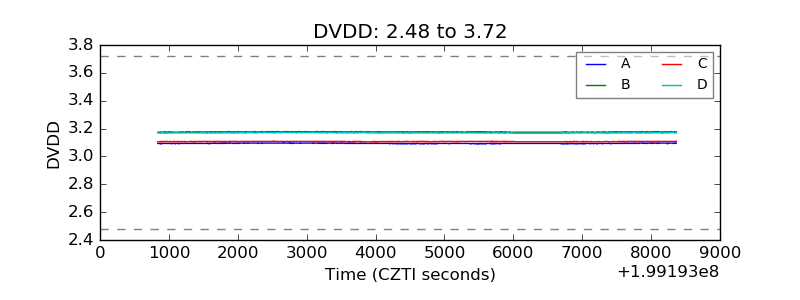 |
| Temperature 1 | 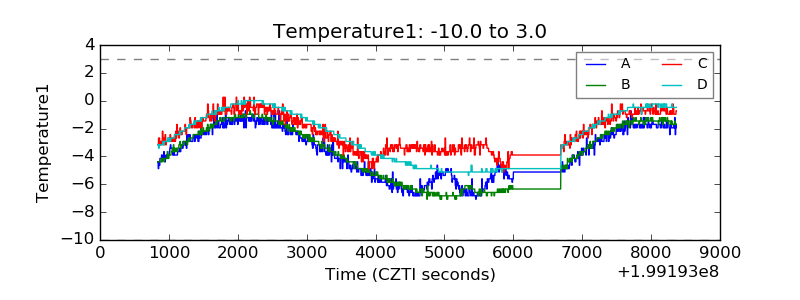 |
| Veto HV Monitor | 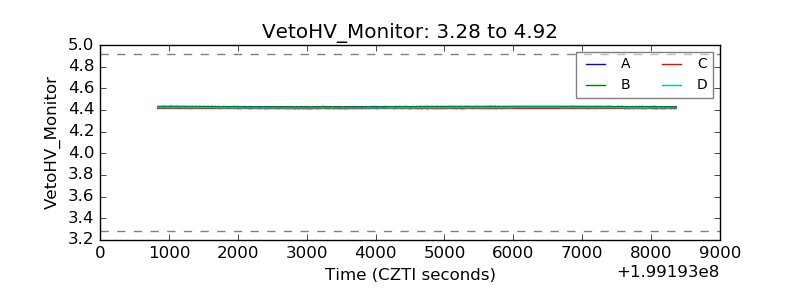 |
| Veto LLD | 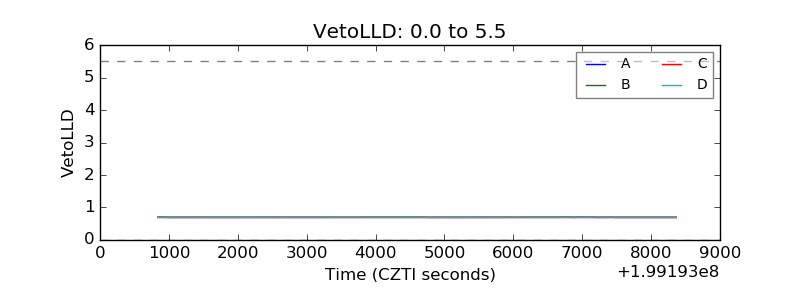 |
| Alpha Counter | 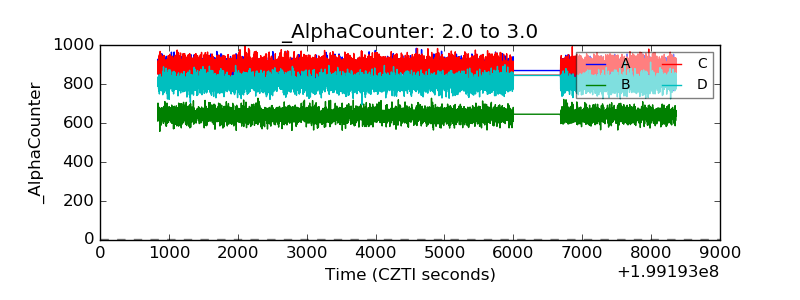 |
| _CPM_Rate | 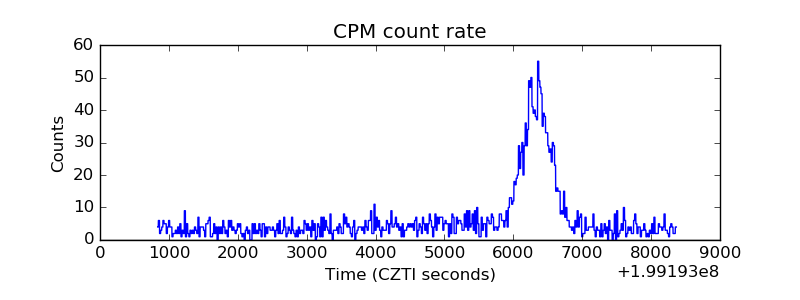 |
| CZT Counter | 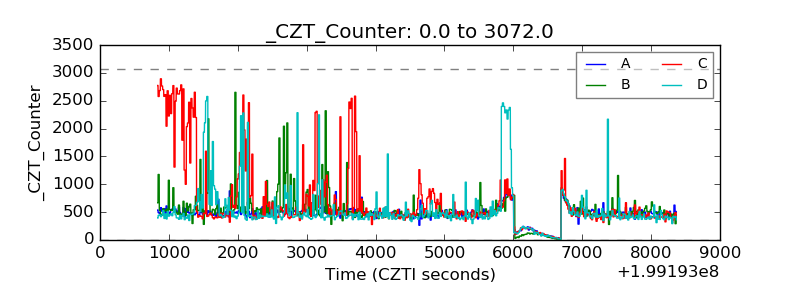 |
| +2.5 Volts monitor |  |
| +5 Volts monitor |  |
| _ROLL_ROT | 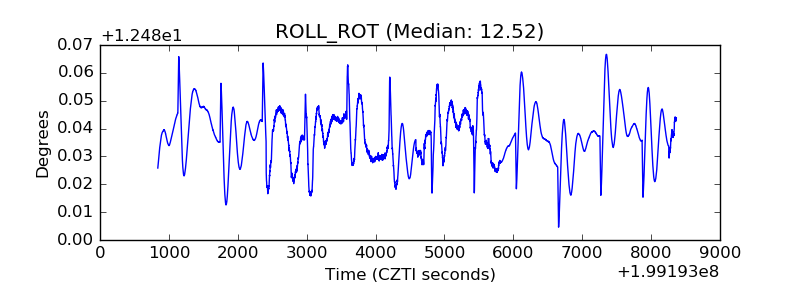 |
| _Roll_DEC | 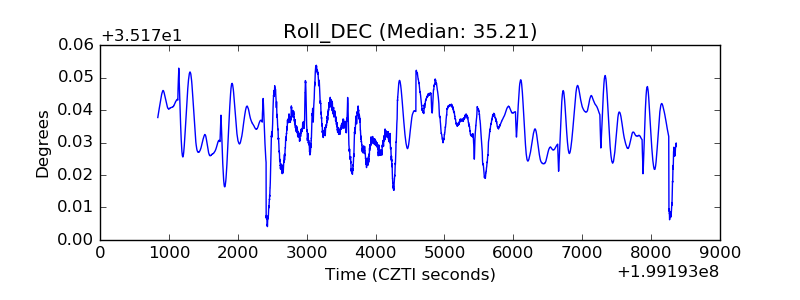 |
| _Roll_RA | 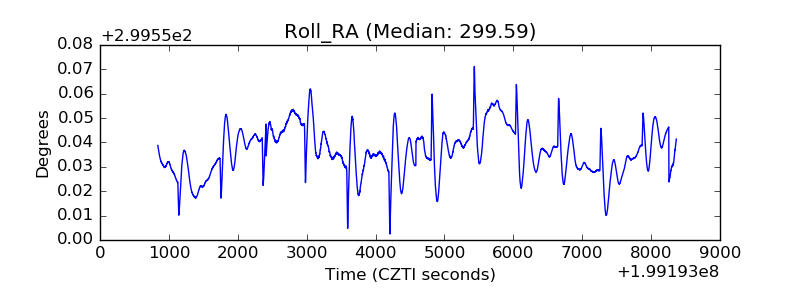 |
| Veto Counter | 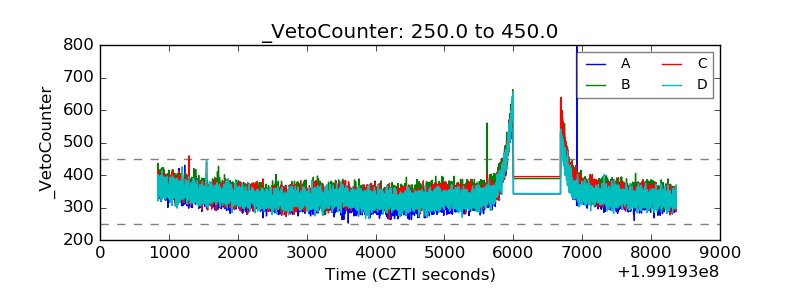 |