| Param | Original file | Final file |
|---|---|---|
| Filename | modeM0/AS1G05_237T03_9000000426_03101cztM0_level2.evt | modeM0/AS1G05_237T03_9000000426_03101cztM0_level2_quad_clean.evt |
| Size (bytes) | 532,670,400 | 79,306,560 |
| Size | 508.0 MB | 75.6 MB |
| Events in quadrant A | 3,771,138 | 471,061 |
| Events in quadrant B | 4,098,494 | 469,651 |
| Events in quadrant C | 3,859,757 | 470,973 |
| Events in quadrant D | 3,881,391 | 455,517 |
| Mode M9 | |||
|---|---|---|---|
| Quadrant | BADHDUFLAG | Total packets | Discarded packets |
| A | 0 | 2 | 0 |
| B | 0 | 2 | 0 |
| C | 0 | 2 | 0 |
| D | 0 | 2 | 0 |
| Mode M0 | |||
|---|---|---|---|
| Quadrant | BADHDUFLAG | Total packets | Discarded packets |
| A | 0 | 16162 | 2 |
| B | 0 | 17136 | 1 |
| C | 0 | 16885 | 1 |
| D | 0 | 17163 | 1 |
| Mode SS | |||
|---|---|---|---|
| Quadrant | BADHDUFLAG | Total packets | Discarded packets |
| A | 0 | 154 | 0 |
| B | 0 | 154 | 0 |
| C | 0 | 154 | 0 |
| D | 0 | 154 | 0 |
| Quadrant | Total seconds | Saturated seconds | Saturation percentage |
|---|---|---|---|
| A | 7680 | 236 | 3.072917% |
| B | 7680 | 232 | 3.020833% |
| C | 7680 | 206 | 2.682292% |
| D | 7680 | 241 | 3.138021% |
Noise dominated data is calculated using 1-second bins in cleaned event files. If a bin has >2000 counts, and if more than 50% of those come from <1% of pixels, then it is considered to be noise-dominated and hence unusable.
| Quadrant | # 1 sec bins | Bins with >0 counts | Bins with >2000 counts | High rate bins dominated by noise | Noise dominated (total time) | Noise dominated (detector-on time) | Marked lightcurve |
|---|---|---|---|---|---|---|---|
| A | 7840 | 7681 | 2 | 2 | 0.03% | 0.03% | 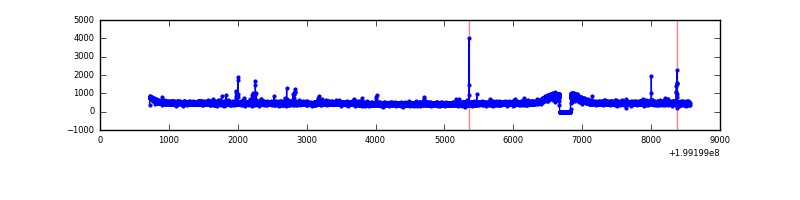 |
| B | 7840 | 7681 | 7 | 7 | 0.09% | 0.09% | 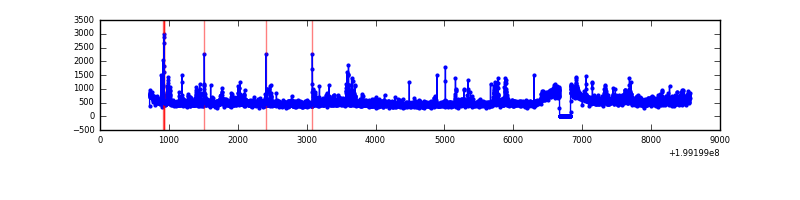 |
| C | 7840 | 7681 | 22 | 22 | 0.28% | 0.29% |  |
| D | 7840 | 7681 | 49 | 49 | 0.62% | 0.64% | 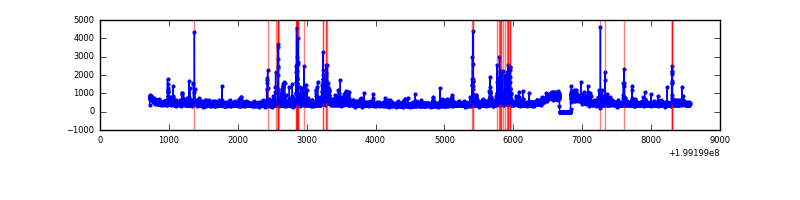 |
Top three noisy pixels from each quadrant. If the there are fewer than three noisy pixels in the level2.evt file, extra rows are filled as -1
| Pixel properties | Quadrant properties | ||||||
|---|---|---|---|---|---|---|---|
| Quadrant | DetID | PixID | Counts | Sigma | Mean | Median | Sigma |
| A | 8 | 15 | 160806 | 853.63 | 917 | 896 | 187.3 |
| A | 12 | 247 | 23945 | 123.04 | 917 | 896 | 187.3 |
| A | 0 | 117 | 18438 | 93.64 | 917 | 896 | 187.3 |
| B | 15 | 204 | 226222 | 1229.3 | 928 | 904 | 183.3 |
| B | 0 | 219 | 127200 | 689.05 | 928 | 904 | 183.3 |
| B | 1 | 223 | 37130 | 197.64 | 928 | 904 | 183.3 |
| C | 1 | 192 | 130200 | 625.66 | 883 | 887 | 206.7 |
| C | 6 | 80 | 79725 | 381.44 | 883 | 887 | 206.7 |
| C | 5 | 250 | 71994 | 344.04 | 883 | 887 | 206.7 |
| D | 13 | 239 | 105532 | 453.34 | 881 | 858 | 230.9 |
| D | 13 | 223 | 75867 | 324.86 | 881 | 858 | 230.9 |
| D | 13 | 114 | 74048 | 316.98 | 881 | 858 | 230.9 |
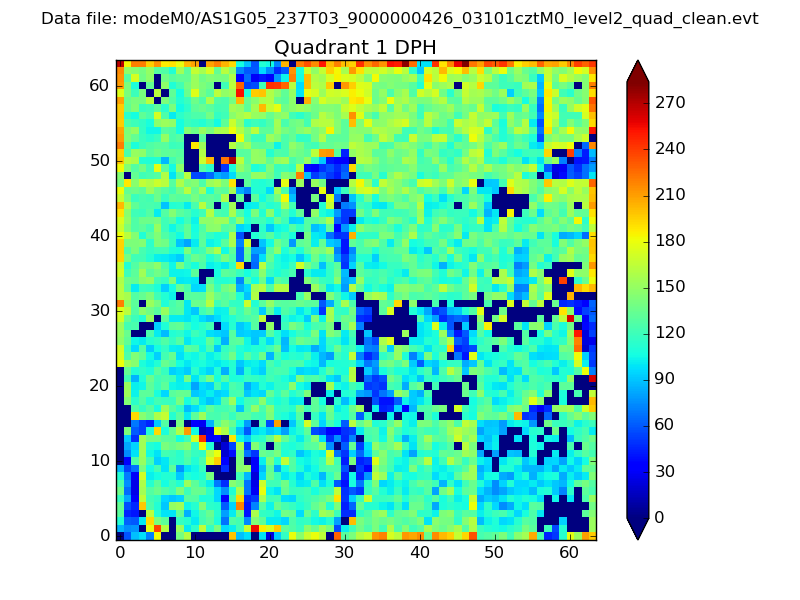
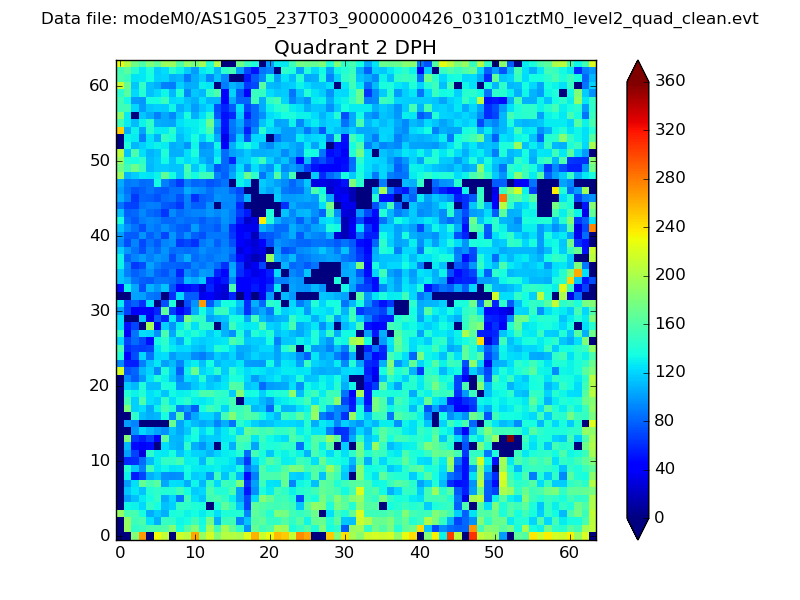
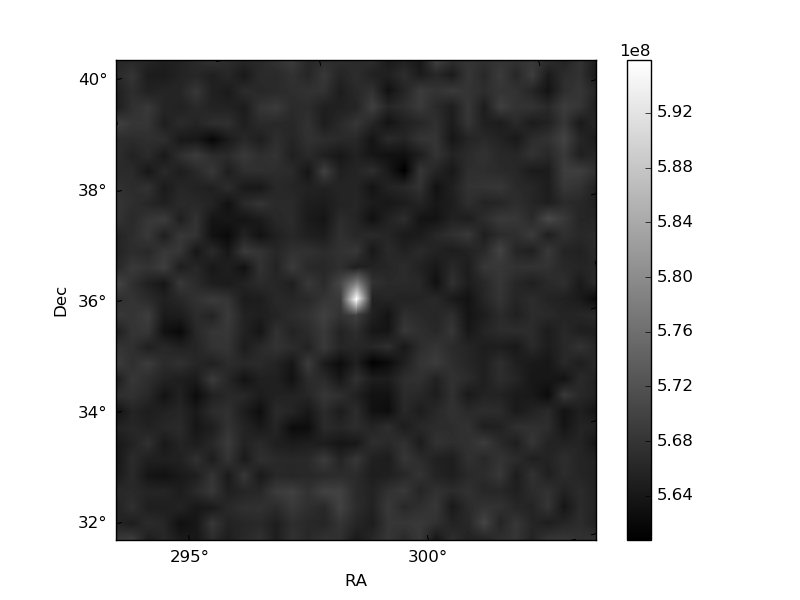
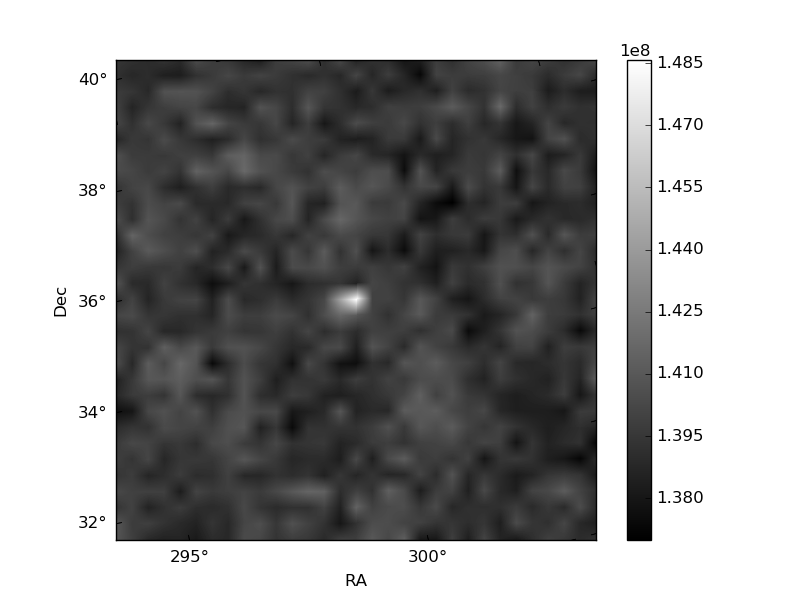
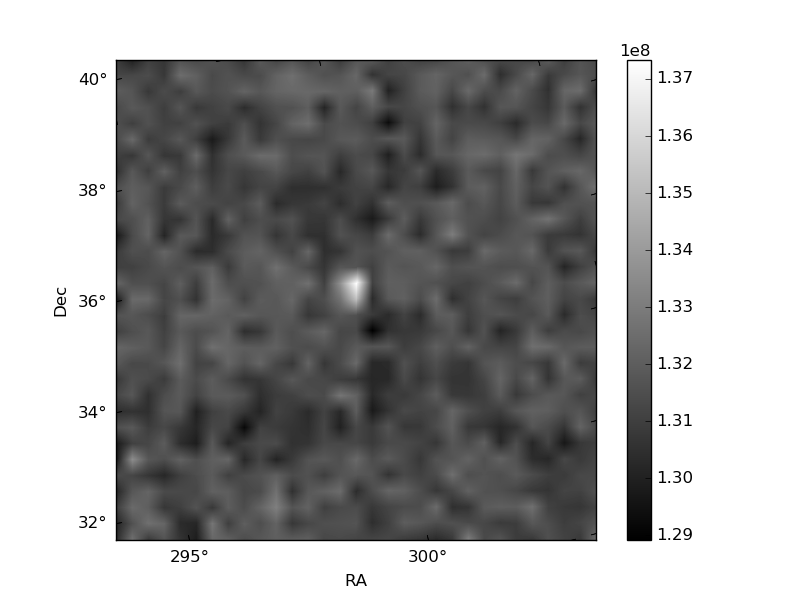
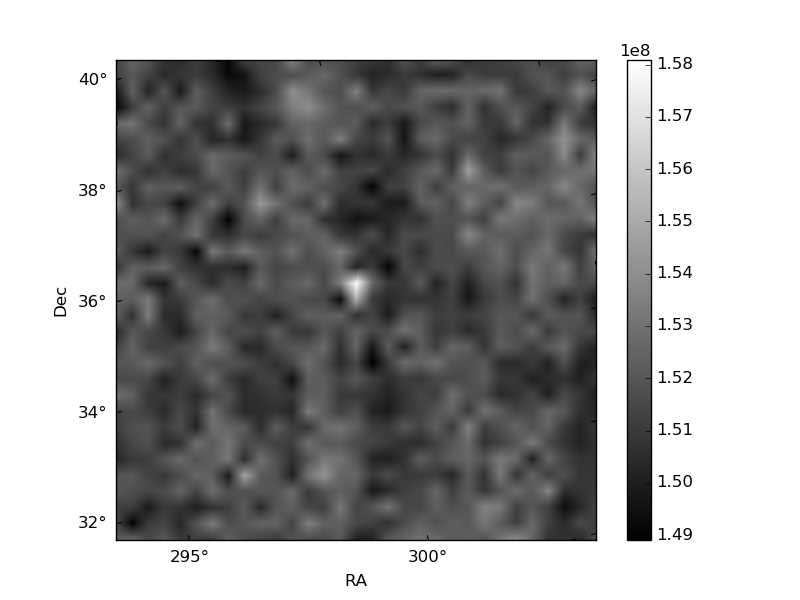
Histogram calculated using DETX and DETY for each event in the final _common_clean file
| Quadrant A | 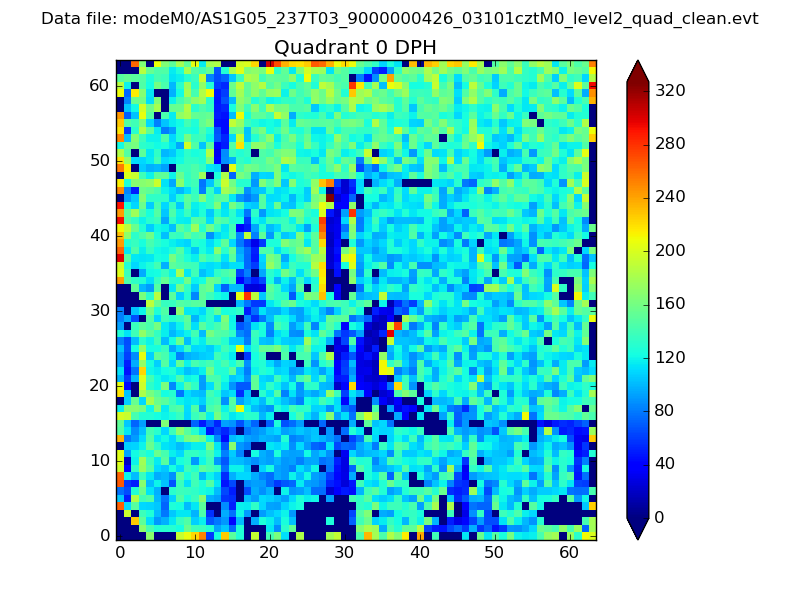 |
 |
Quadrant B |
|---|---|---|---|
| Quadrant D | 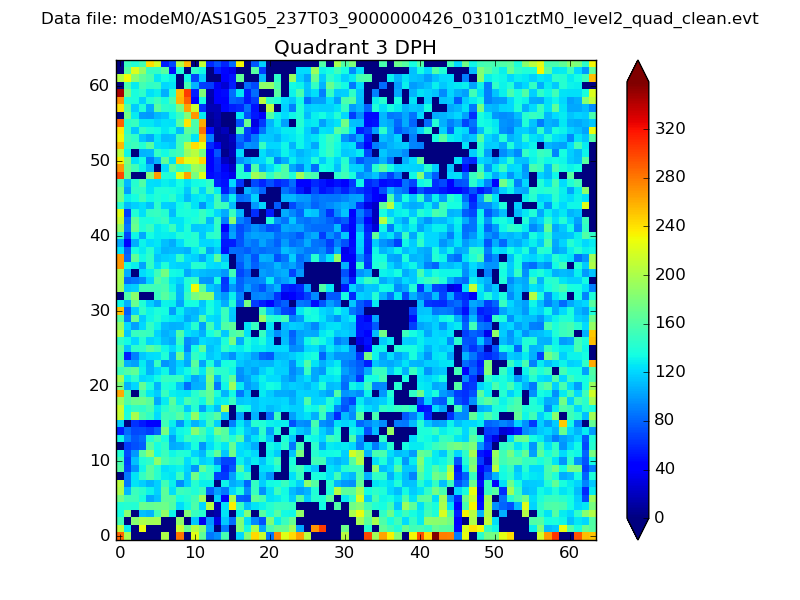 |
 |
Quadrant C |
| Plot type | Count rate plots | Images |
|---|---|---|
| Comparison with Poisson distribution Blue bars denote a histogram of data divided into 1 sec bins. Red curve is a Poisson curve with rate = median count rate of data. |
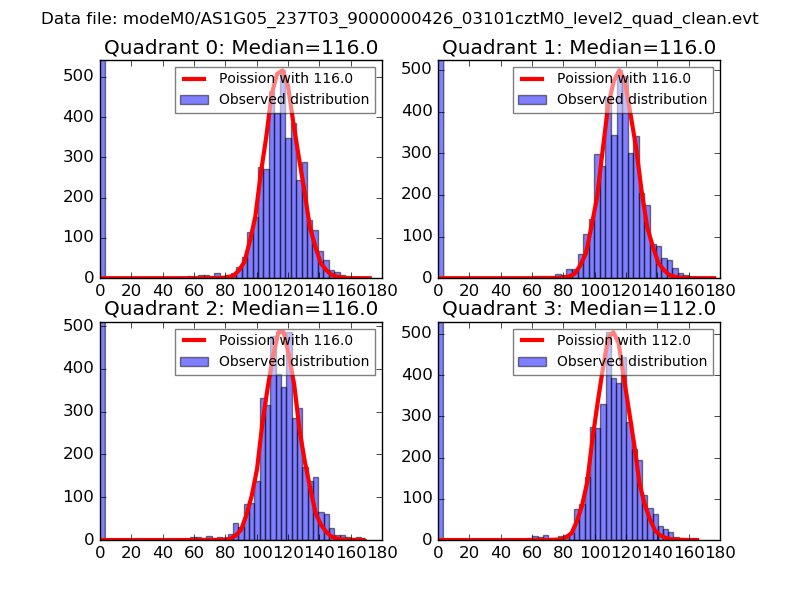 |
 |
| Quadrant-wise count rates Data is divided into 100 sec bins |
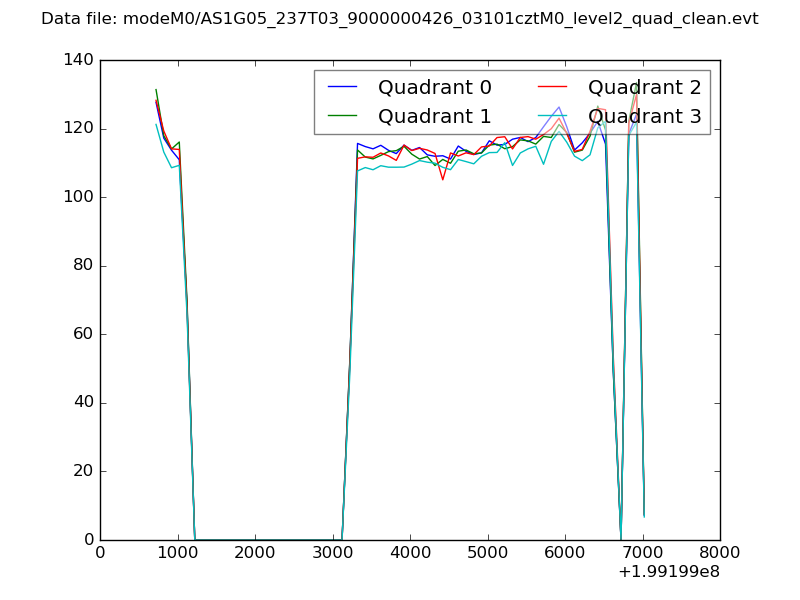 |
|
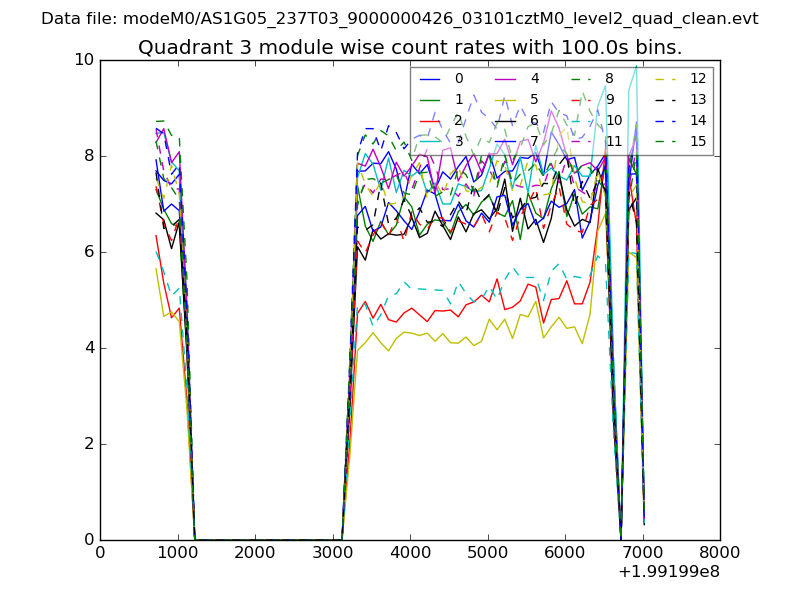
| Module-wise count rates for Quadrant A Data is divided into 100 sec bins |
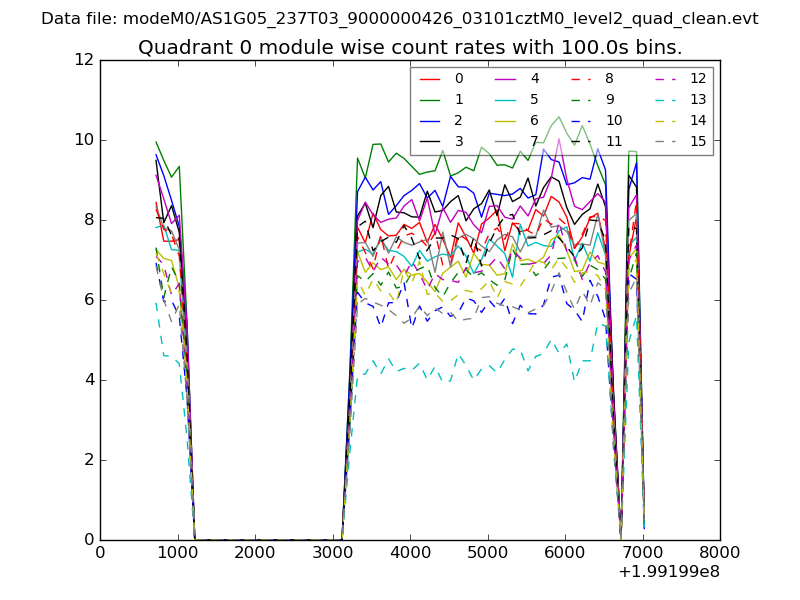 |
 |
| Module-wise count rates for Quadrant B Data is divided into 100 sec bins |
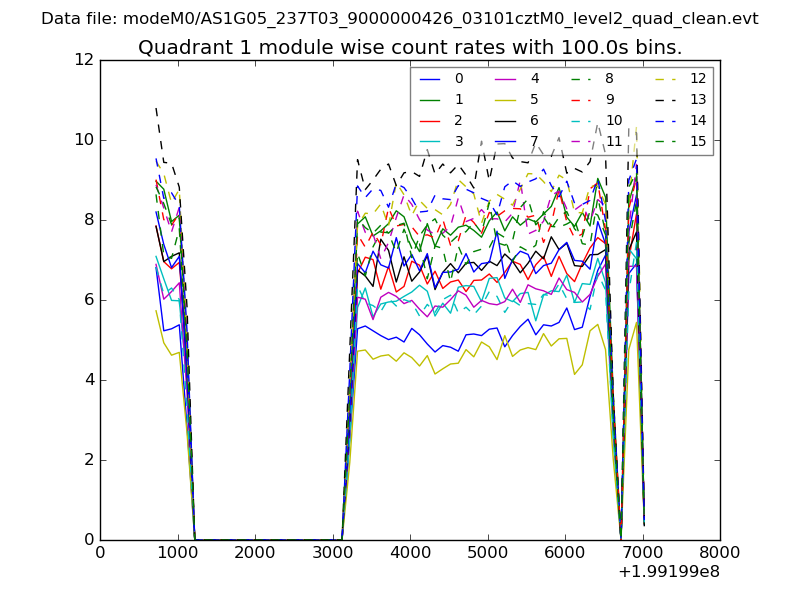 |
 |
| Module-wise count rates for Quadrant C Data is divided into 100 sec bins |
 |
 |
| Module-wise count rates for Quadrant D Data is divided into 100 sec bins |
 |
 |
| Parameter | Plot |
|---|---|
| CZT HV Monitor | 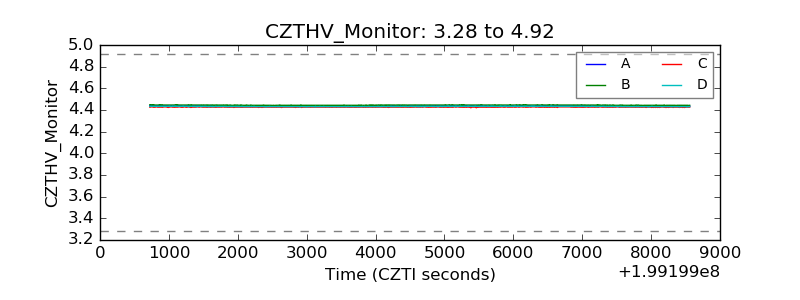 |
| D_VDD | 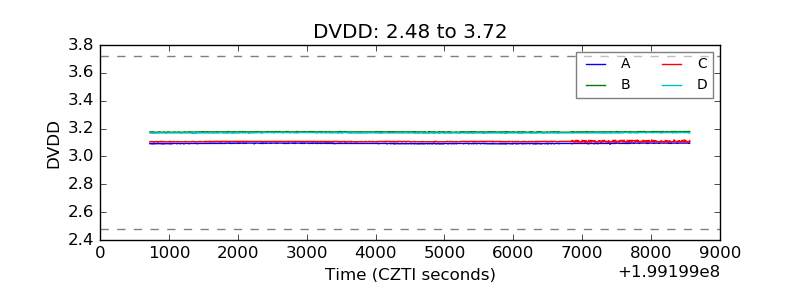 |
| Temperature 1 | 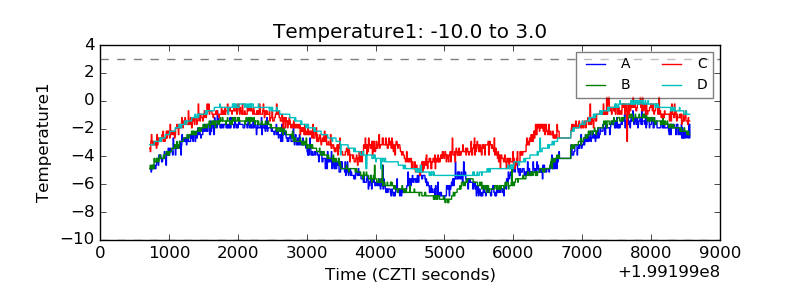 |
| Veto HV Monitor | 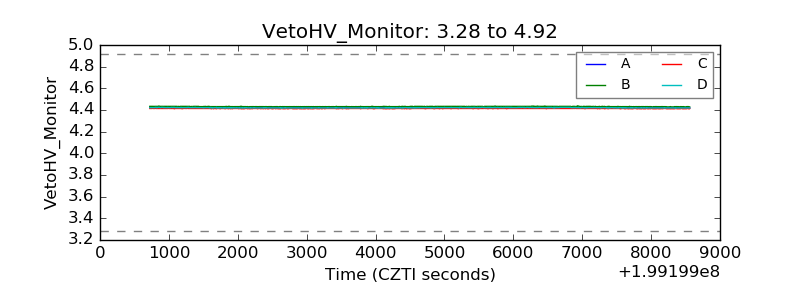 |
| Veto LLD | 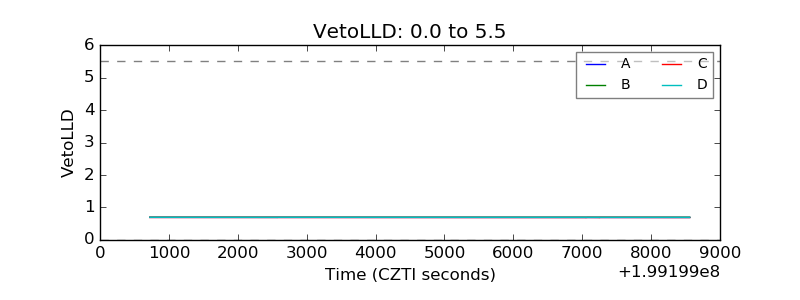 |
| Alpha Counter | 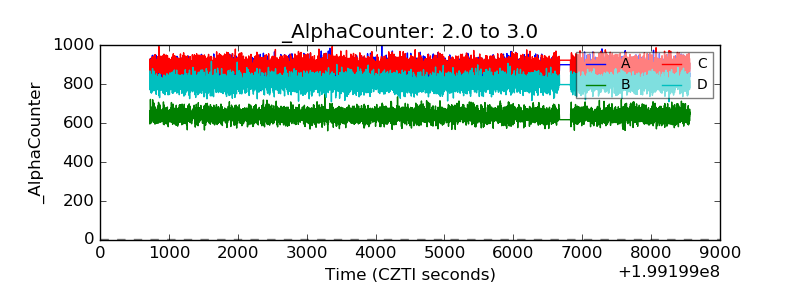 |
| _CPM_Rate | 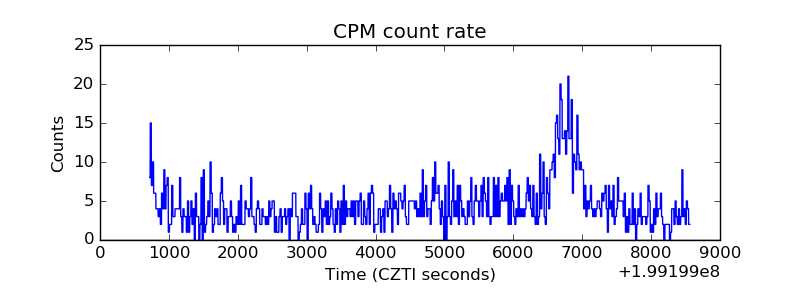 |
| CZT Counter | 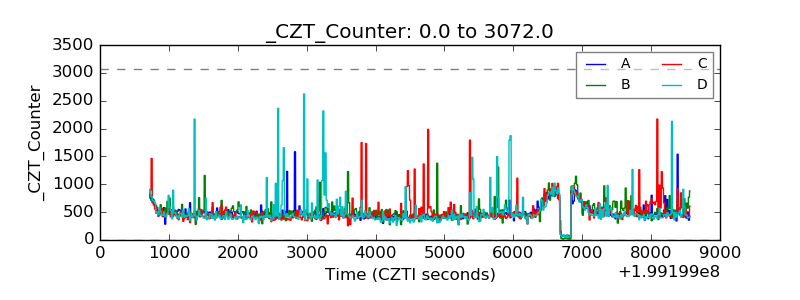 |
| +2.5 Volts monitor |  |
| +5 Volts monitor |  |
| _ROLL_ROT | 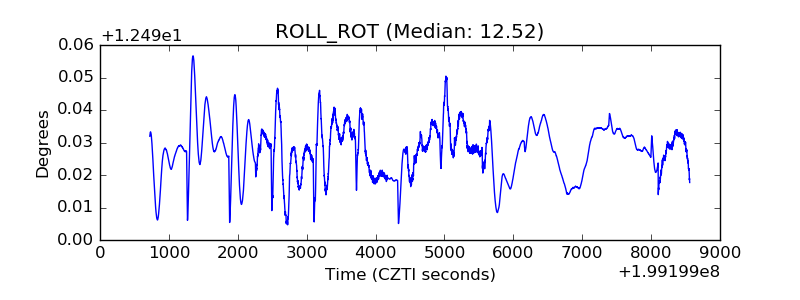 |
| _Roll_DEC | 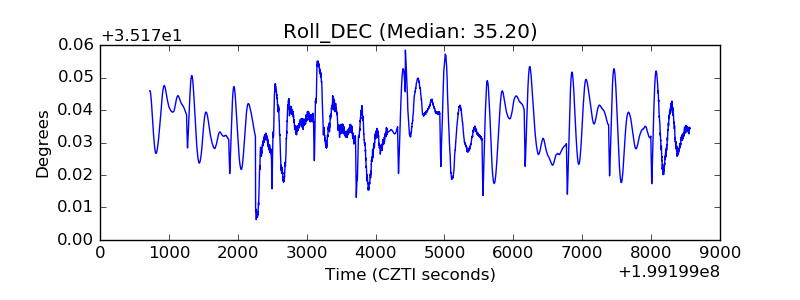 |
| _Roll_RA | 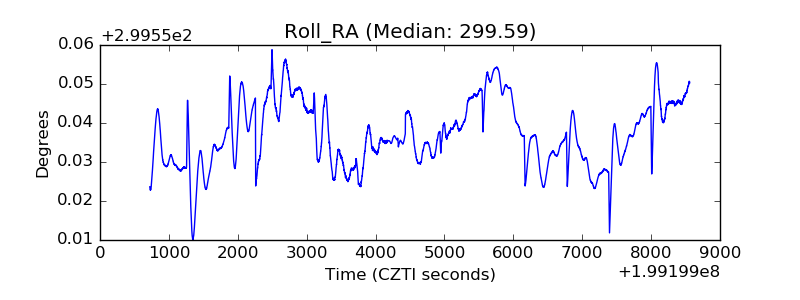 |
| Veto Counter |  |