| Param | Original file | Final file |
|---|---|---|
| Filename | modeM0/AS1G05_237T03_9000000426_03103cztM0_level2.evt | modeM0/AS1G05_237T03_9000000426_03103cztM0_level2_quad_clean.evt |
| Size (bytes) | 590,503,680 | 81,809,280 |
| Size | 563.1 MB | 78.0 MB |
| Events in quadrant A | 4,014,285 | 483,271 |
| Events in quadrant B | 4,994,430 | 476,141 |
| Events in quadrant C | 4,121,190 | 480,072 |
| Events in quadrant D | 4,195,359 | 466,092 |
| Mode M9 | |||
|---|---|---|---|
| Quadrant | BADHDUFLAG | Total packets | Discarded packets |
| A | 0 | 3 | 0 |
| B | 0 | 3 | 0 |
| C | 0 | 3 | 0 |
| D | 0 | 3 | 0 |
| Mode M0 | |||
|---|---|---|---|
| Quadrant | BADHDUFLAG | Total packets | Discarded packets |
| A | 0 | 17410 | 2 |
| B | 0 | 20388 | 1 |
| C | 0 | 17819 | 1 |
| D | 0 | 18361 | 1 |
| Mode SS | |||
|---|---|---|---|
| Quadrant | BADHDUFLAG | Total packets | Discarded packets |
| A | 0 | 166 | 0 |
| B | 0 | 166 | 0 |
| C | 0 | 166 | 0 |
| D | 0 | 166 | 0 |
| Quadrant | Total seconds | Saturated seconds | Saturation percentage |
|---|---|---|---|
| A | 8228 | 204 | 2.479339% |
| B | 8228 | 297 | 3.609626% |
| C | 8228 | 206 | 2.503646% |
| D | 8228 | 185 | 2.248420% |
Noise dominated data is calculated using 1-second bins in cleaned event files. If a bin has >2000 counts, and if more than 50% of those come from <1% of pixels, then it is considered to be noise-dominated and hence unusable.
| Quadrant | # 1 sec bins | Bins with >0 counts | Bins with >2000 counts | High rate bins dominated by noise | Noise dominated (total time) | Noise dominated (detector-on time) | Marked lightcurve |
|---|---|---|---|---|---|---|---|
| A | 8503 | 8229 | 12 | 12 | 0.14% | 0.15% | 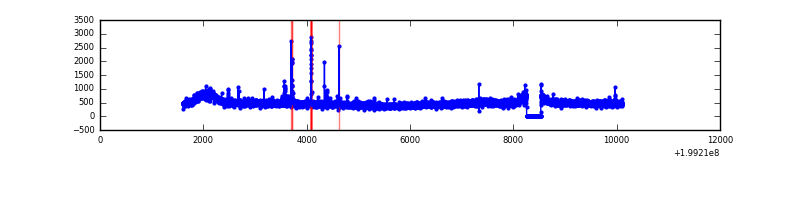 |
| B | 8503 | 8229 | 58 | 58 | 0.68% | 0.70% | 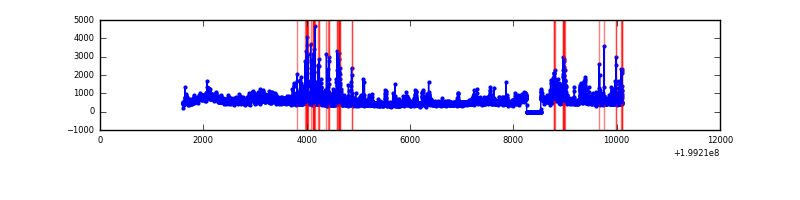 |
| C | 8503 | 8229 | 19 | 19 | 0.22% | 0.23% | 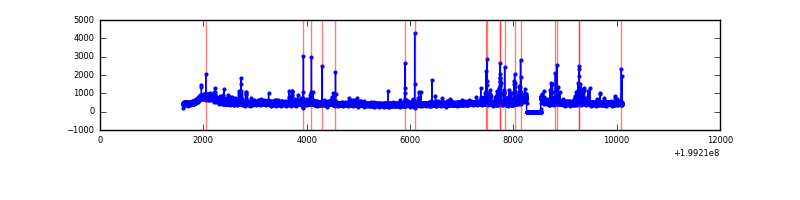 |
| D | 8503 | 8229 | 25 | 25 | 0.29% | 0.30% | 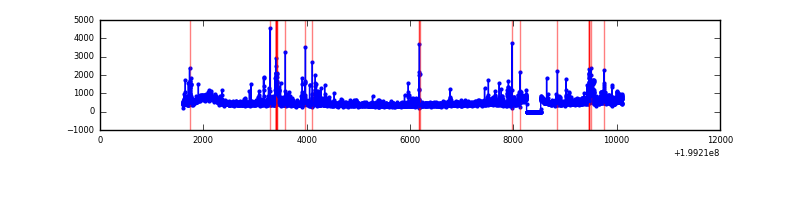 |
Top three noisy pixels from each quadrant. If the there are fewer than three noisy pixels in the level2.evt file, extra rows are filled as -1
| Pixel properties | Quadrant properties | ||||||
|---|---|---|---|---|---|---|---|
| Quadrant | DetID | PixID | Counts | Sigma | Mean | Median | Sigma |
| A | 8 | 15 | 99285 | 479.27 | 993 | 968 | 205.1 |
| A | 12 | 247 | 61018 | 292.73 | 993 | 968 | 205.1 |
| A | 0 | 226 | 10995 | 48.88 | 993 | 968 | 205.1 |
| B | 1 | 223 | 342995 | 1745.49 | 999 | 976 | 195.9 |
| B | 15 | 204 | 305174 | 1552.47 | 999 | 976 | 195.9 |
| B | 14 | 167 | 175416 | 890.25 | 999 | 976 | 195.9 |
| C | 14 | 223 | 148026 | 658.23 | 959 | 962 | 223.4 |
| C | 6 | 80 | 43826 | 191.85 | 959 | 962 | 223.4 |
| C | 5 | 250 | 41072 | 179.52 | 959 | 962 | 223.4 |
| D | 13 | 114 | 204811 | 778.0 | 954 | 929 | 262.1 |
| D | 2 | 136 | 95437 | 360.64 | 954 | 929 | 262.1 |
| D | 13 | 29 | 71226 | 268.25 | 954 | 929 | 262.1 |
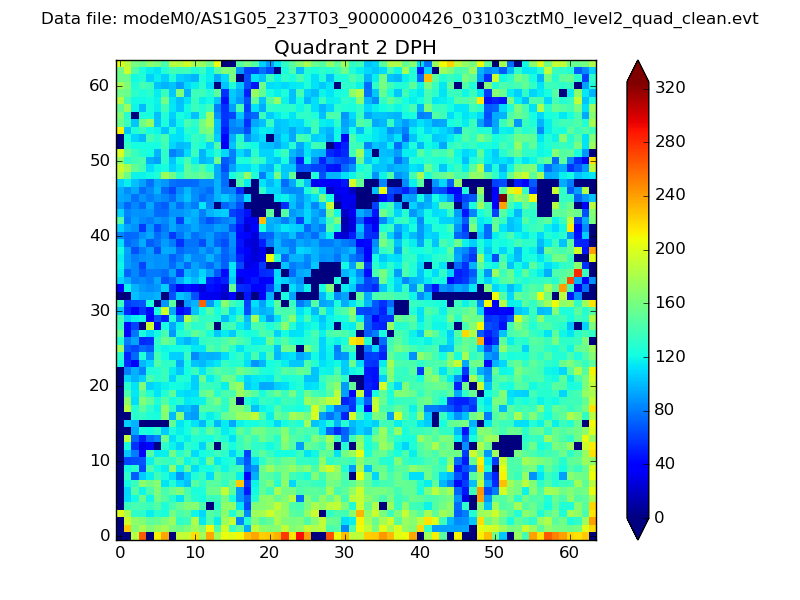
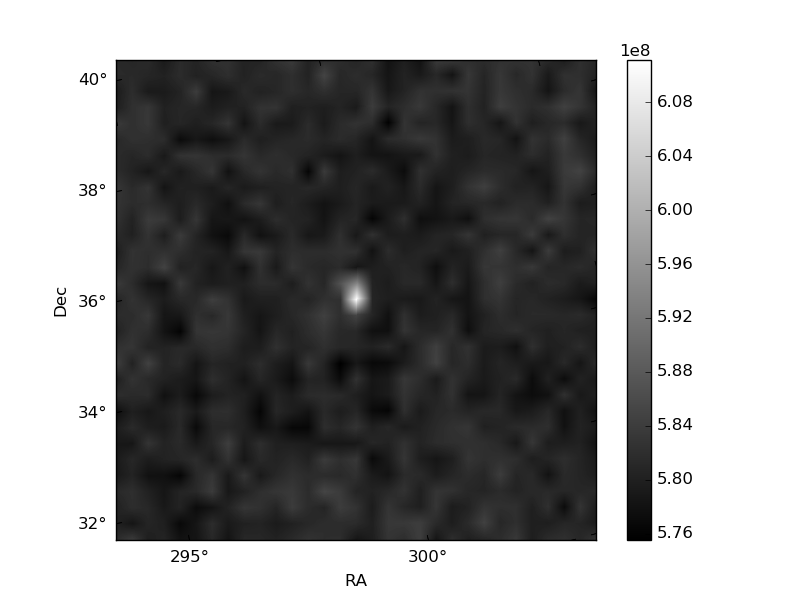
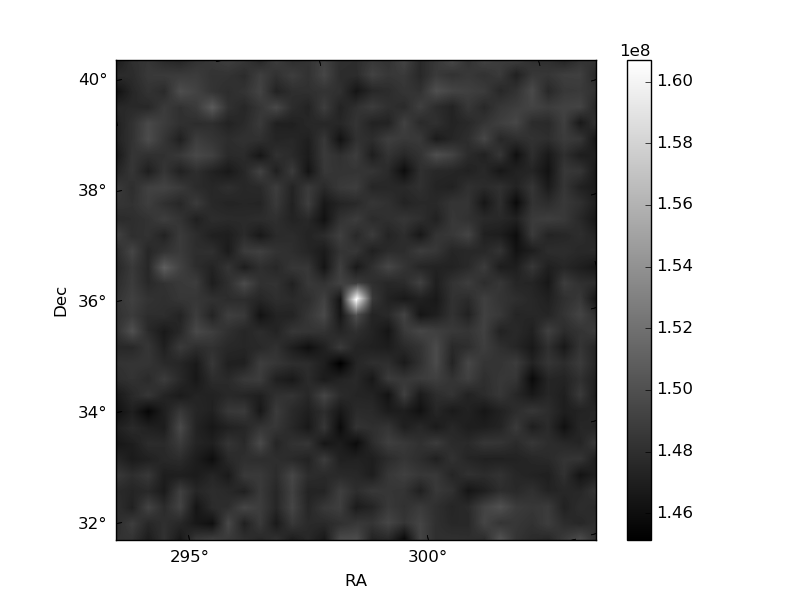
Histogram calculated using DETX and DETY for each event in the final _common_clean file
| Quadrant A | 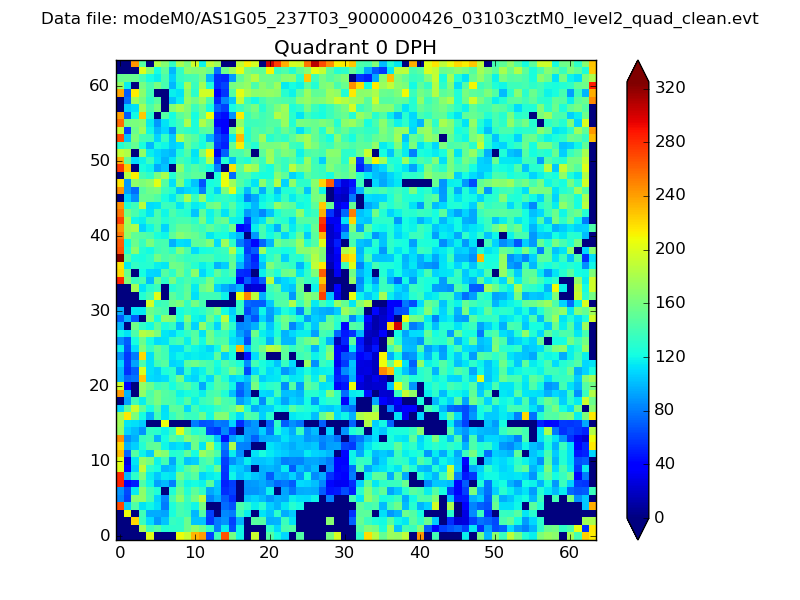 |
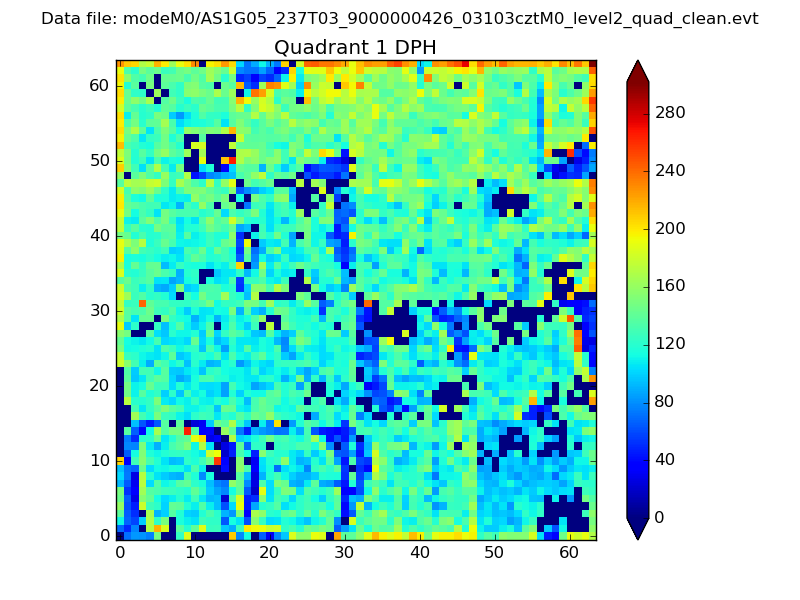 |
Quadrant B |
|---|---|---|---|
| Quadrant D | 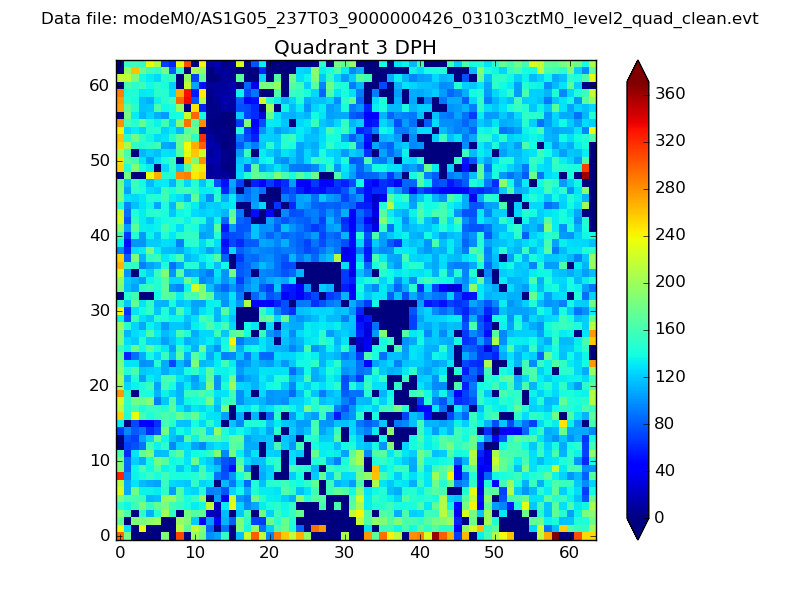 |
 |
Quadrant C |
| Plot type | Count rate plots | Images |
|---|---|---|
| Comparison with Poisson distribution Blue bars denote a histogram of data divided into 1 sec bins. Red curve is a Poisson curve with rate = median count rate of data. |
 |
 |
| Quadrant-wise count rates Data is divided into 100 sec bins |
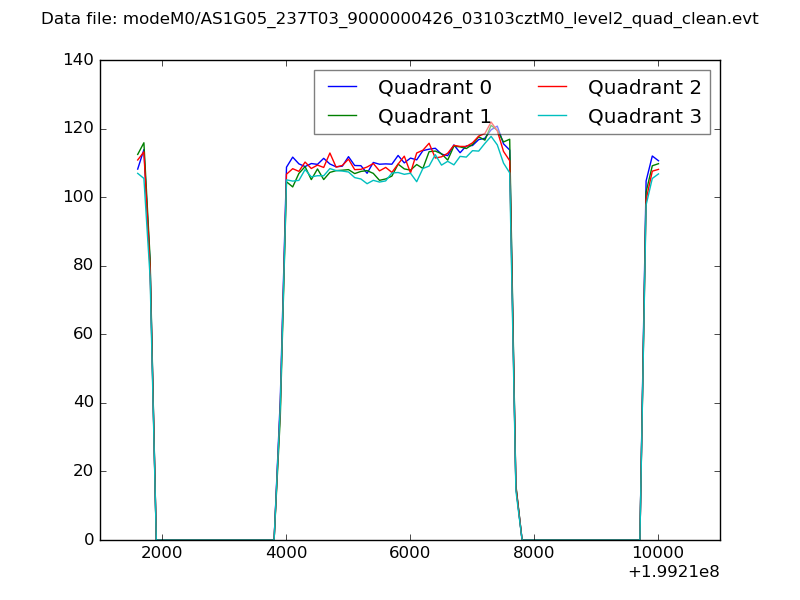 |
|
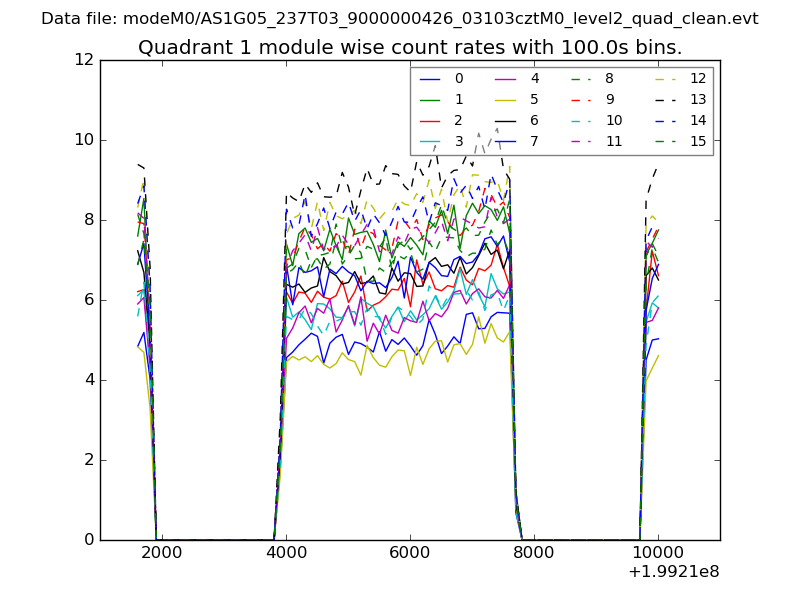
| Module-wise count rates for Quadrant A Data is divided into 100 sec bins |
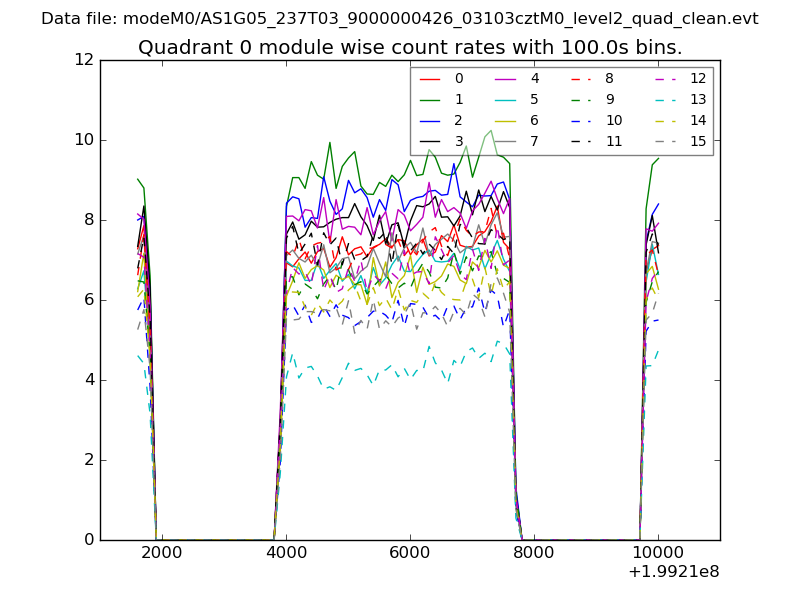 |
 |
| Module-wise count rates for Quadrant B Data is divided into 100 sec bins |
 |
 |
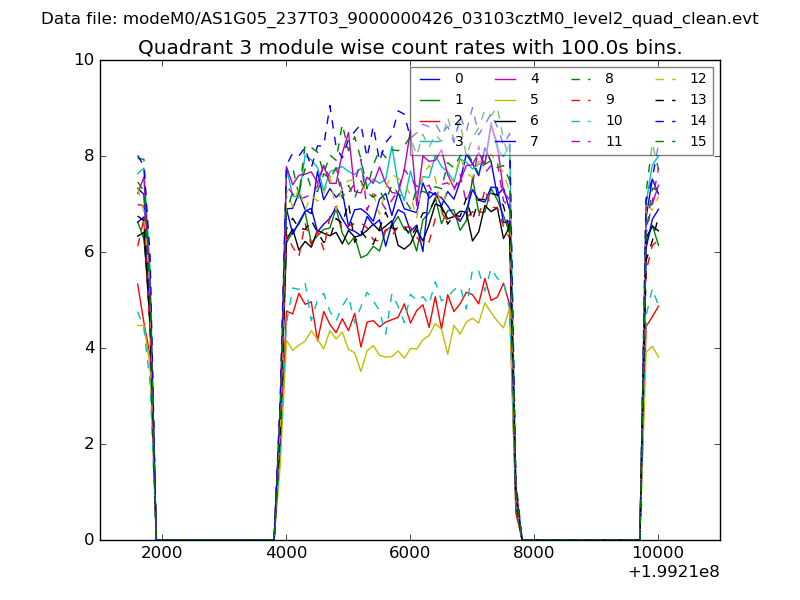
| Module-wise count rates for Quadrant C Data is divided into 100 sec bins |
 |
 |
| Module-wise count rates for Quadrant D Data is divided into 100 sec bins |
 |
 |
| Parameter | Plot |
|---|---|
| CZT HV Monitor | 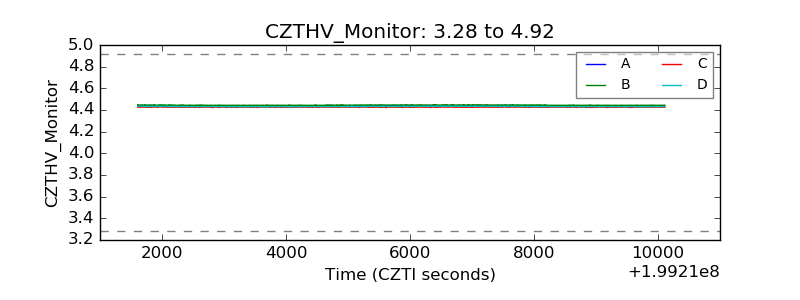 |
| D_VDD | 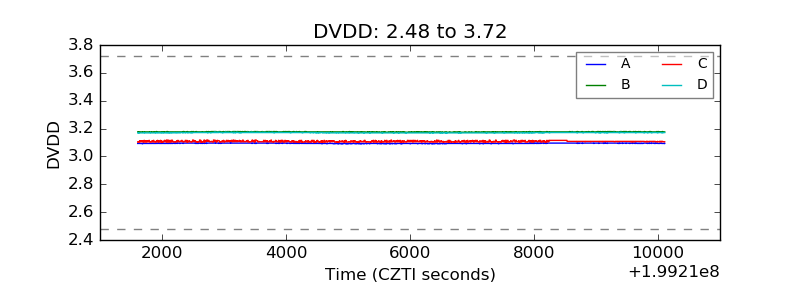 |
| Temperature 1 | 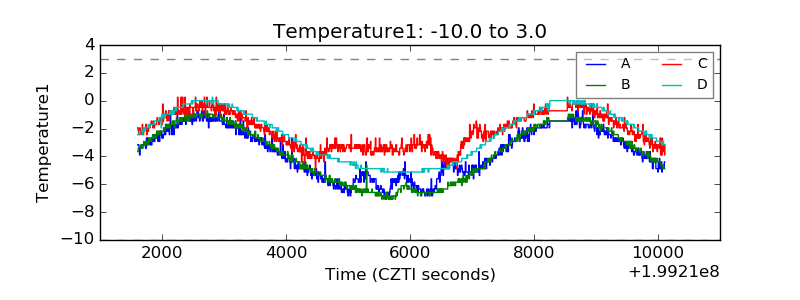 |
| Veto HV Monitor | 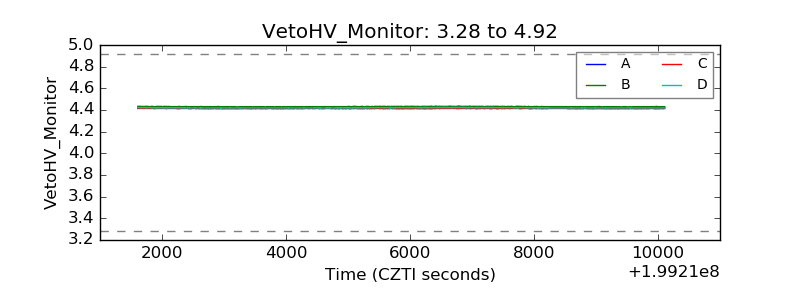 |
| Veto LLD | 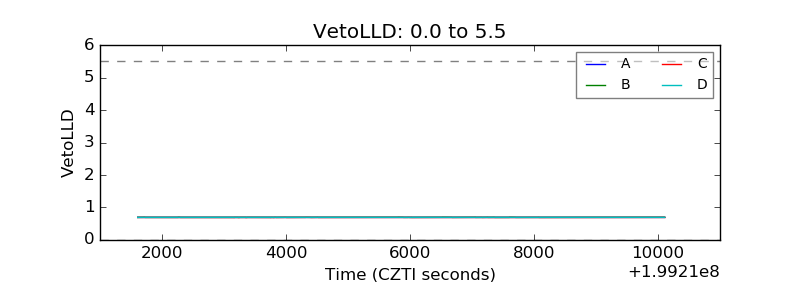 |
| Alpha Counter | 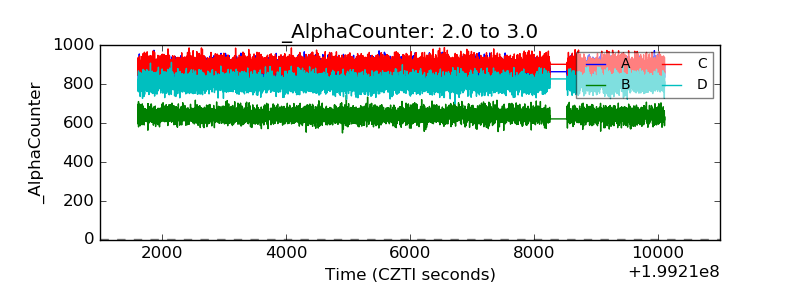 |
| _CPM_Rate | 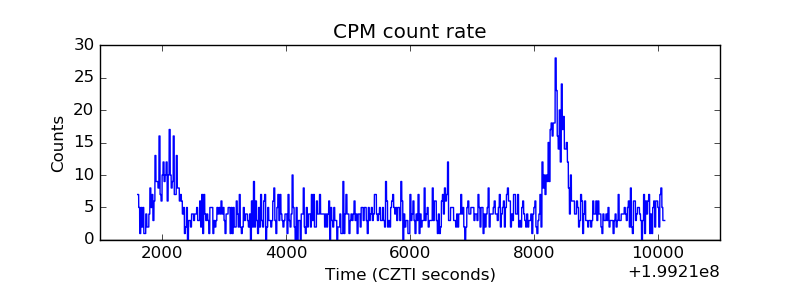 |
| CZT Counter | 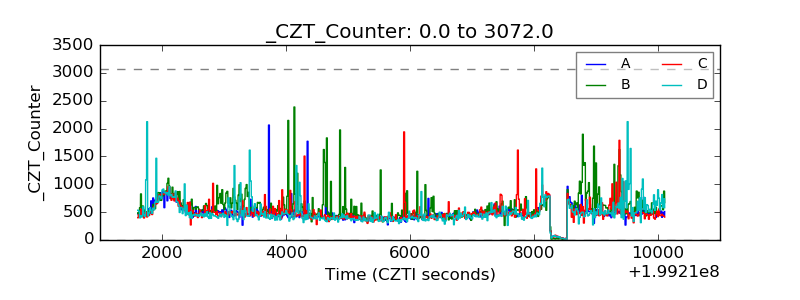 |
| +2.5 Volts monitor |  |
| +5 Volts monitor |  |
| _ROLL_ROT | 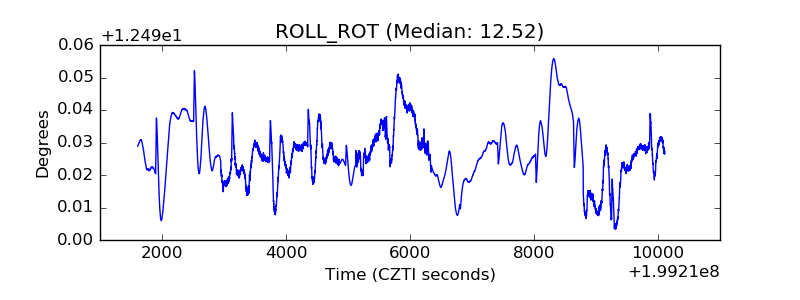 |
| _Roll_DEC | 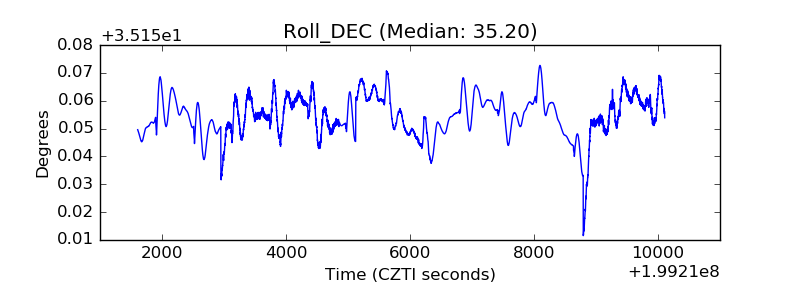 |
| _Roll_RA | 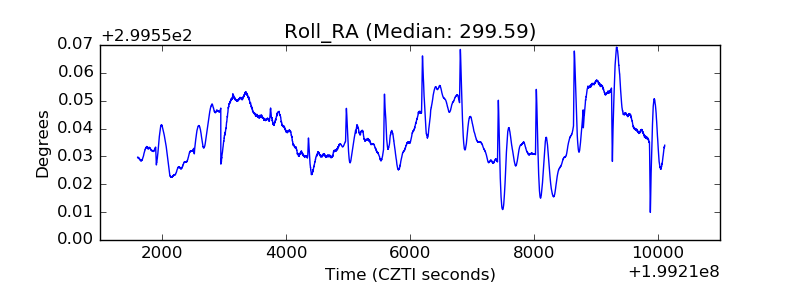 |
| Veto Counter |  |